-
-
Homepage
-

Logo
-
Crowd Tracker

Inspiration
When Andy was 8 years old, his parents drove him to Galveston for a day at the beach. He spent the whole 2-hour drive excited to get in the water for the first time in a while. But when they stepped out of the car, the smell was awful. The sand was lined with thousands of dead fish. A red tide had swept in without anyone warning them, and the day was ruined. That's why we built Beach Day: an app that puts beach conditions in one easy place, so nobody has to go through what Andy did.
What it does
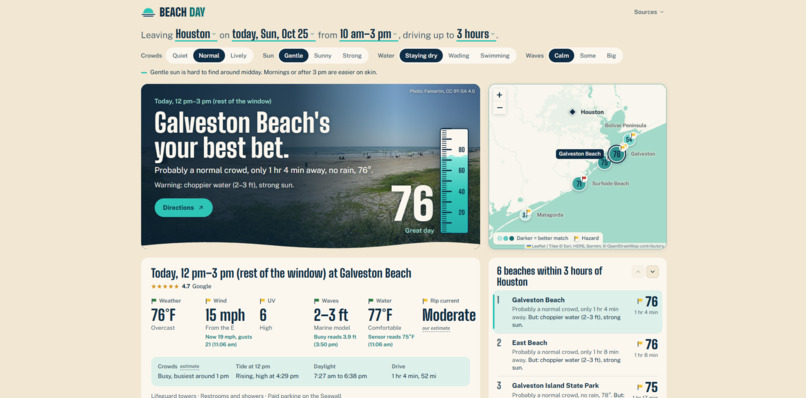
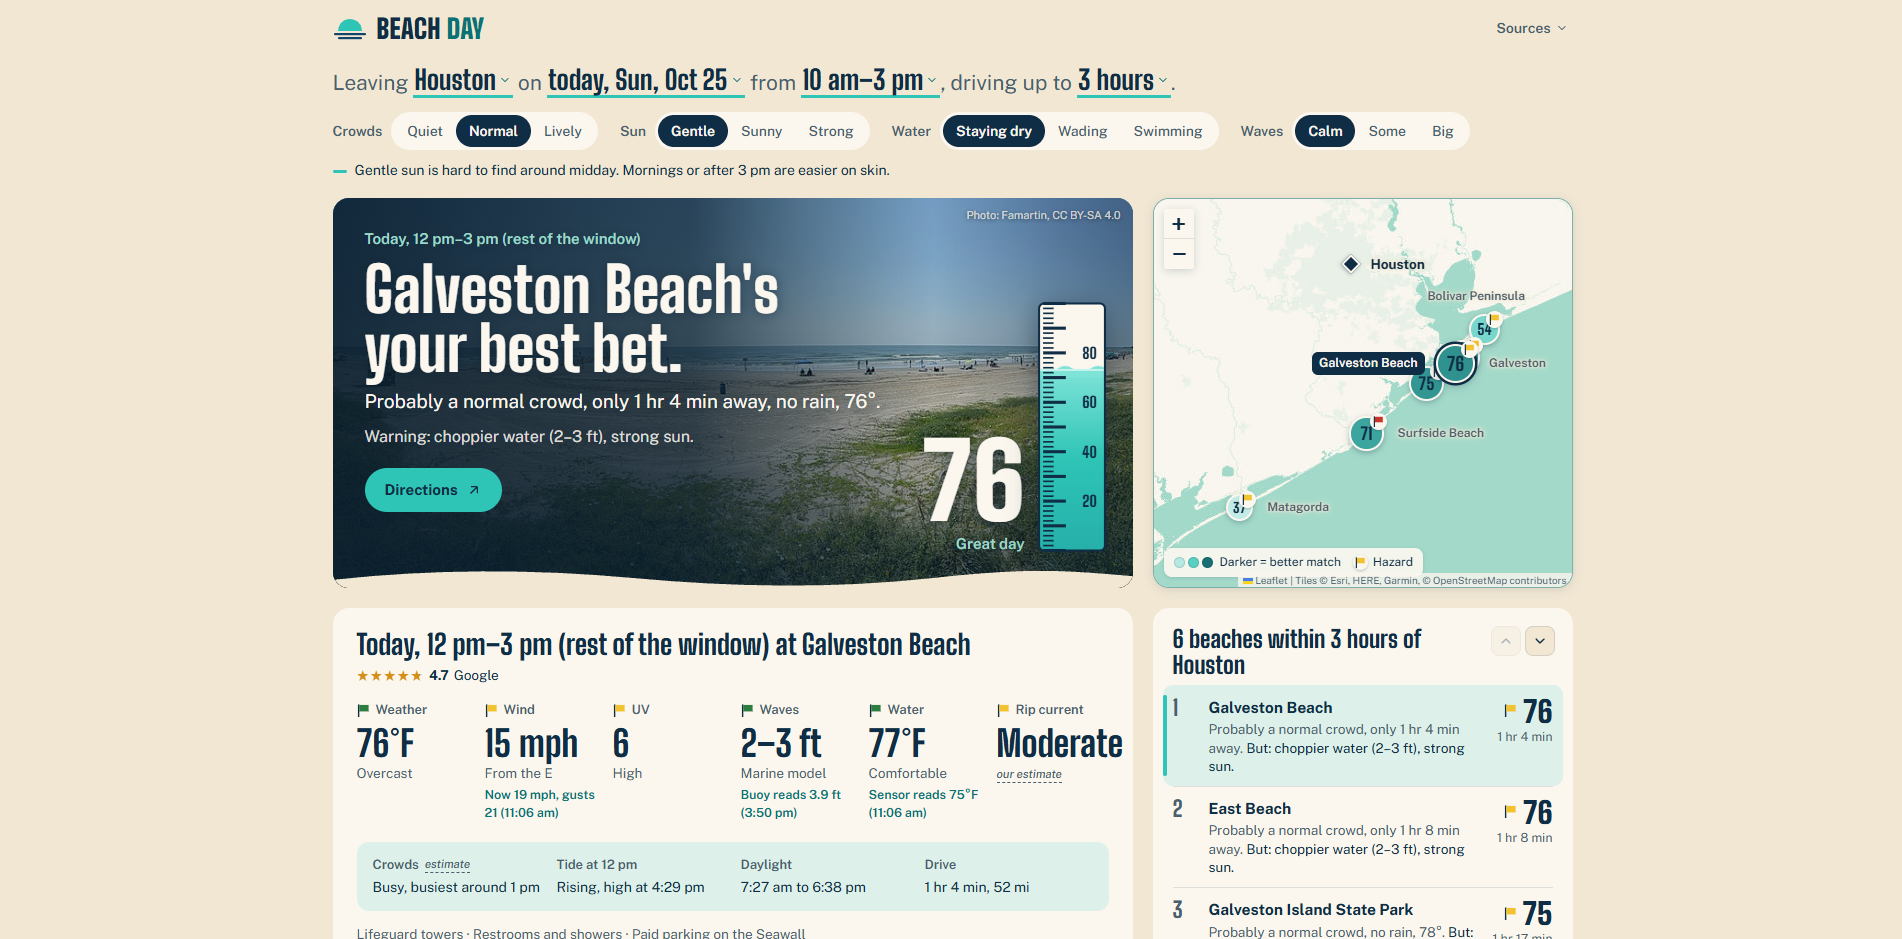
Beach Day brings all the beach data you need into one place, so you don't have to jump between a weather app, a surf report and a tide chart. You tell it where you're leaving from, what day and time you want to go, and how far you're willing to drive. Then you set your preferences for crowds, sun, swimming and waves. Beach Day scores 13 Texas beaches on waves, water temperature, wind, UV, rip currents, bacteria levels, crowds, weather alerts, drive time and more, and ranks them for you. It explains its pick in plain English, shows exactly how each score was calculated, and always shows safety warnings, no matter how good the score is.
How we built it
We built Beach Day with a React frontend and a Python FastAPI backend. Behind it are several public data sources:
- Weather and wave forecasts up to 16 days out from Open-Meteo
- Rip current forecasts and alerts from the National Weather Service
- Tides and live water sensors from NOAA
- Live wave heights from NDBC buoys
- Bacteria test results from the Texas General Land Office's Beach Watch program
- Drive times from road routing, with live traffic when available
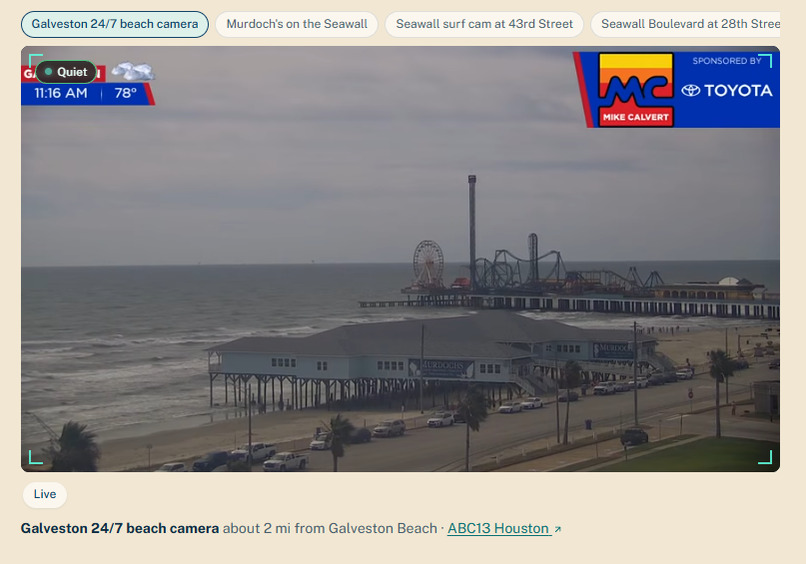
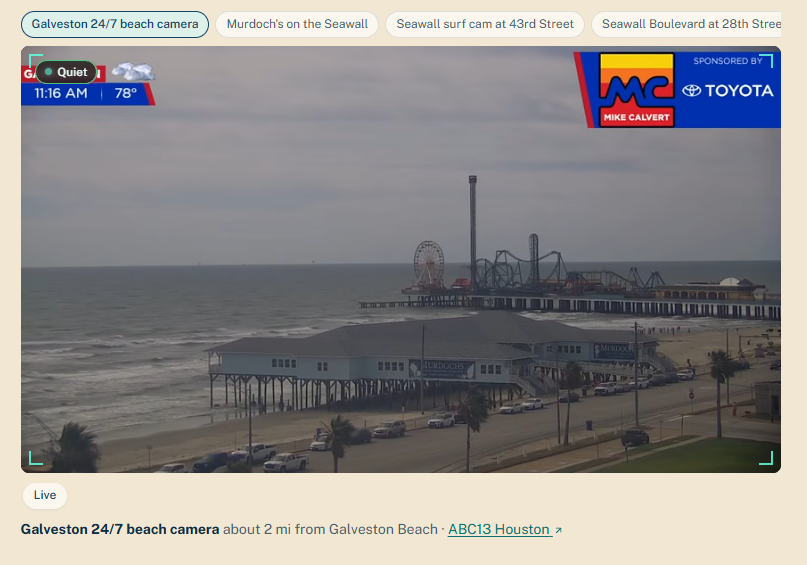
We also embedded 12 live beach cams and built a computer vision pipeline that reads frames from each cam and estimates how crowded the beach is right now.
Challenges we ran into
Our biggest challenge was showing a new user a lot of data without overwhelming them, while still keeping everything that matters. Our weighting system also took a lot of tuning: we had to decide how much each preference should count so the top score actually matched the best beach. Scanning the live streams was hard too. The browser won't let a website read video from another site's player, so we had to find a way for our server to grab still frames from each camera provider. Then we had to get the counts accurate even when people were tiny specks far down the beach. Some camera owners block their streams from being shown on other sites, so we had to hunt down ones that allowed it.
Accomplishments that we're proud of
Our flag system solves the UI/UX problem of too much data. It uses the same green, yellow and red flags lifeguards fly to show, at a glance, how the day's conditions will affect you. Our Beach Score pulls together data from multiple sources and accurately ranks which beach best fits your preferences. And it's transparent: you can open the score breakdown and see exactly where every point came from. We're also proud of the live AI crowd levels on the beach cams, which run two computer vision models on every frame.
What we learned
We learned how to pull in multiple live data streams and combine them into one simple, easy-to-understand interface. Implementing the YOLOX-S object detector taught us a lot. We paired it with a second model, DM-Count, that estimates crowd density, because a detector alone misses people in dense crowds. Turning those raw detections into a reliable Quiet, Moderate or Busy rating was one of the hardest parts. We also learned to be honest about uncertainty: every number in the app is labeled as official, measured, forecast or estimated.
What's next for Beach Day
We want to expand from the Texas coast to beaches across the United States so we can reach a much wider audience. We also want to use historical data so people can plan beach trips months in advance.
Built With
- asyncio
- esri
- fastapi
- git
- httpx
- javascript
- leaflet.js
- litert
- noaa
- node.js
- numpy
- nws
- onnxruntime
- openmetroapi
- osrm
- oxlint
- pillow
- python
- react
- tomtom-api
- uv
- vite
- yolox-s


Log in or sign up for Devpost to join the conversation.