-
-
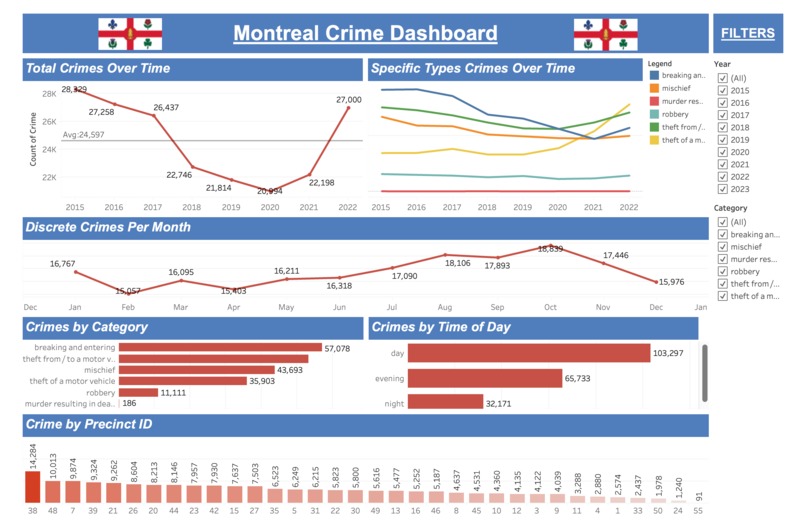
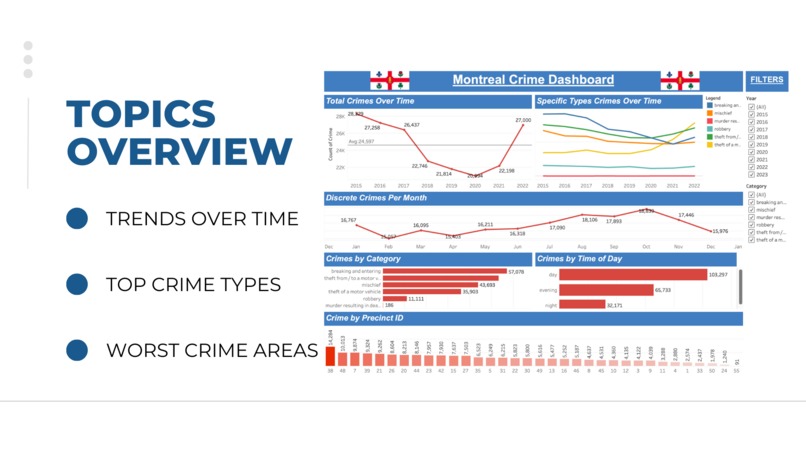
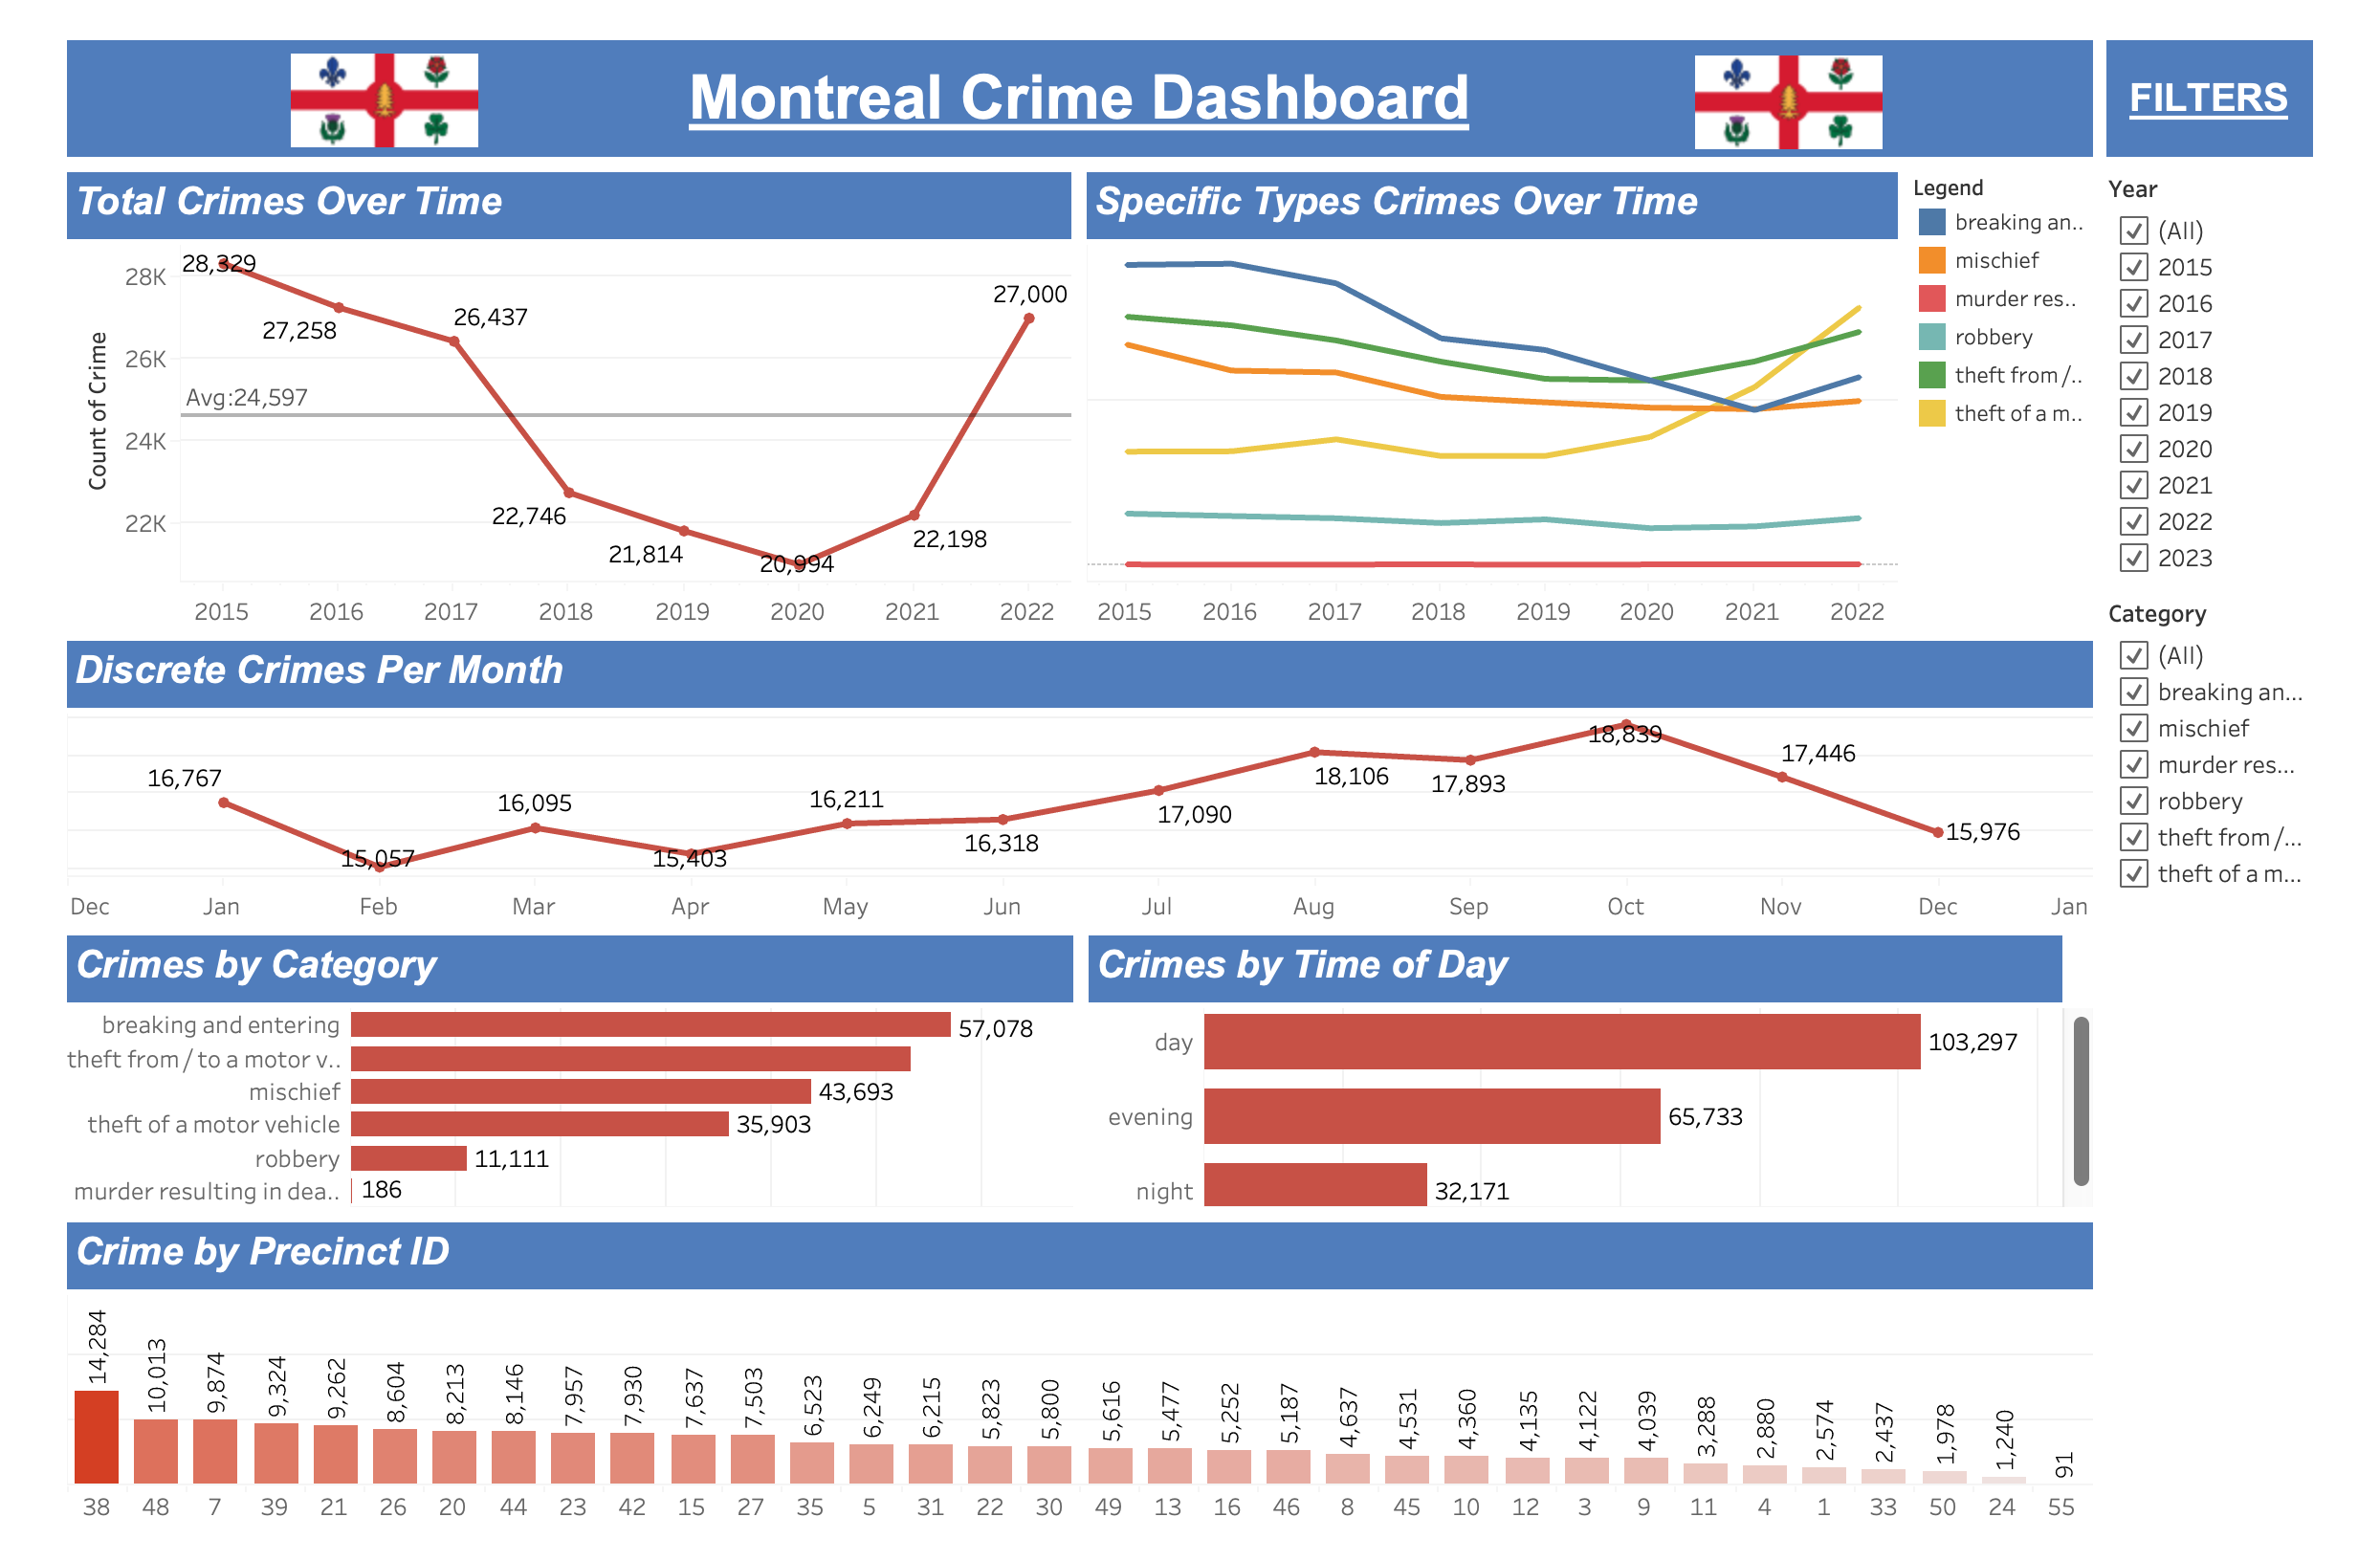
Tableau Dashboard (Screenshot, see link to try it out)
-
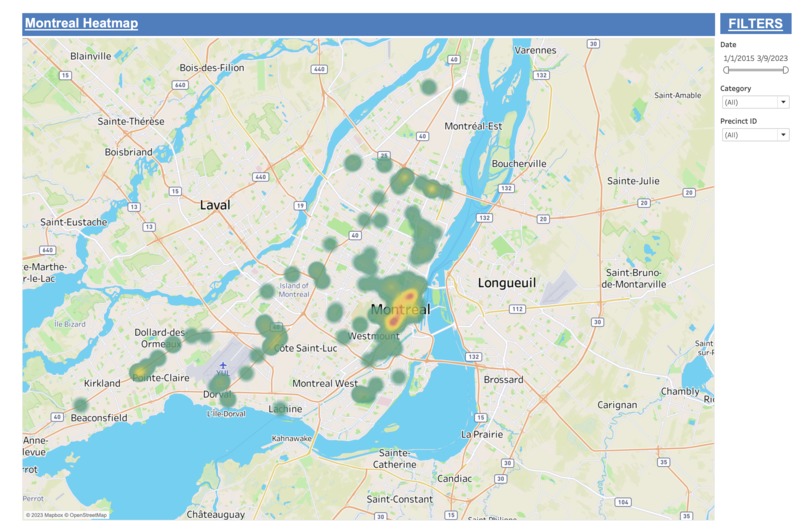
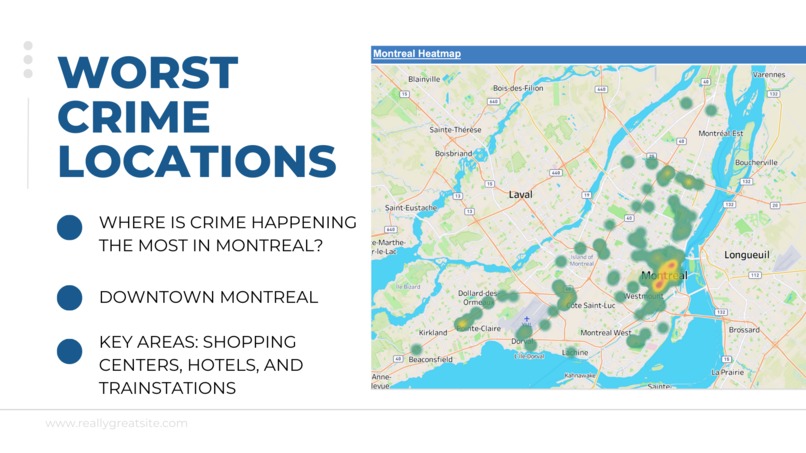
Tableau Dashboard Heatmap
-

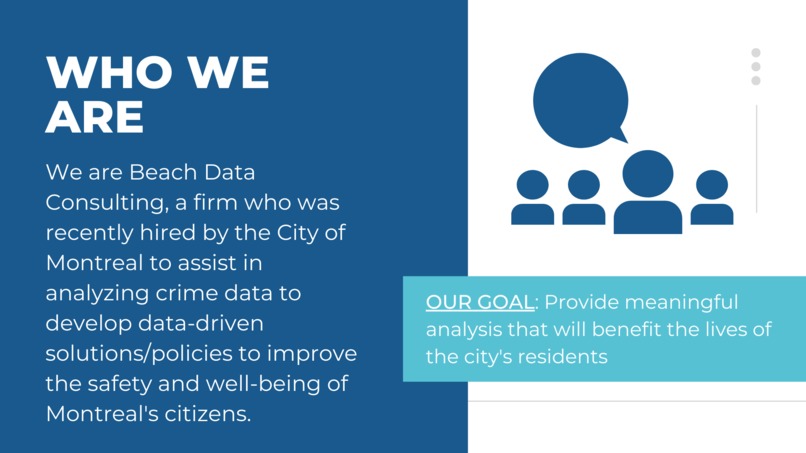
Presentation-1
-
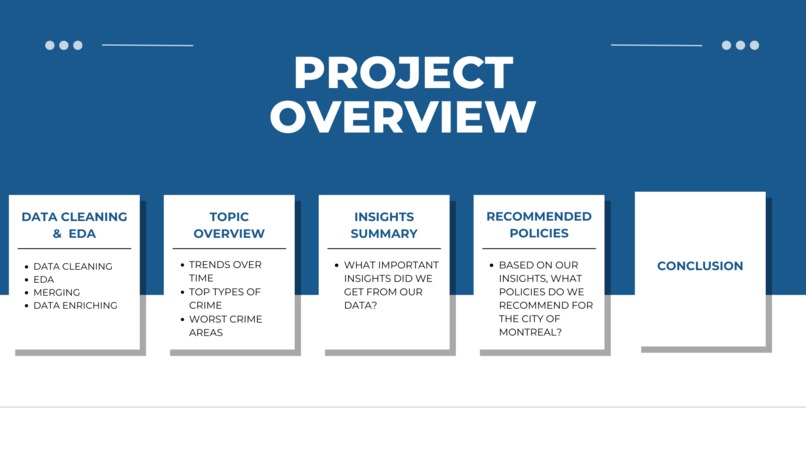
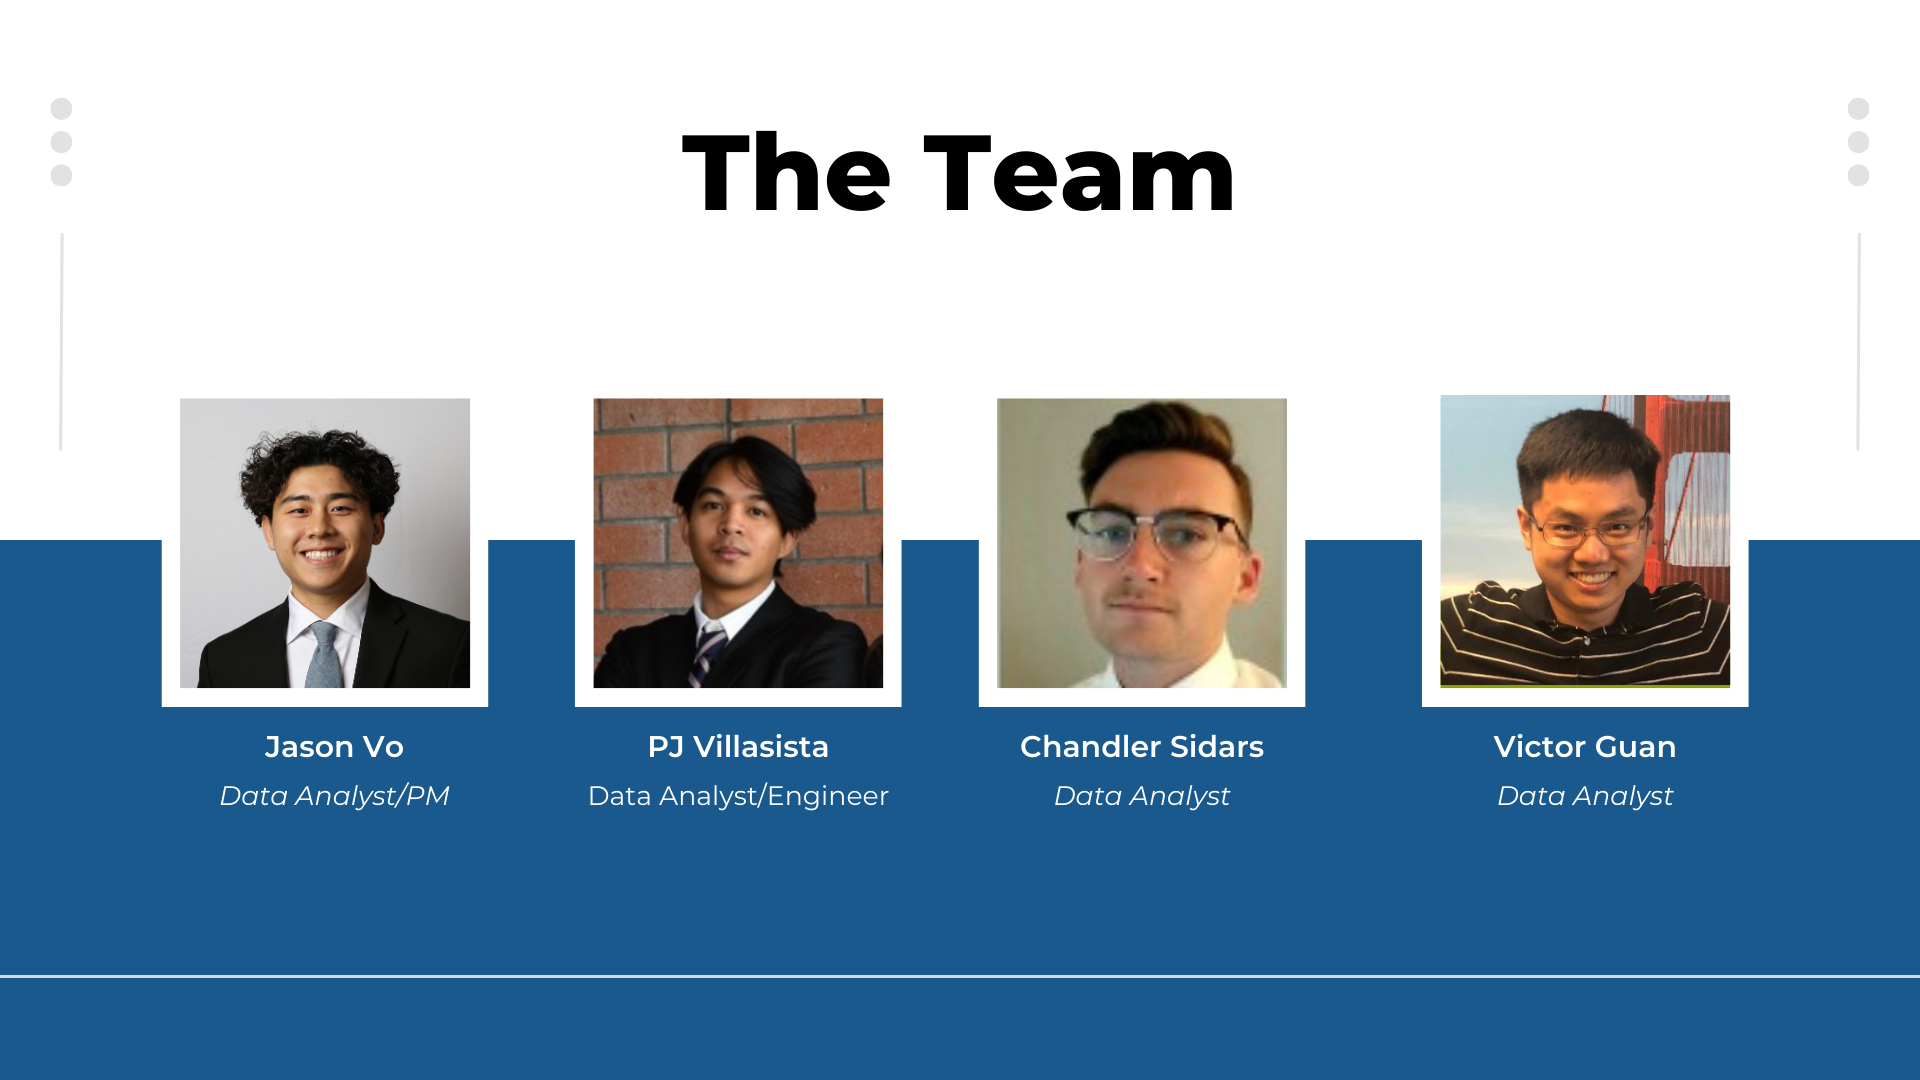
Presentation-2
-

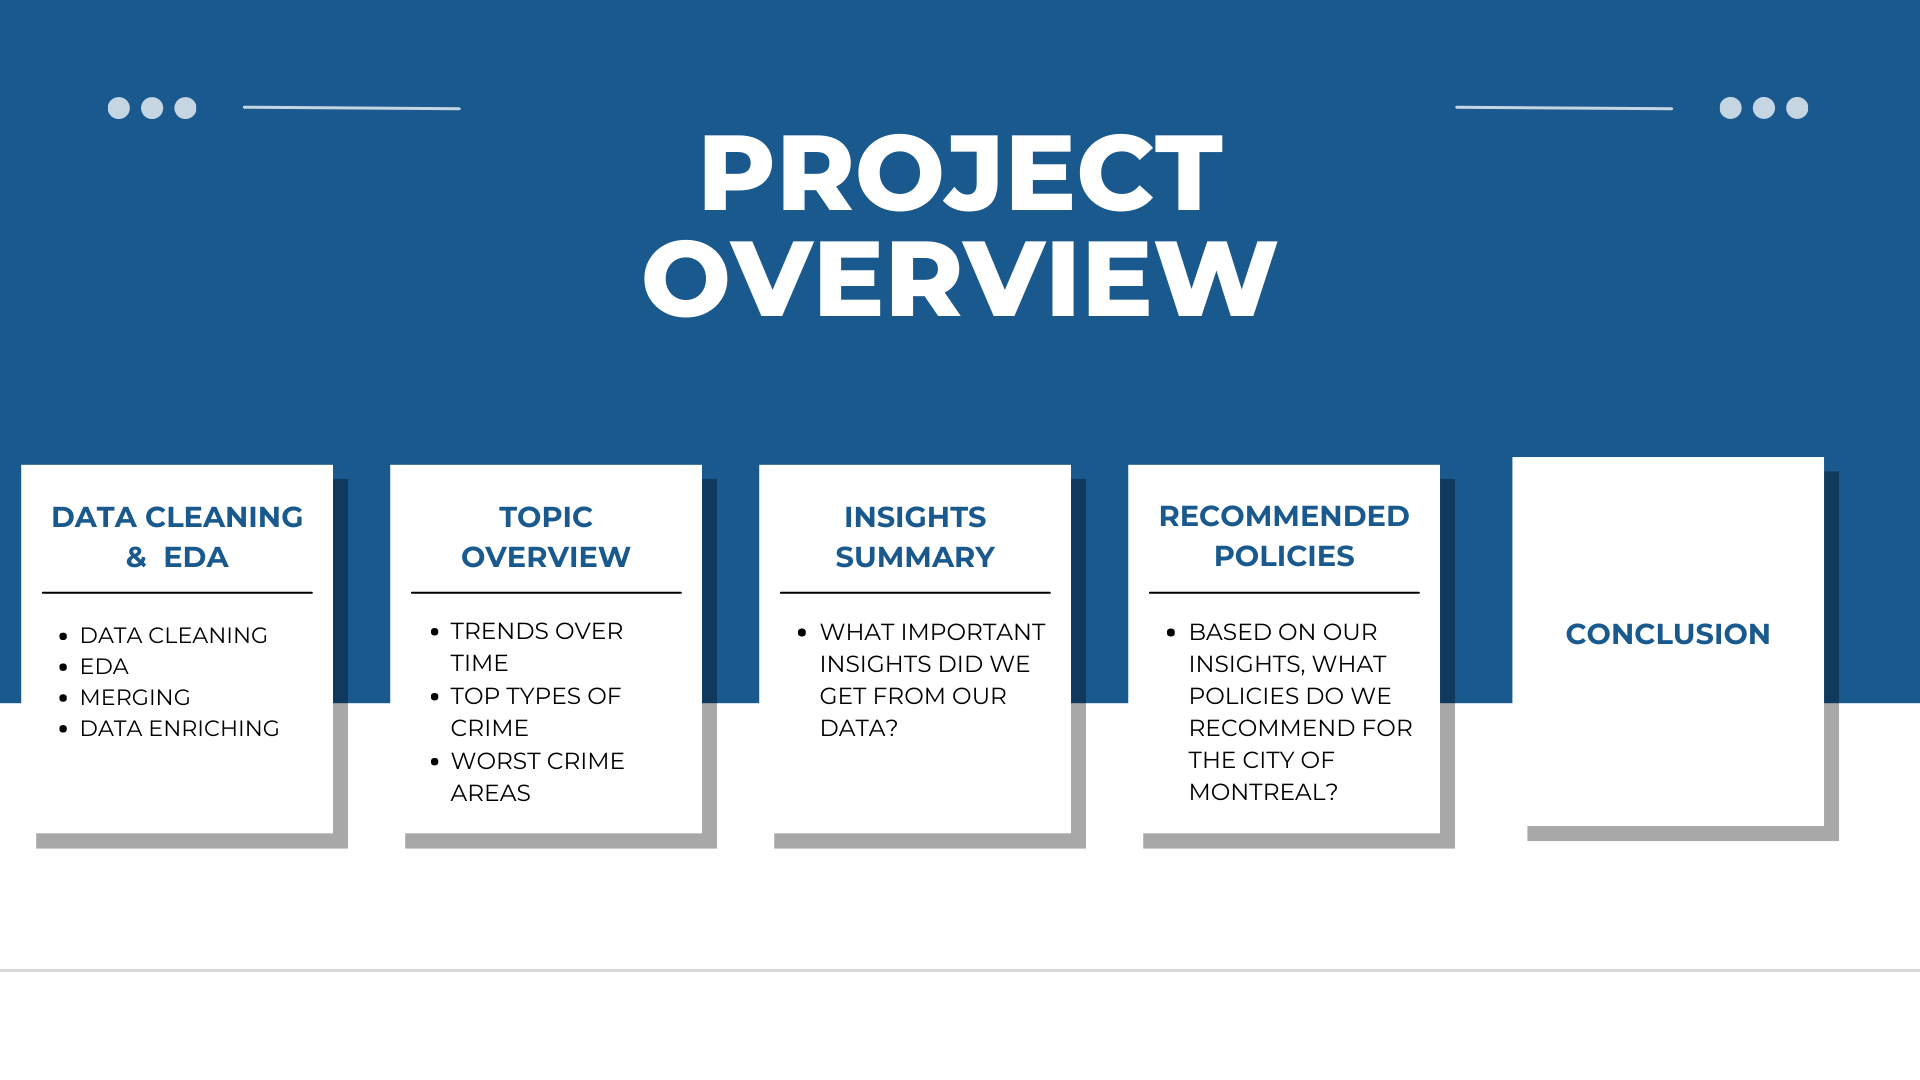
Presentation-3
-
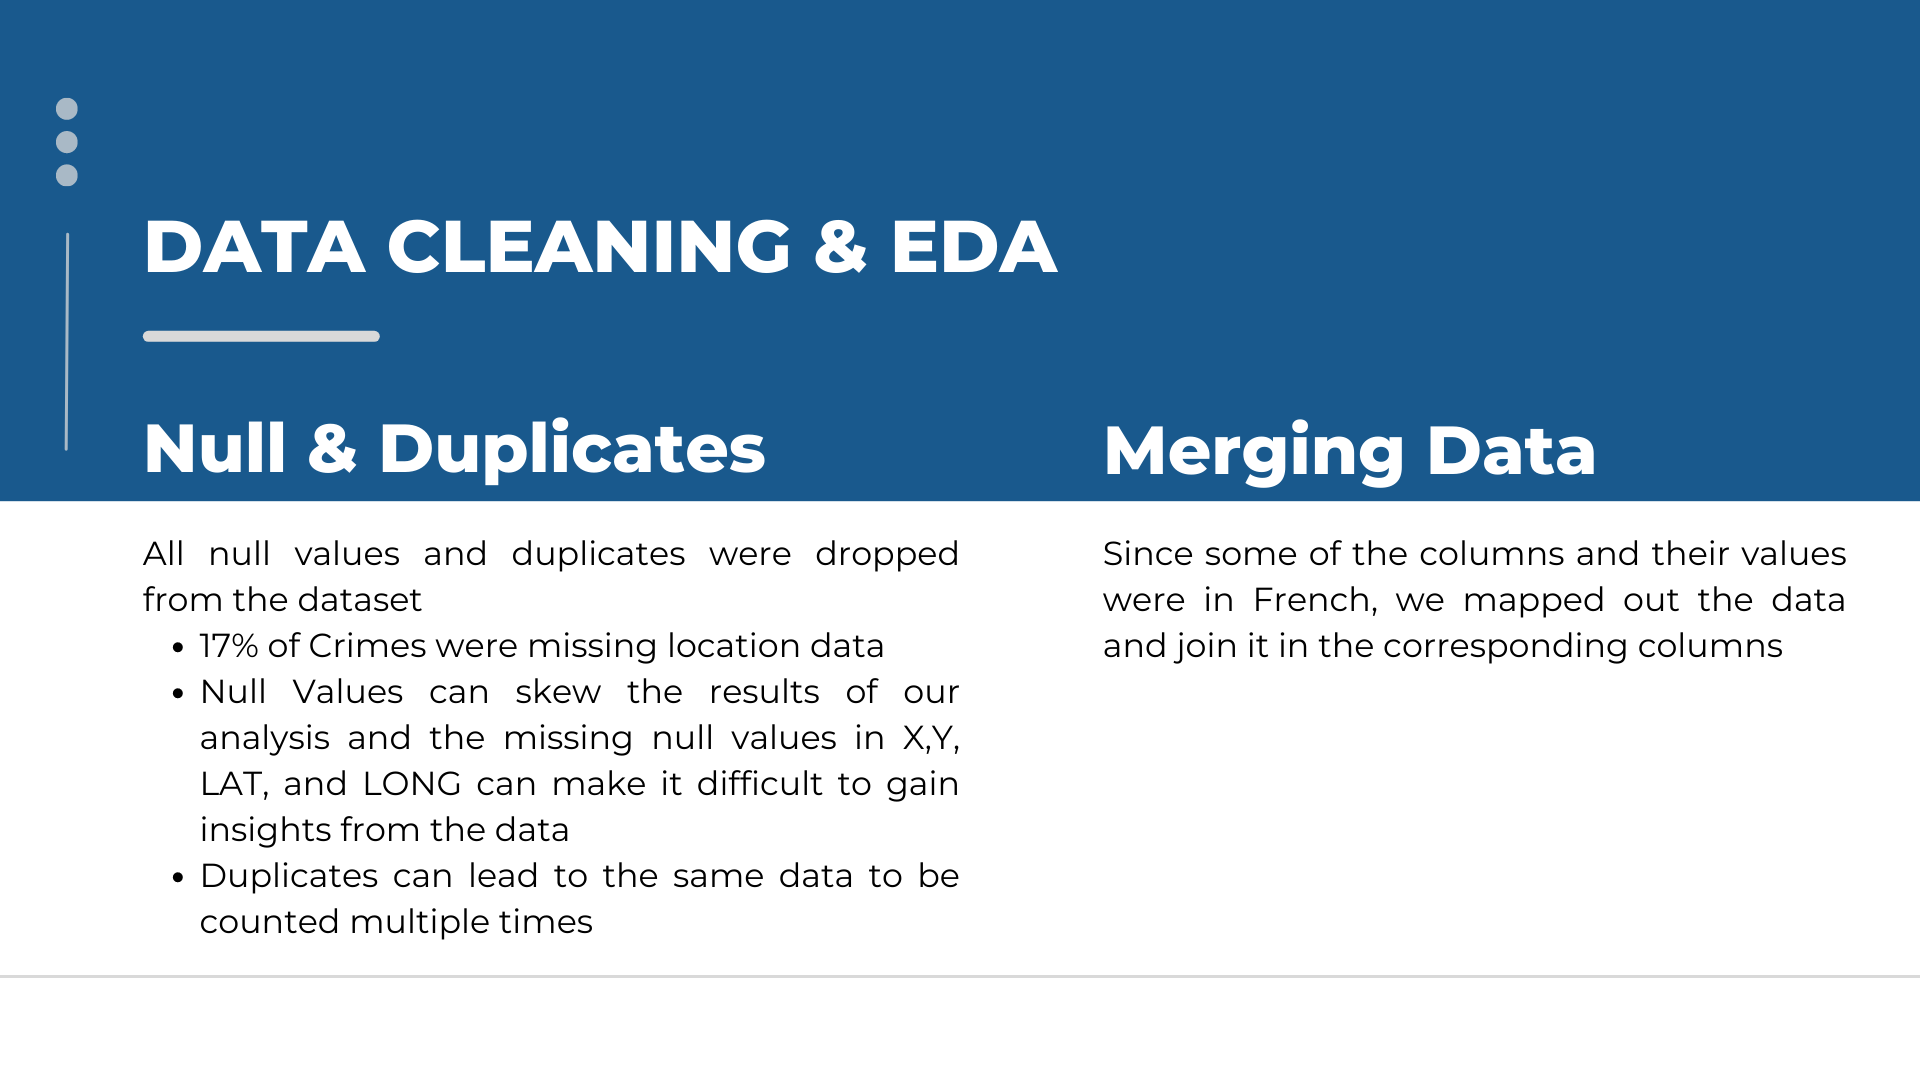
Presentation-4
-
Presentation-5
-
Presentation-6
-
Presentation-7
-
Presentation-8
-

Presentation-9
-
Presentation-10
-
Presentation-11
-

Presentation-12
-
Presentation-13


Inspiration
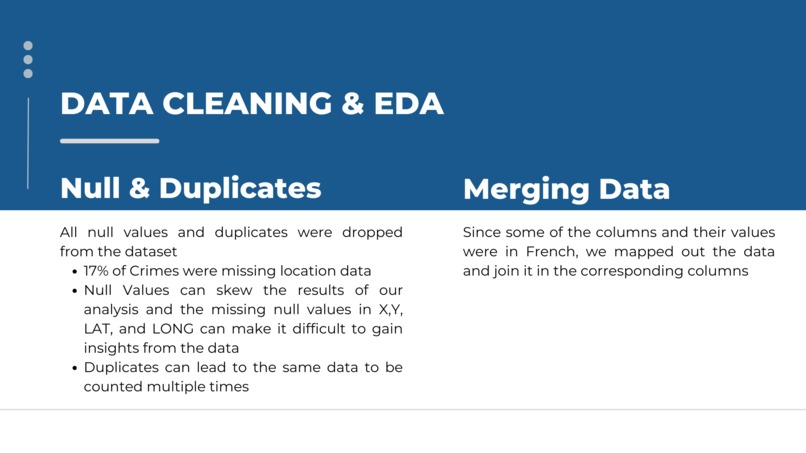
Our inspiration was to help Montreal’s law enforcement and government officials identify key trends, danger-areas within the city, as well as the effectiveness of policies
What it does
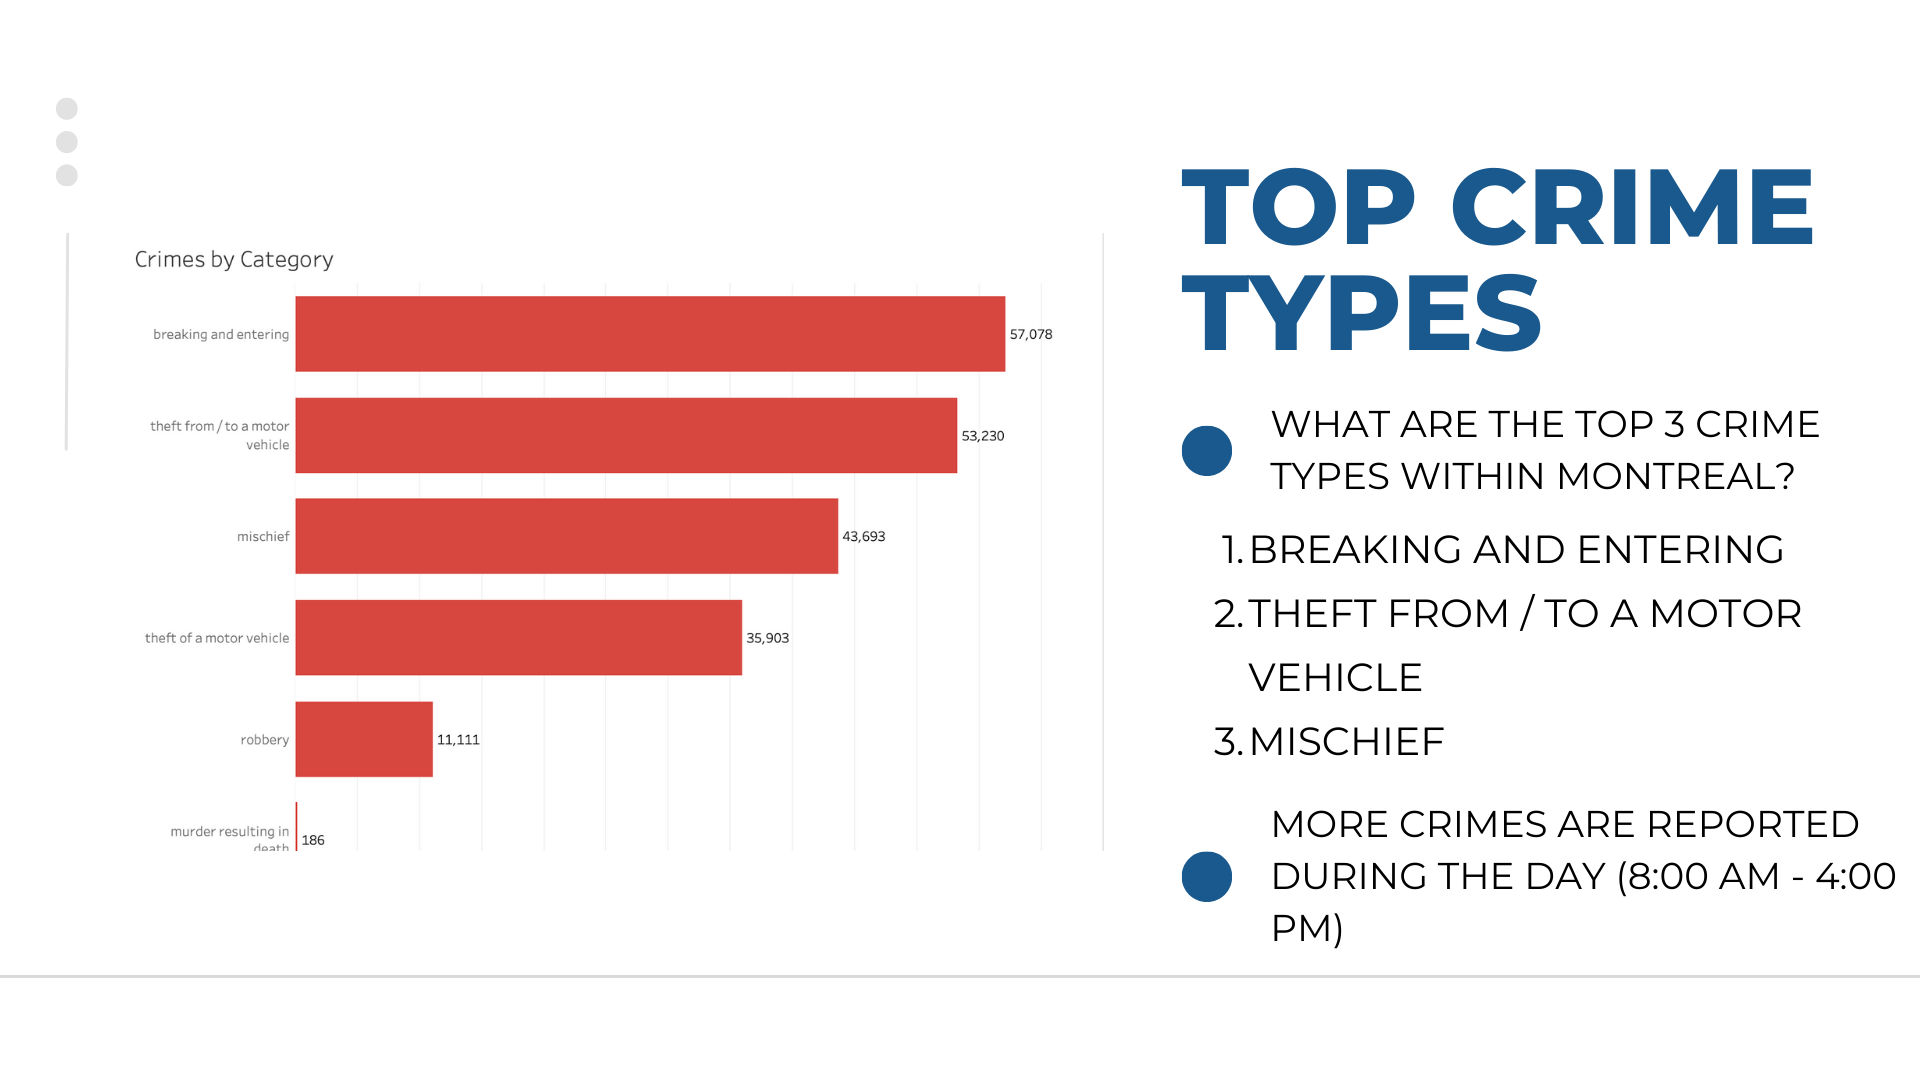
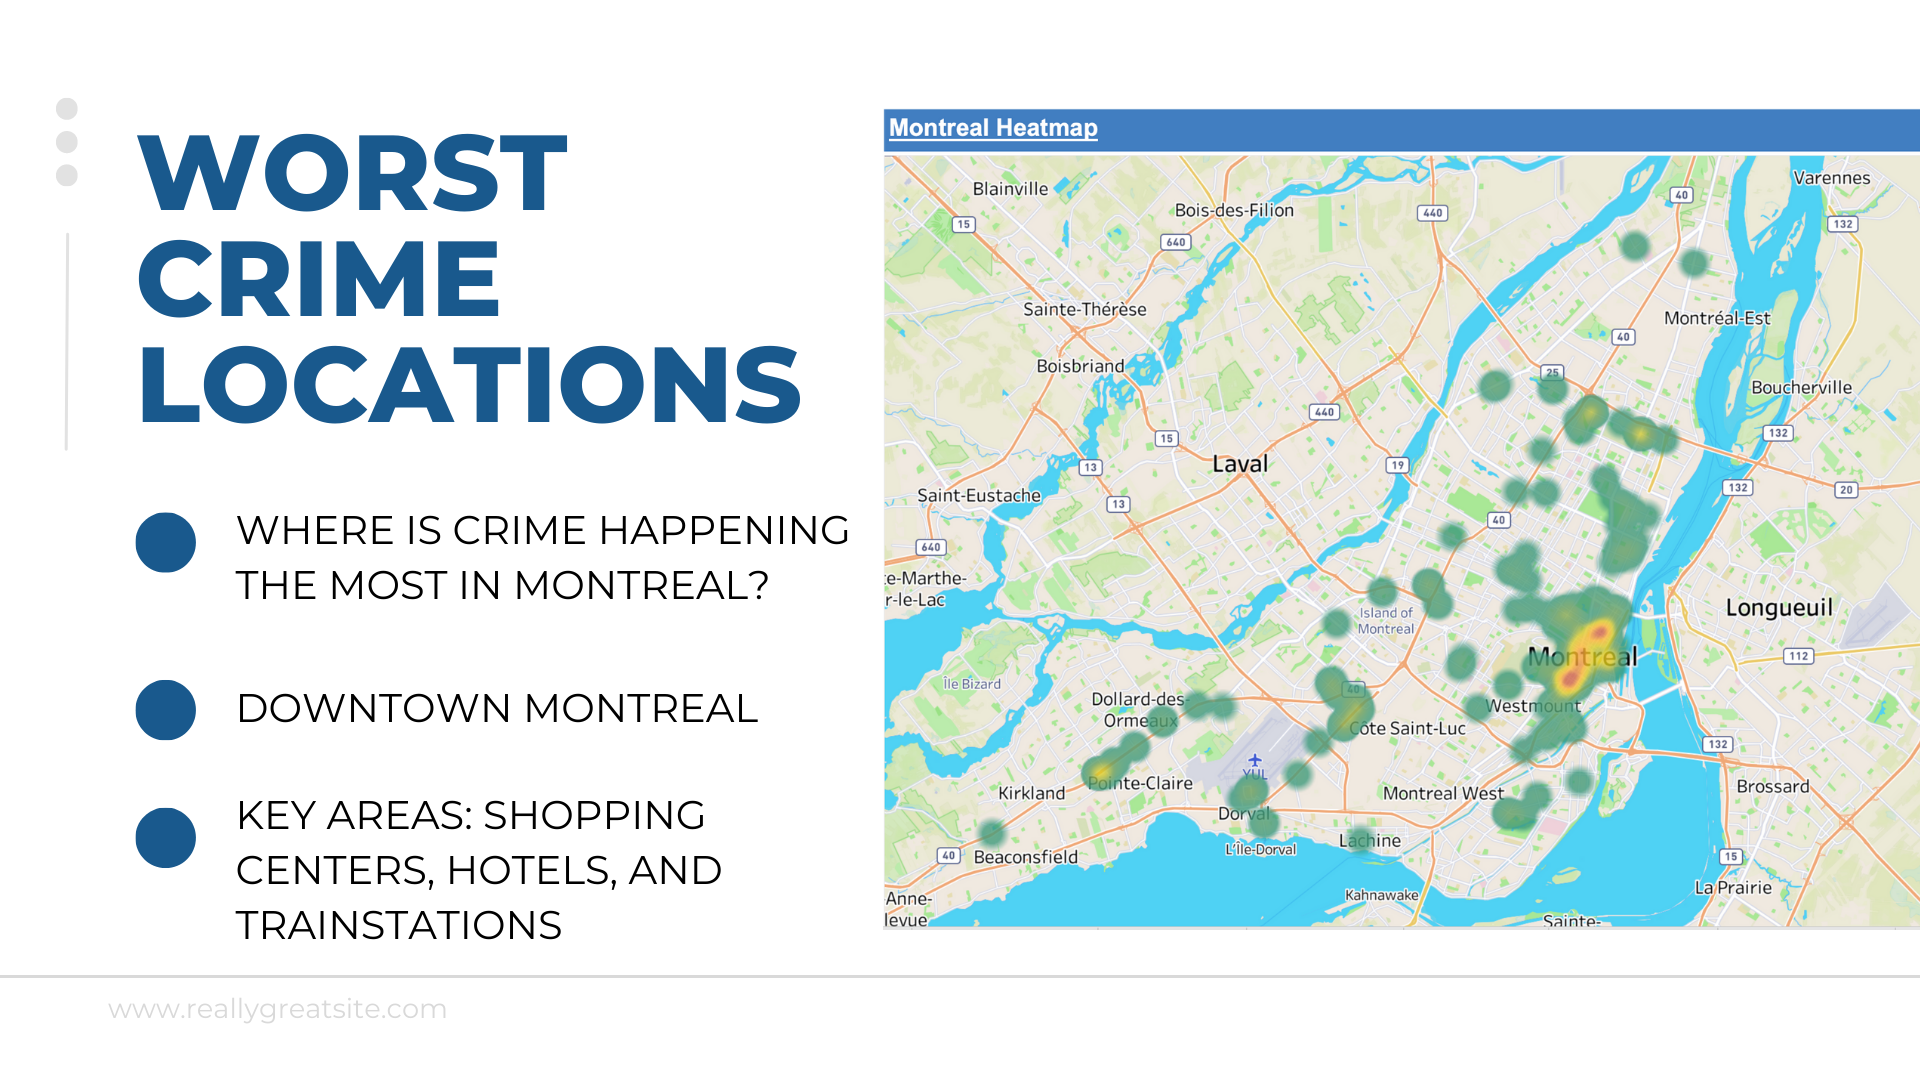
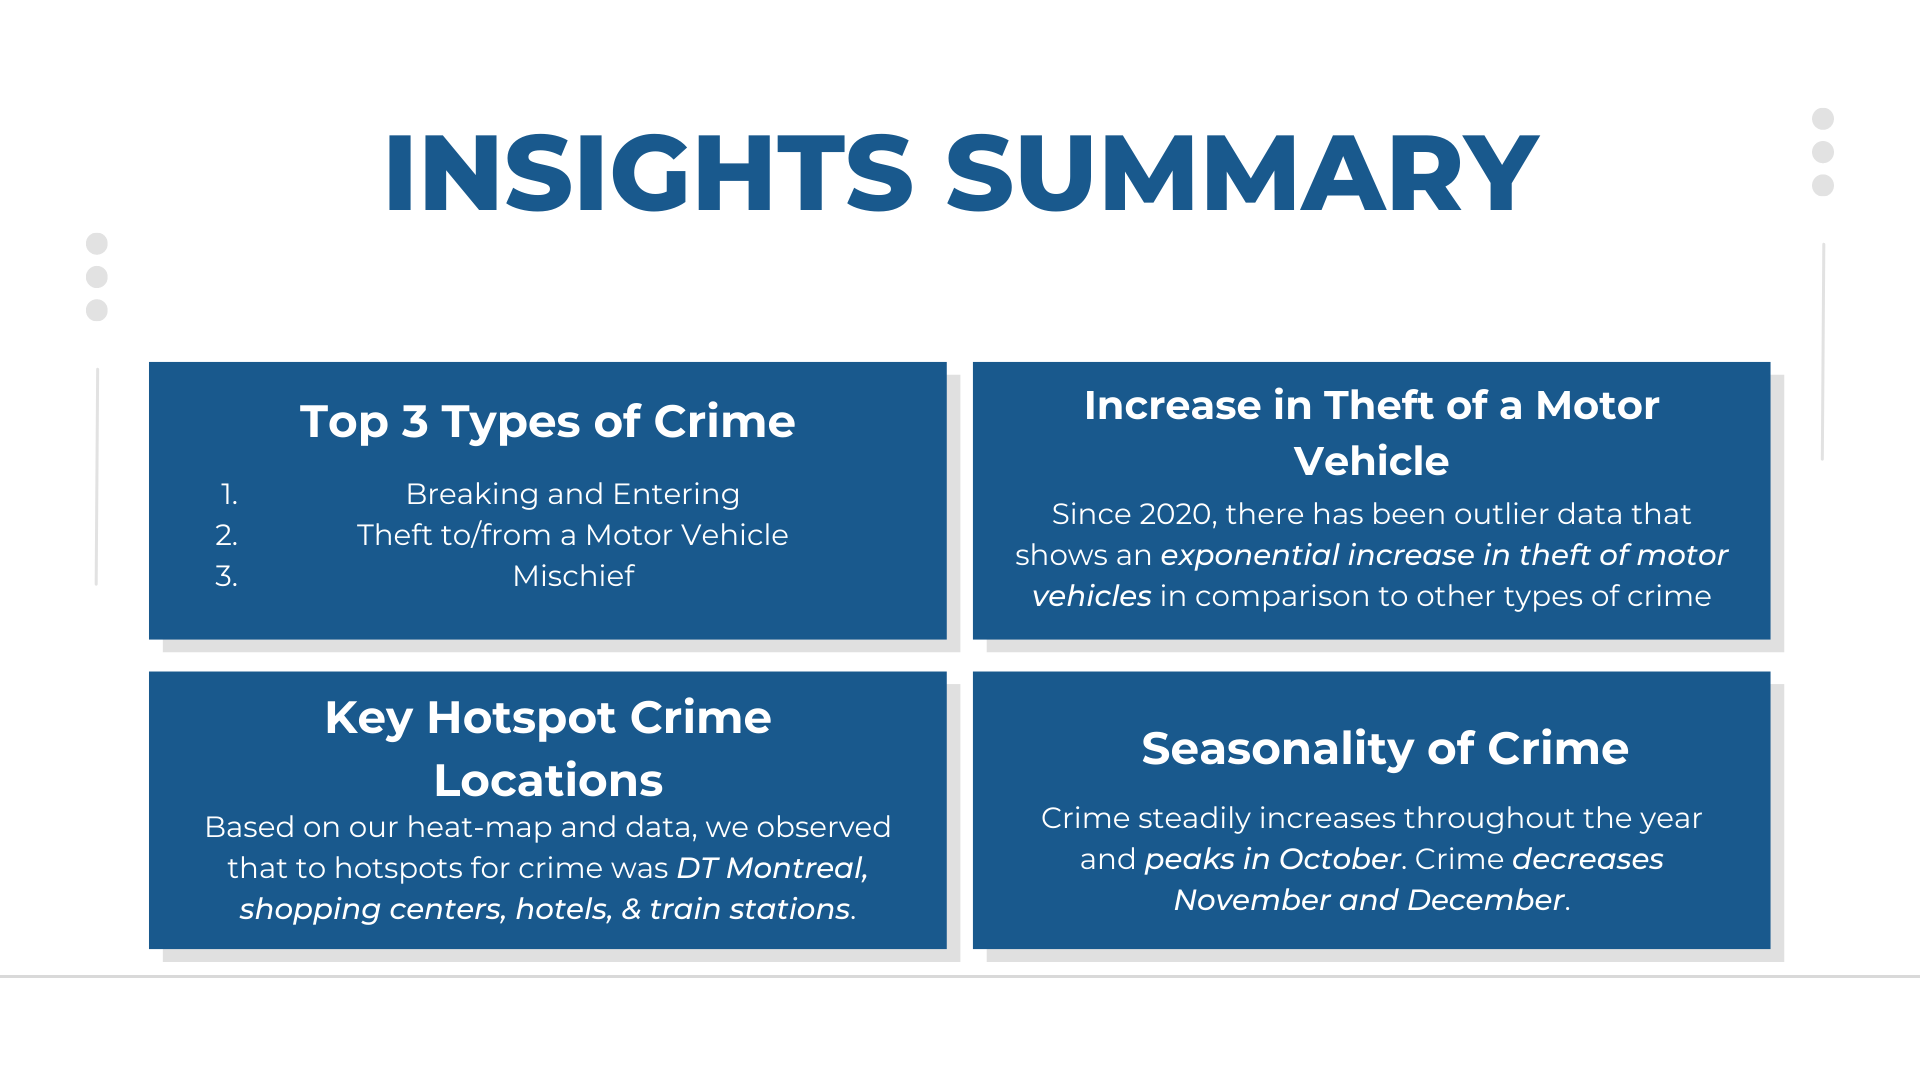
Our project visualizes key trends month over month, as well as identify hot spots of criminal activities within the city
How we built it
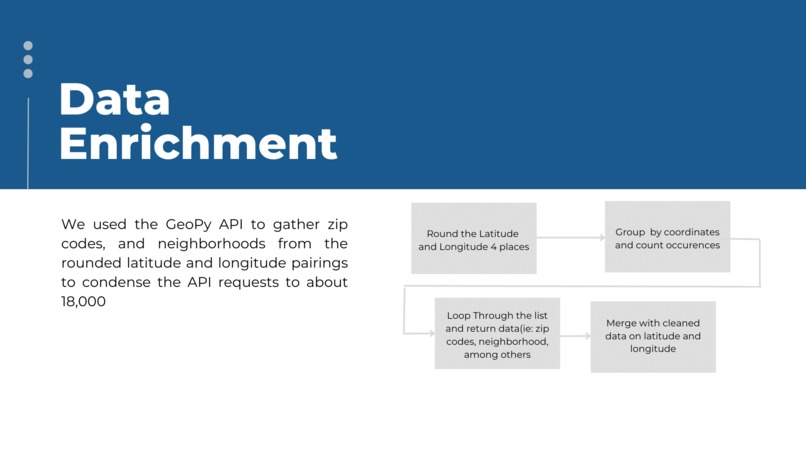
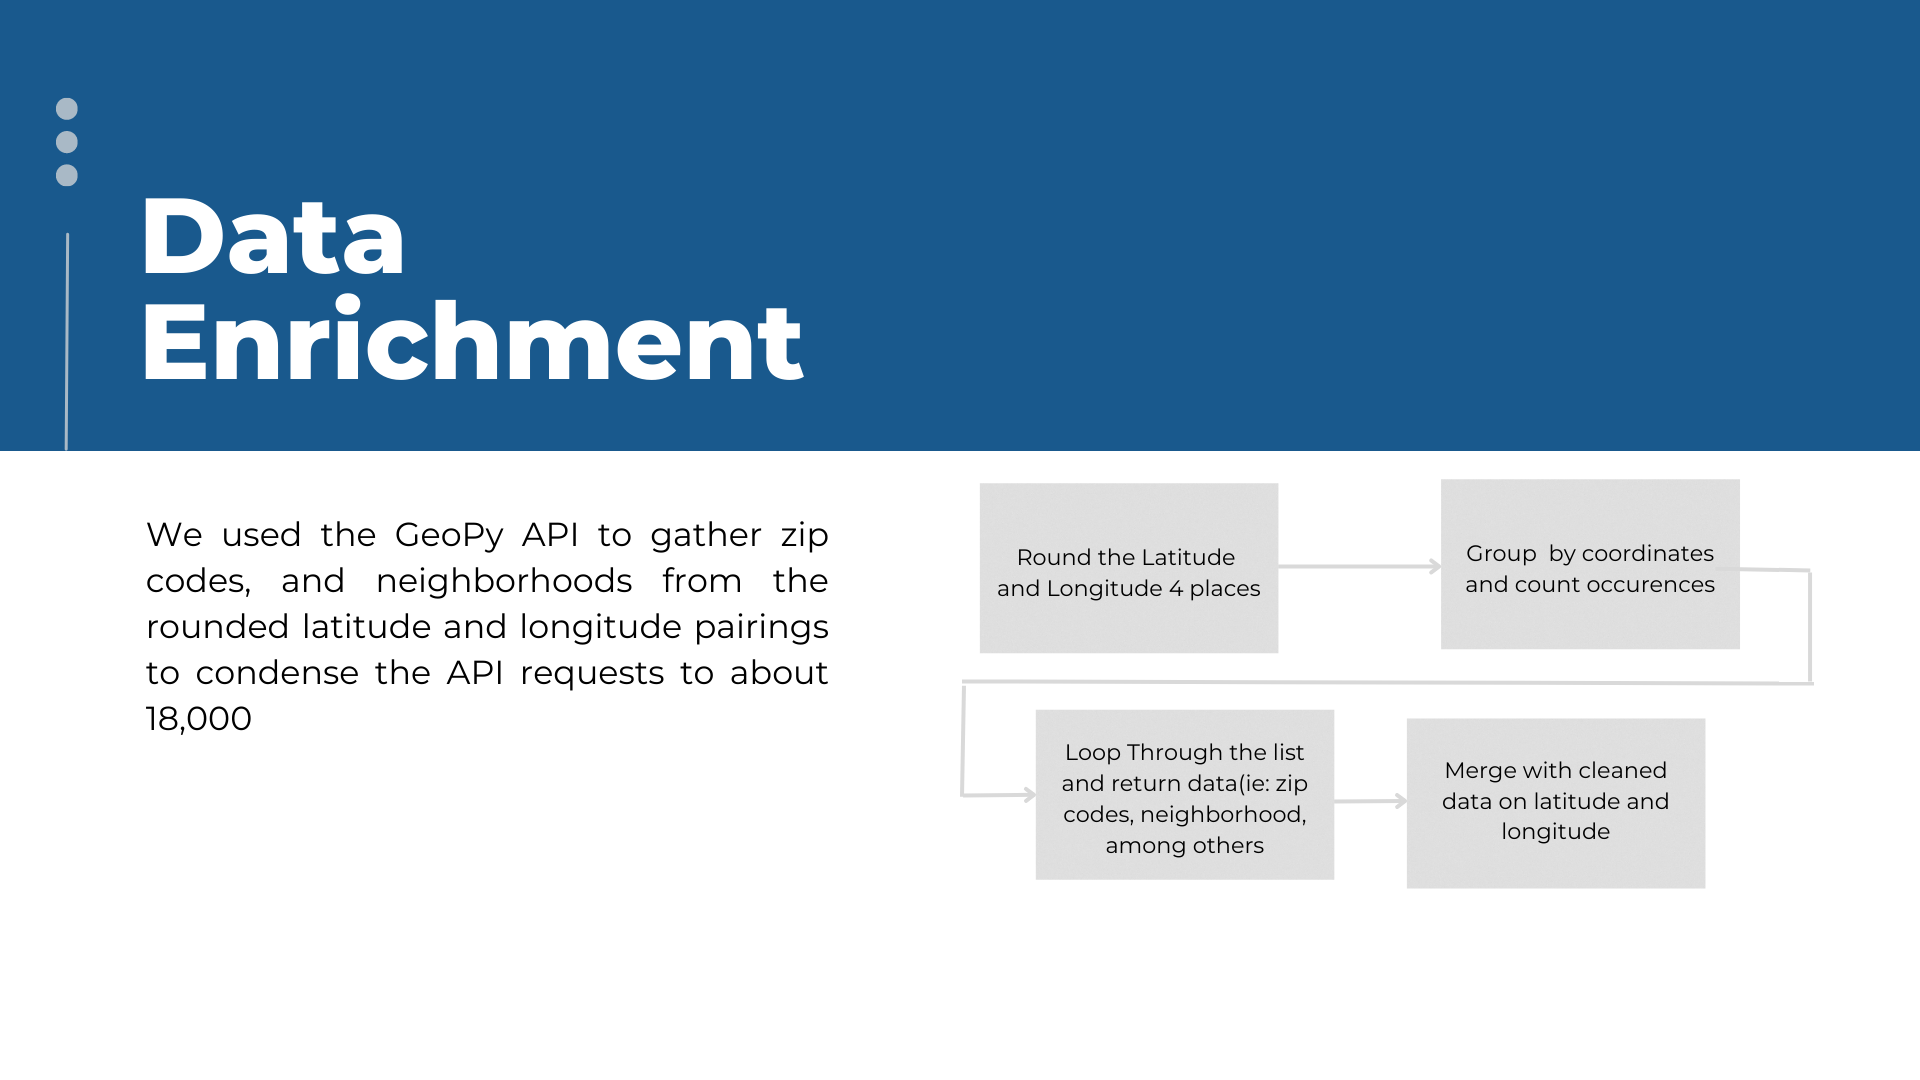
We created this project using Python by first cleaning the initial data provided by StrataScratch. We then gathered additional geographical information using GeoPy’s Nominatim library which included data including, but not limited to neighborhoods, suburbs, and postal code
Challenges we ran into
As this was our first datathon, cleaning a large amount of data was definitely a challenge, as well as coming up with ways to incorporate other data sources. Definitely the biggest challenge, however, was gathering unique coordinates, which was 18,000 rows, and performing reverse geocoding to gather additional information on the data, which took approximately 3 hours due to the speed in which GeoPy returned the data, and we were unable to incorporate time to gather additional resources
Accomplishments that we're proud of
We are proud of actually performing exploratory data analysis using Tableau and getting the data overall from the API
What we learned
We learned about the struggles of working with unclean data and applying solutions to real-world problems. A hard lesson that we learned was the horrors of API usage and rate limiting when working on a project within such a short amount of time
What's next for Beach Consulting Montreal Crime Analysis
Since GeoPy was the only outside source we used, moving forward we can look for socioeconomic data that can complement our findings


Log in or sign up for Devpost to join the conversation.