Inspiration
We're three Joint Maths and Computing students at Imperial who are into markets. Every systematic trader eventually faces the same question: your strategy has lost money for six weeks. Is it broken, or is this just a bad run?
Kill it too early and you throw away a strategy that still works. Kill it too late and you keep paying for one that
stopped working months ago. Most solo traders answer this with gut feel or a fixed stop-loss. Both ignore that the two
mistakes cost different amounts. We wanted a tool that puts numbers on both.
What it does
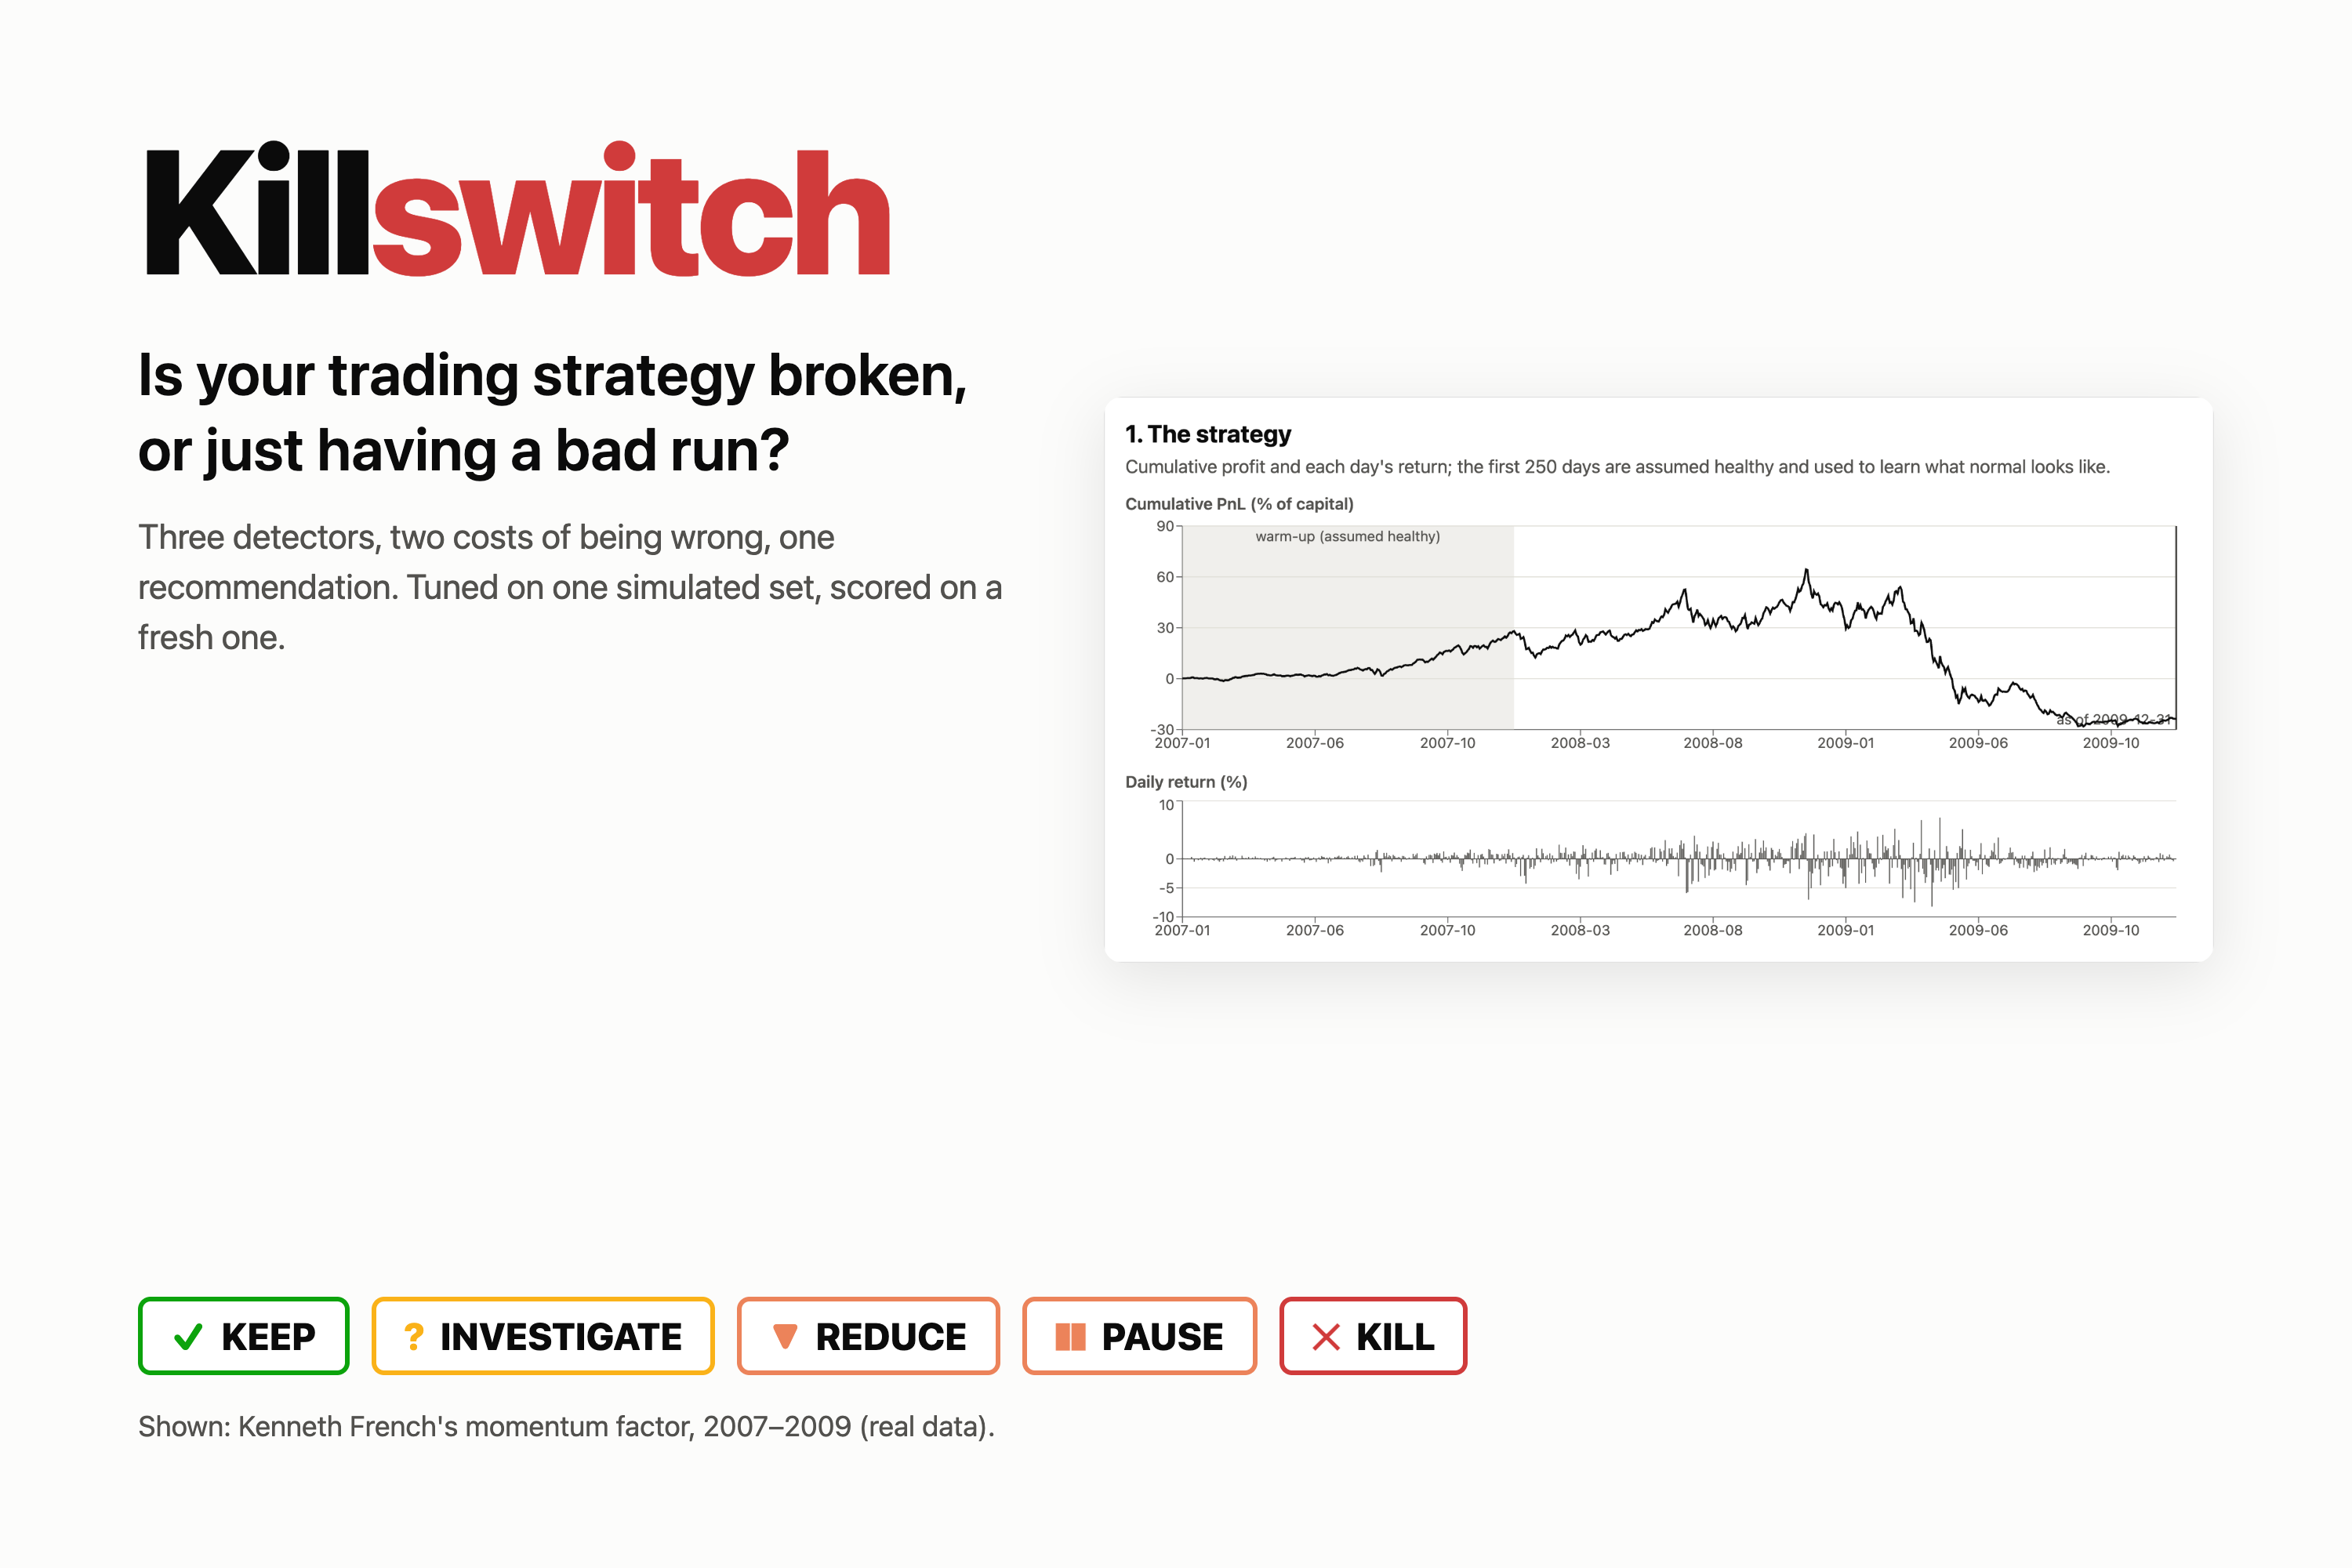
Killswitch reads a strategy's daily returns and recommends keep, investigate, reduce, pause or kill.
- It learns what "normal" looks like from the first 250 days, which are assumed healthy.
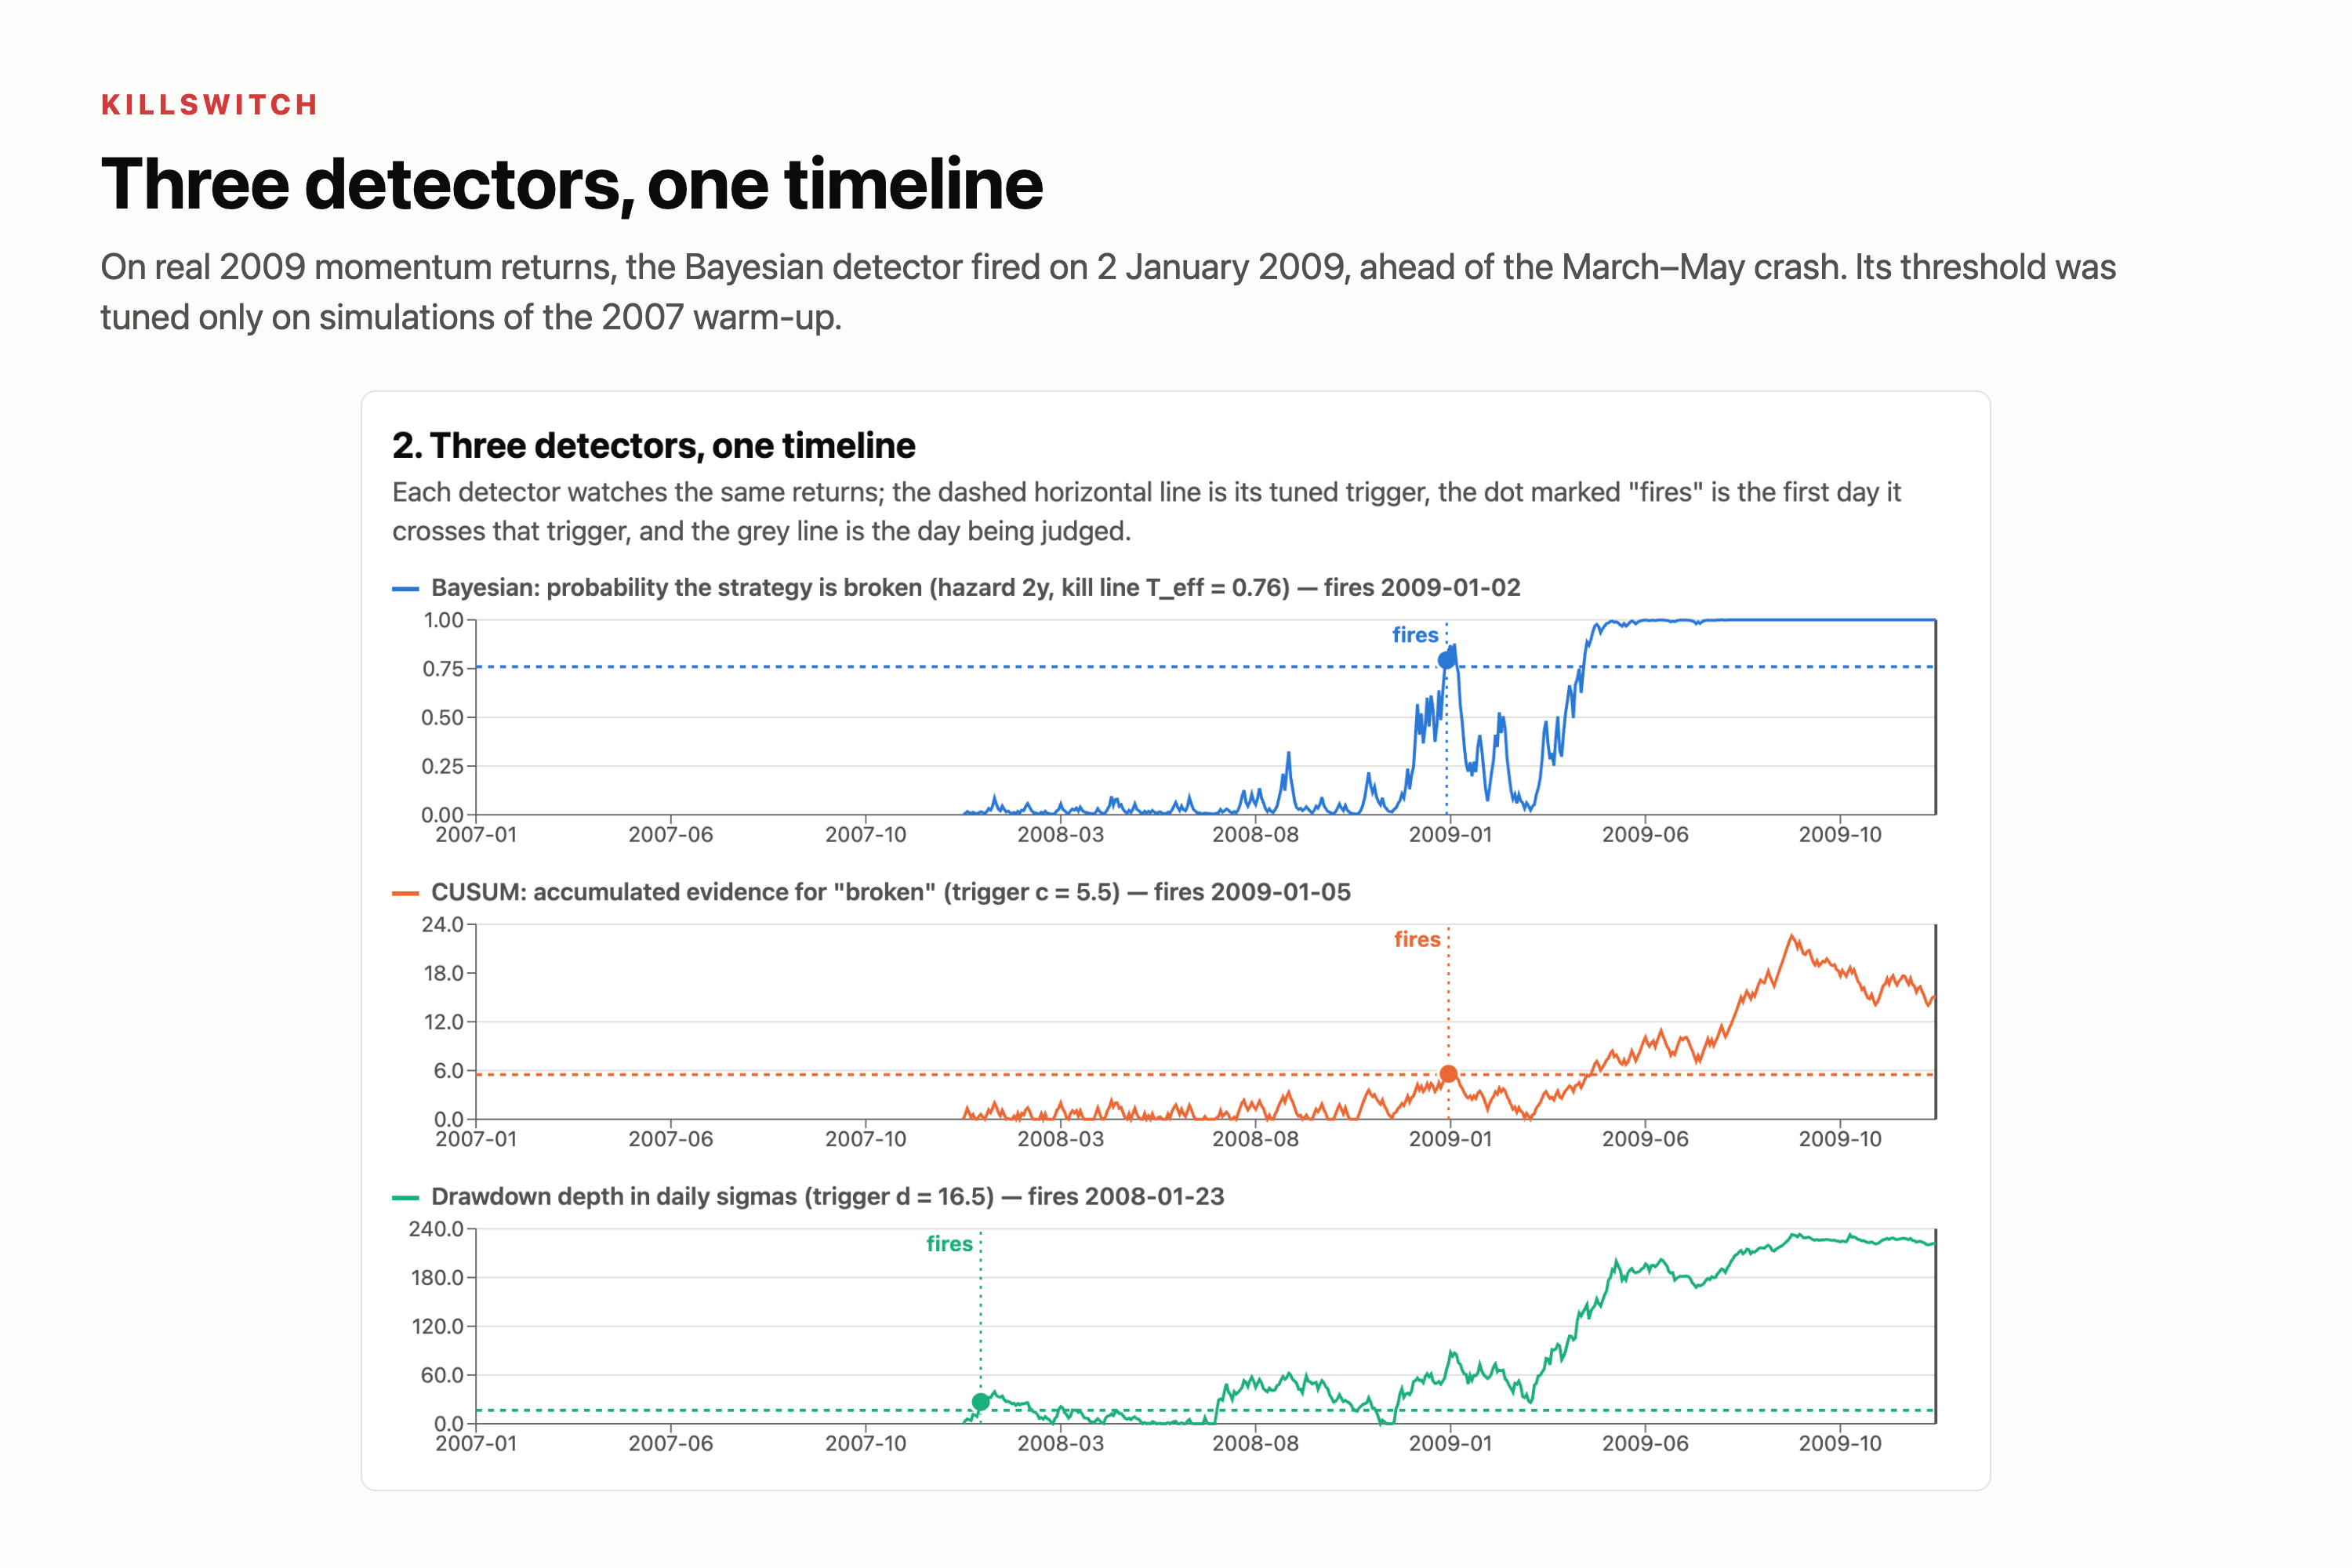
- Three detectors then watch the rest: a Bayesian break detector, CUSUM, and drawdown depth.
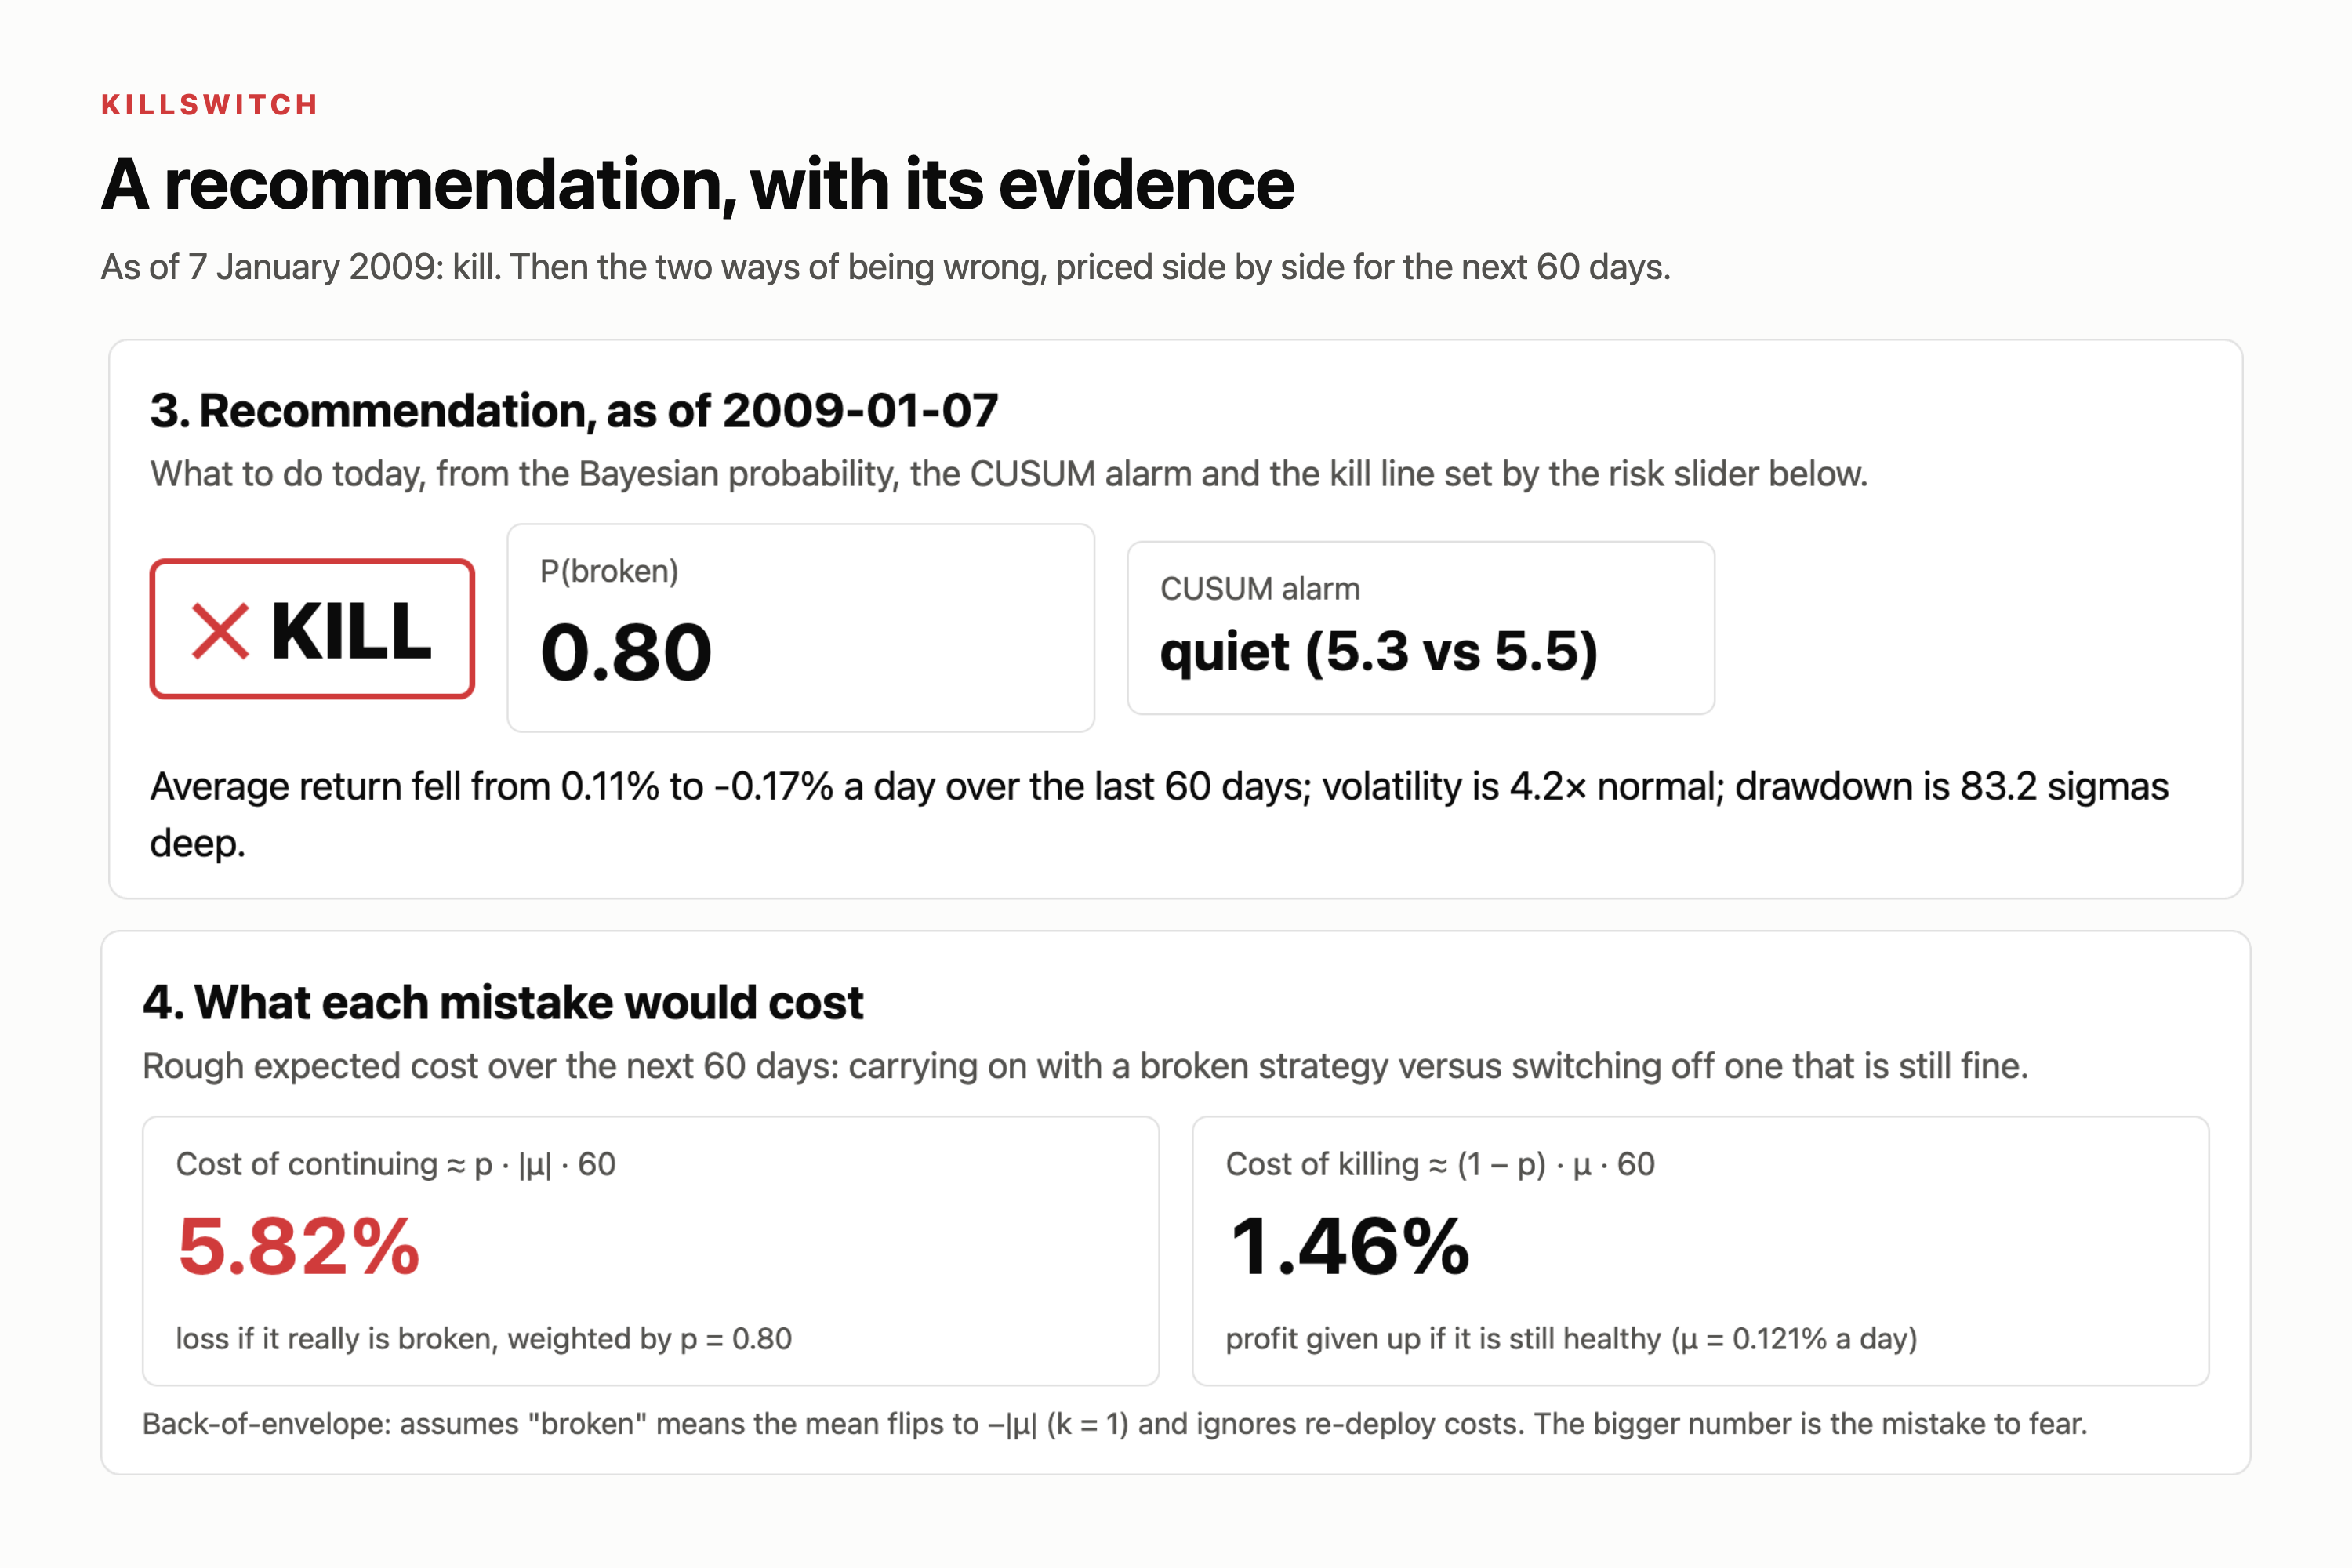
- A cost card compares the two ways of being wrong over the next 60 days. Continuing costs about \(p \cdot |\mu| \cdot
60\) if the strategy is broken; killing costs about \((1-p) \cdot \mu \cdot 60\) if it is still healthy.
- A risk slider moves the kill line, and every panel updates live.
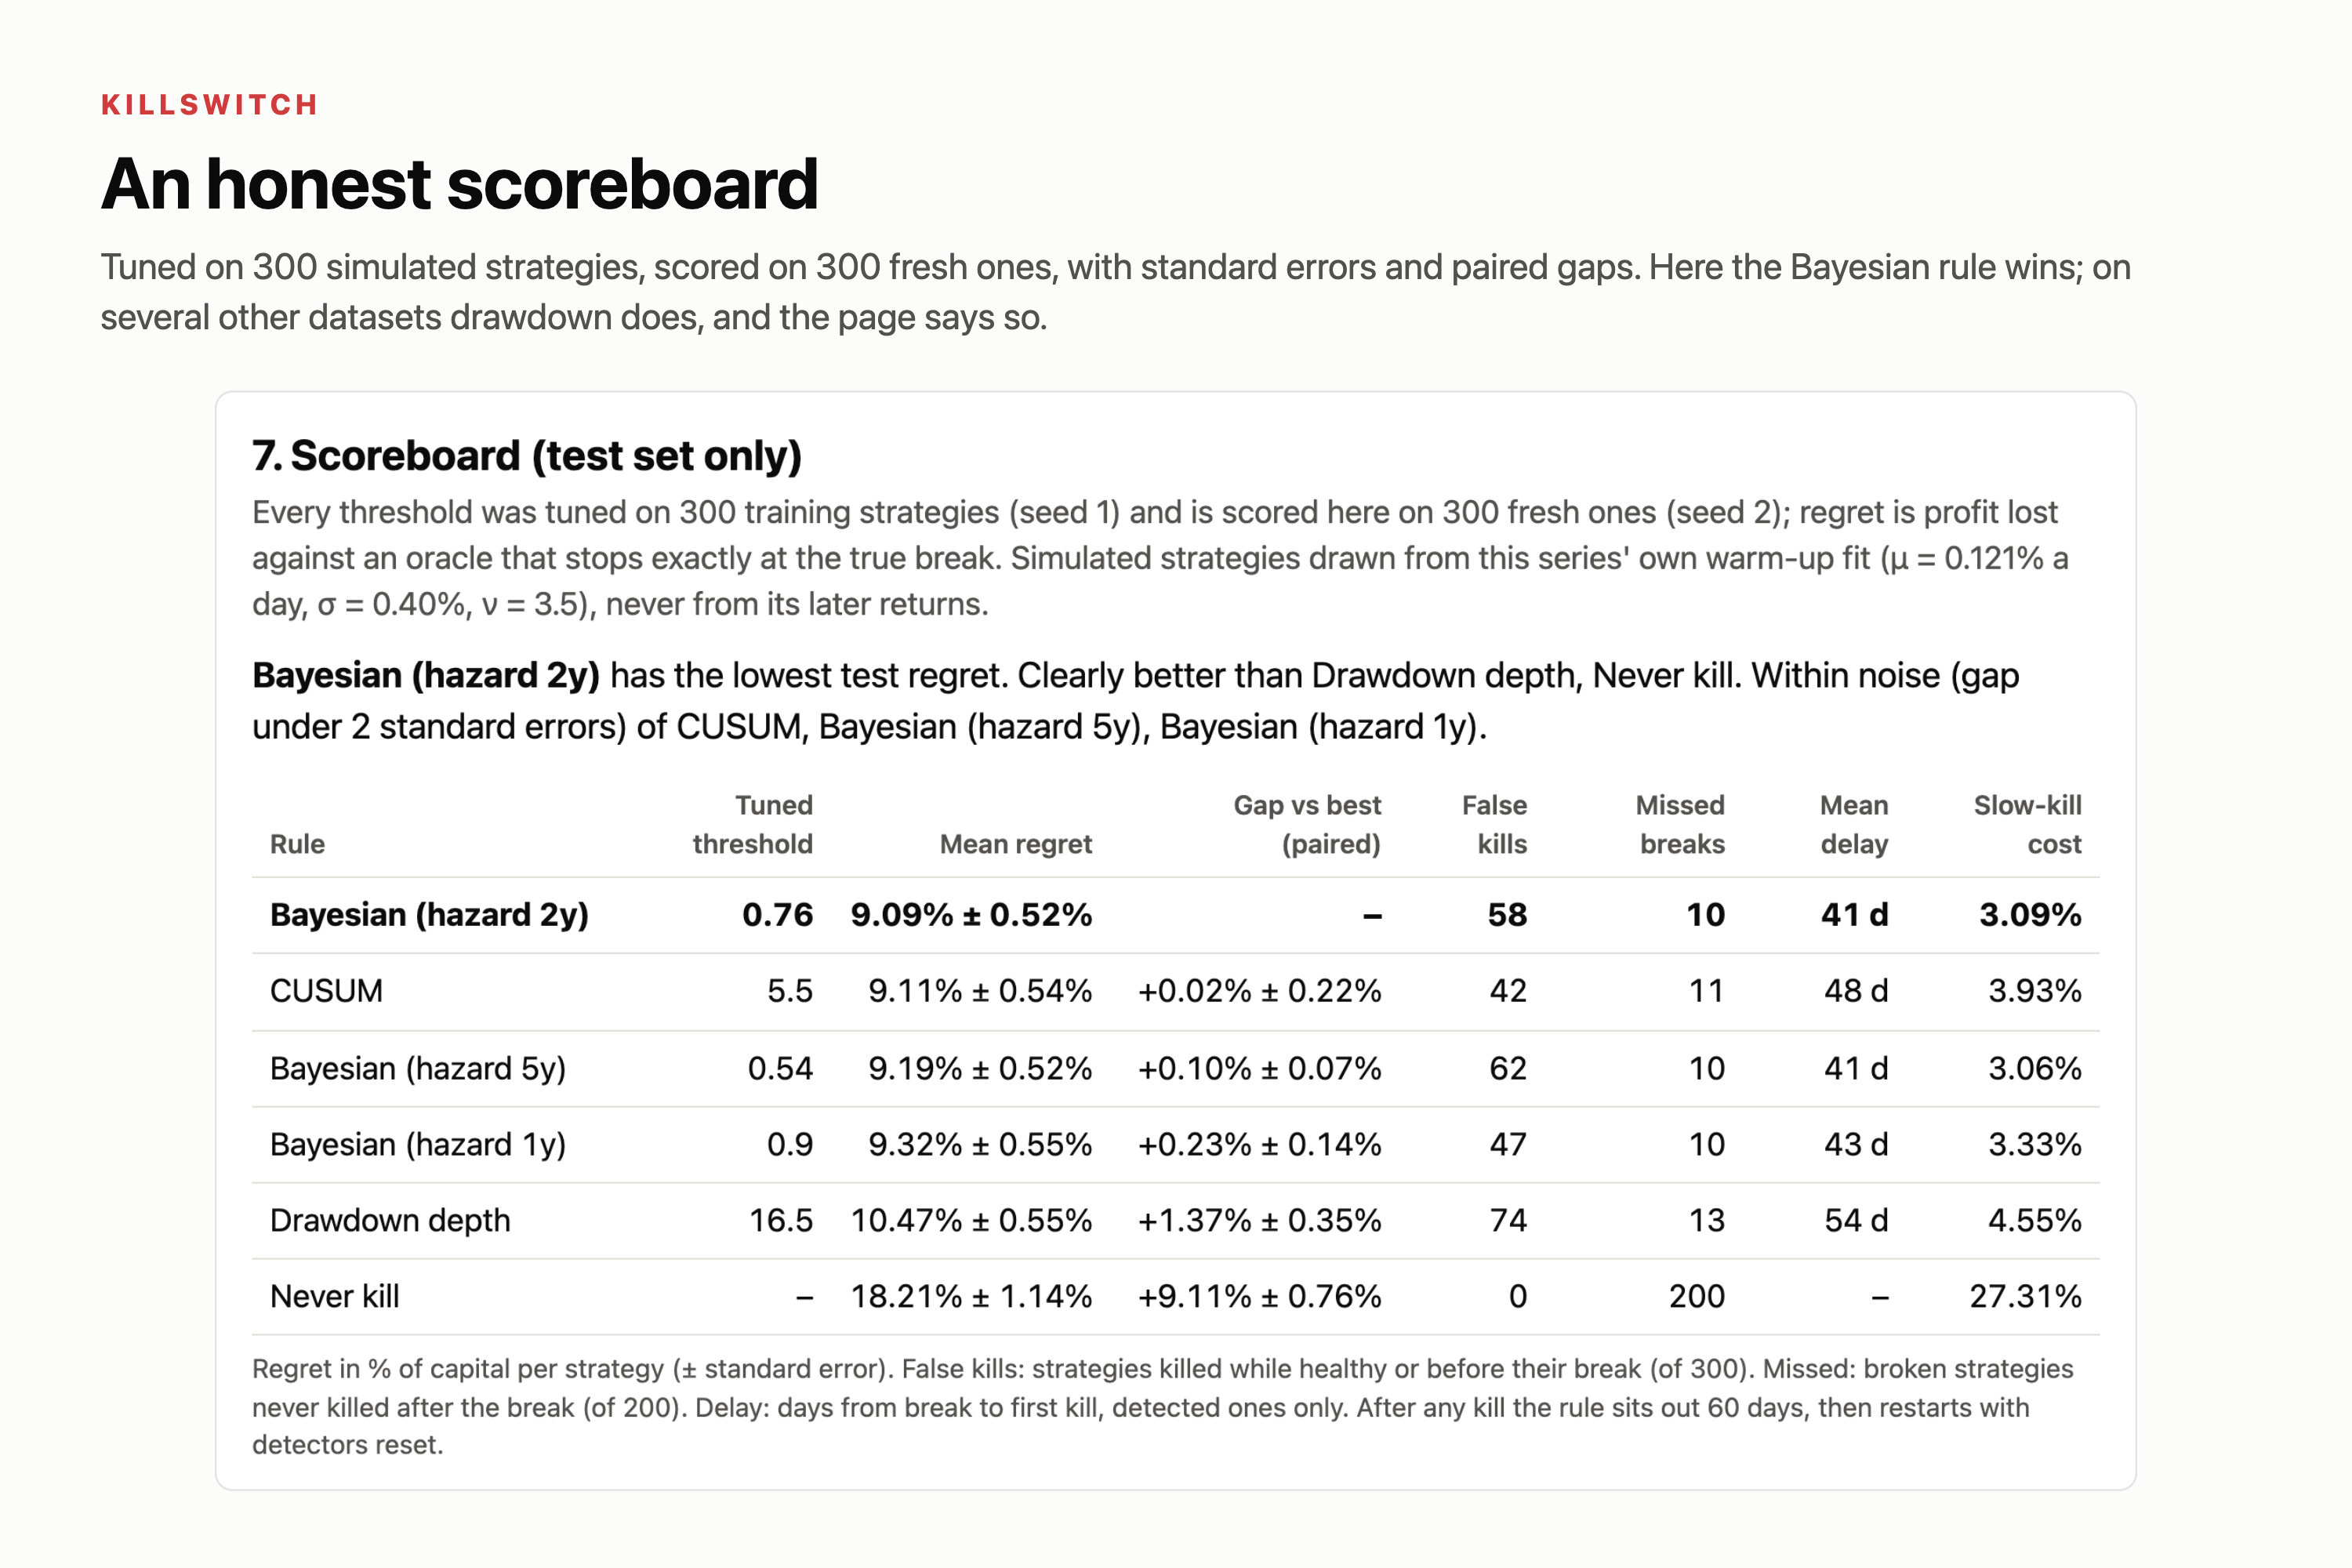
- A scoreboard shows how each detector would have performed on strategies it never saw during tuning.
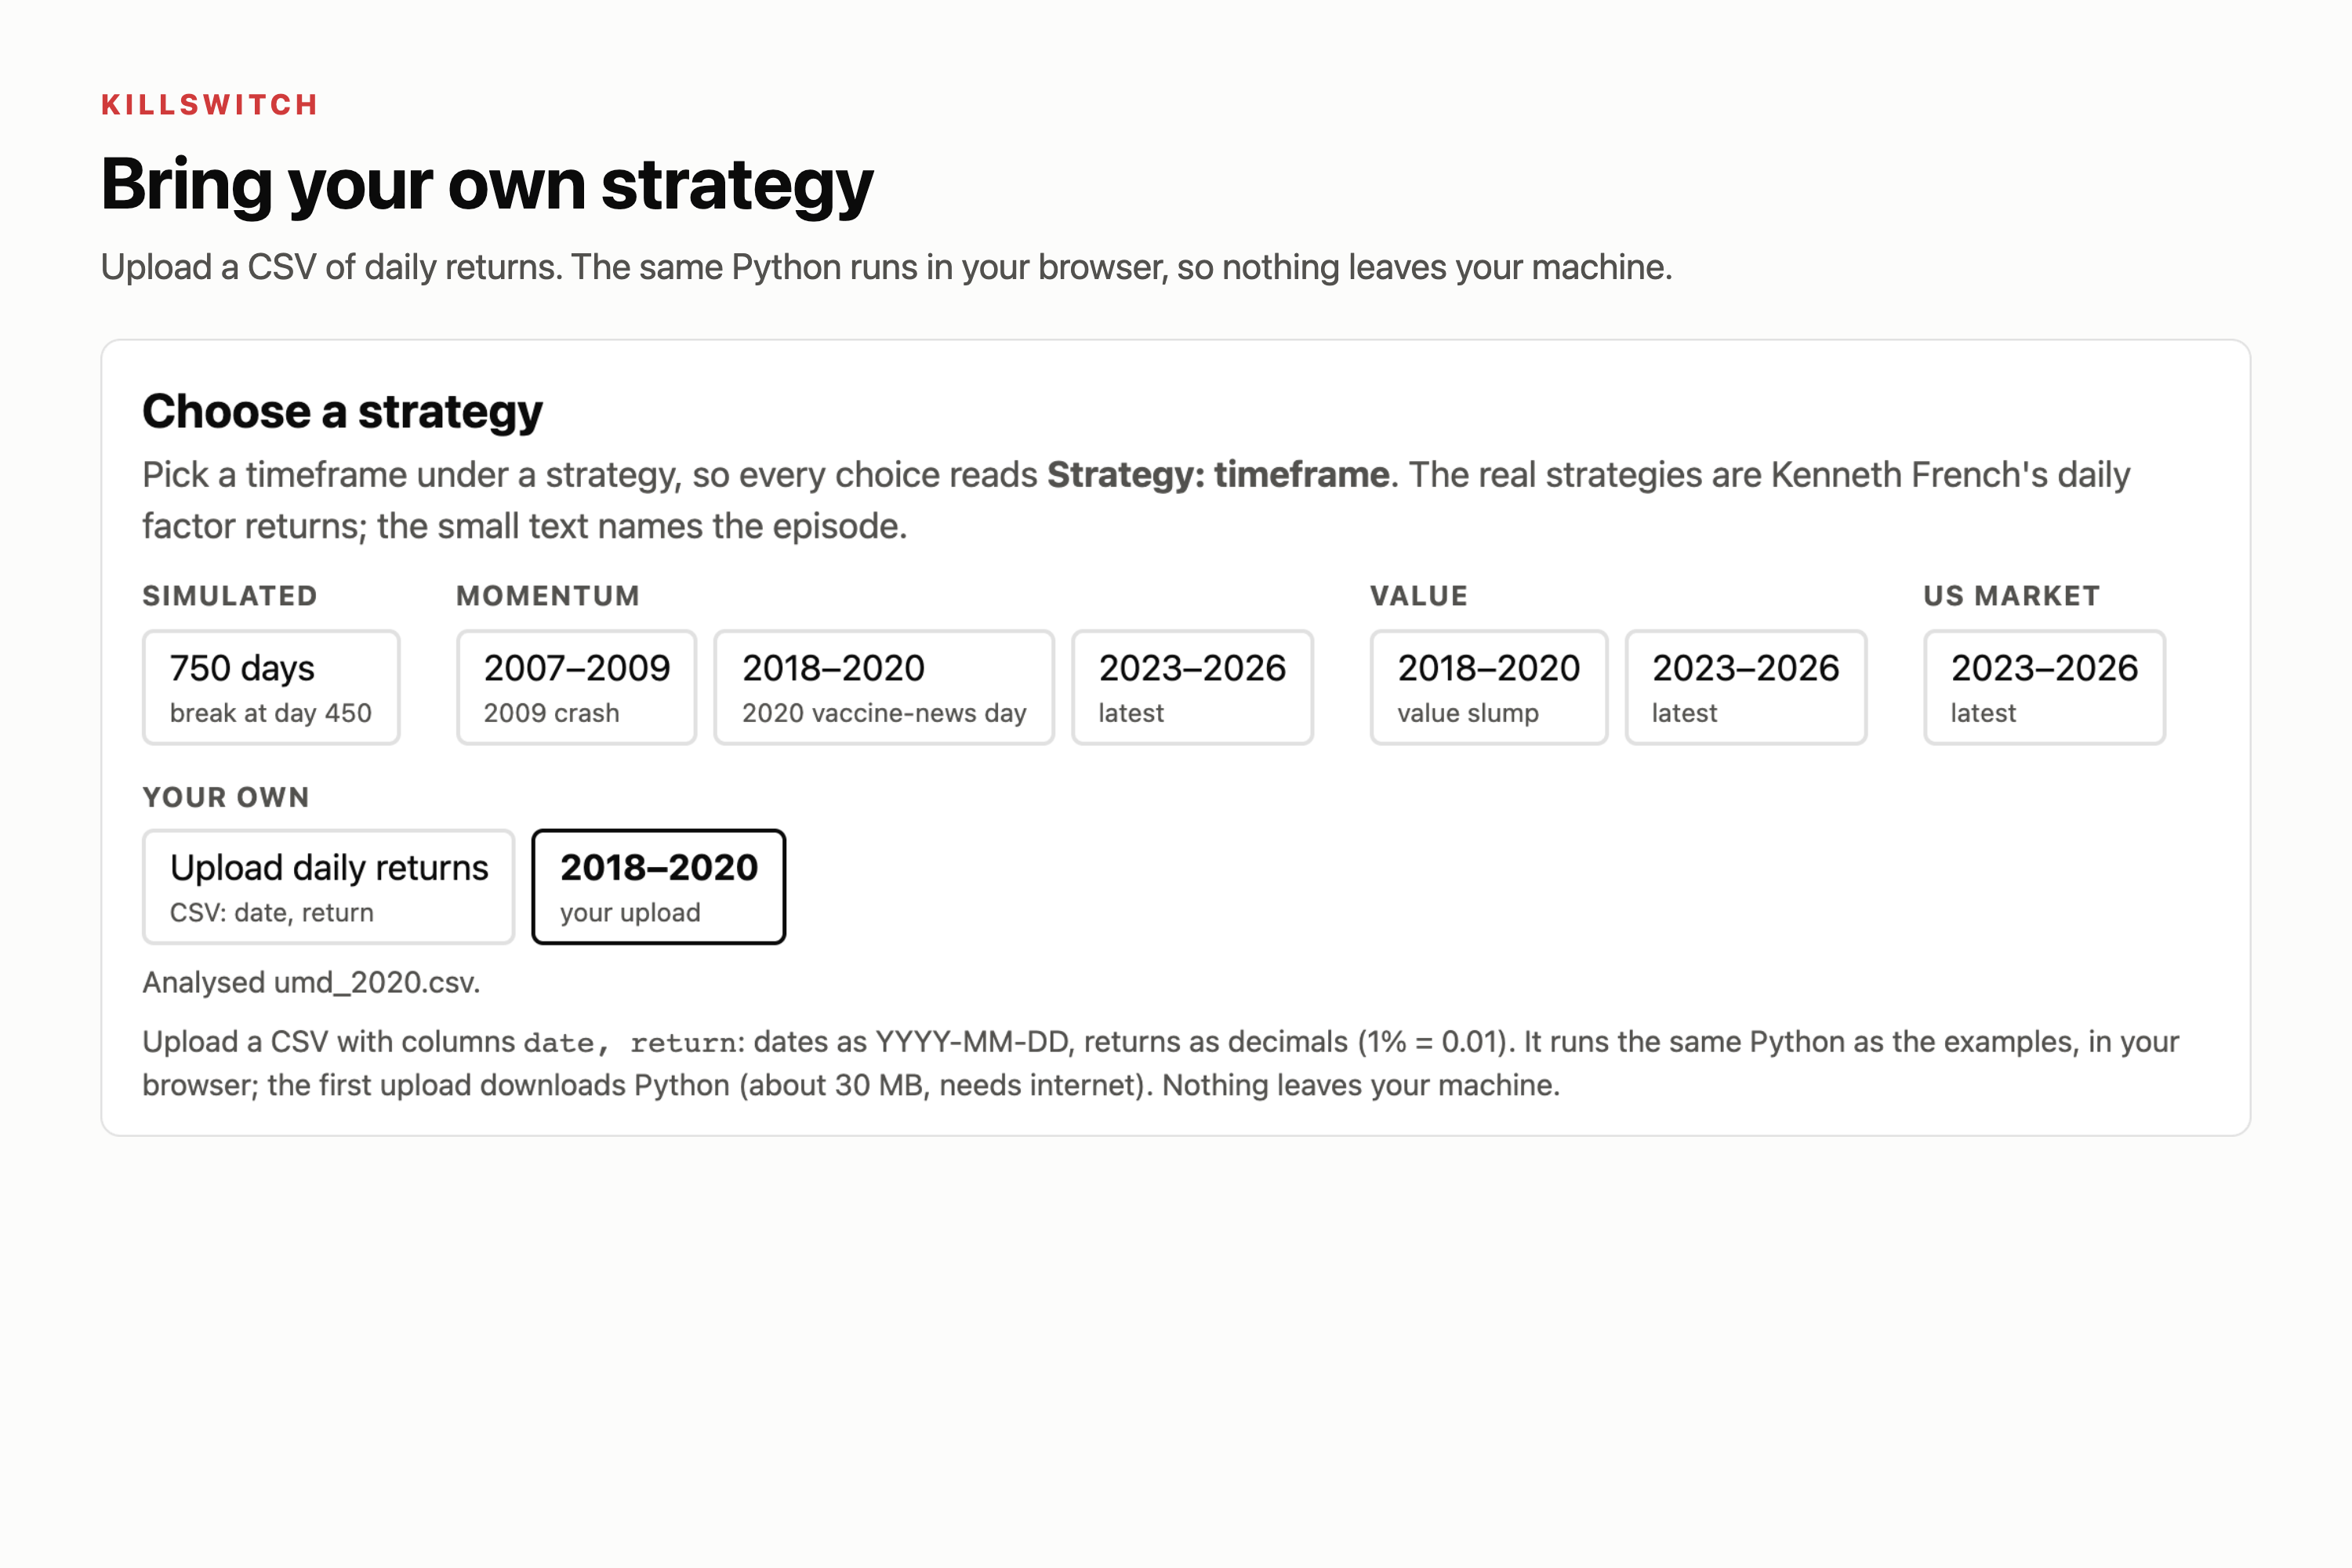
You can try it on:
- a simulated strategy;
- six real Kenneth French factor series, including momentum's 2009 crash, its November 2020 vaccine-news day, value's
2018–2020 slump, and the latest three years of momentum, value and the US market; - your own CSV of daily returns. It is analysed entirely in your browser, and the file never leaves your machine.
How we built it
The maths (Python, numpy, scipy, pytest). We fit a Student-t distribution to the warm-up period, since fat tails
matter in finance. A "broken" strategy keeps the same volatility but its mean flips sign. Each day, the Bayesian detector
updates the probability that the strategy has broken, \(p_t\), using a break hazard \(h = 1/(252 \cdot
\text{years})\):
$$
p_t^{\text{prior}} = p_{t-1} + (1 - p_{t-1}) h, \qquad
p_t = \frac{p_t^{\text{prior}} L_t}{p_t^{\text{prior}} L_t + 1 - p_t^{\text{prior}}}, \qquad
L_t = \frac{f_{\text{broken}}(r_t)}{f_{\text{healthy}}(r_t)}
$$
CUSUM accumulates the same evidence, \(S_t = \max(0, S_{t-1} + \log L_t)\). Drawdown depth measures how far below its peak the strategy is, in units of daily volatility.
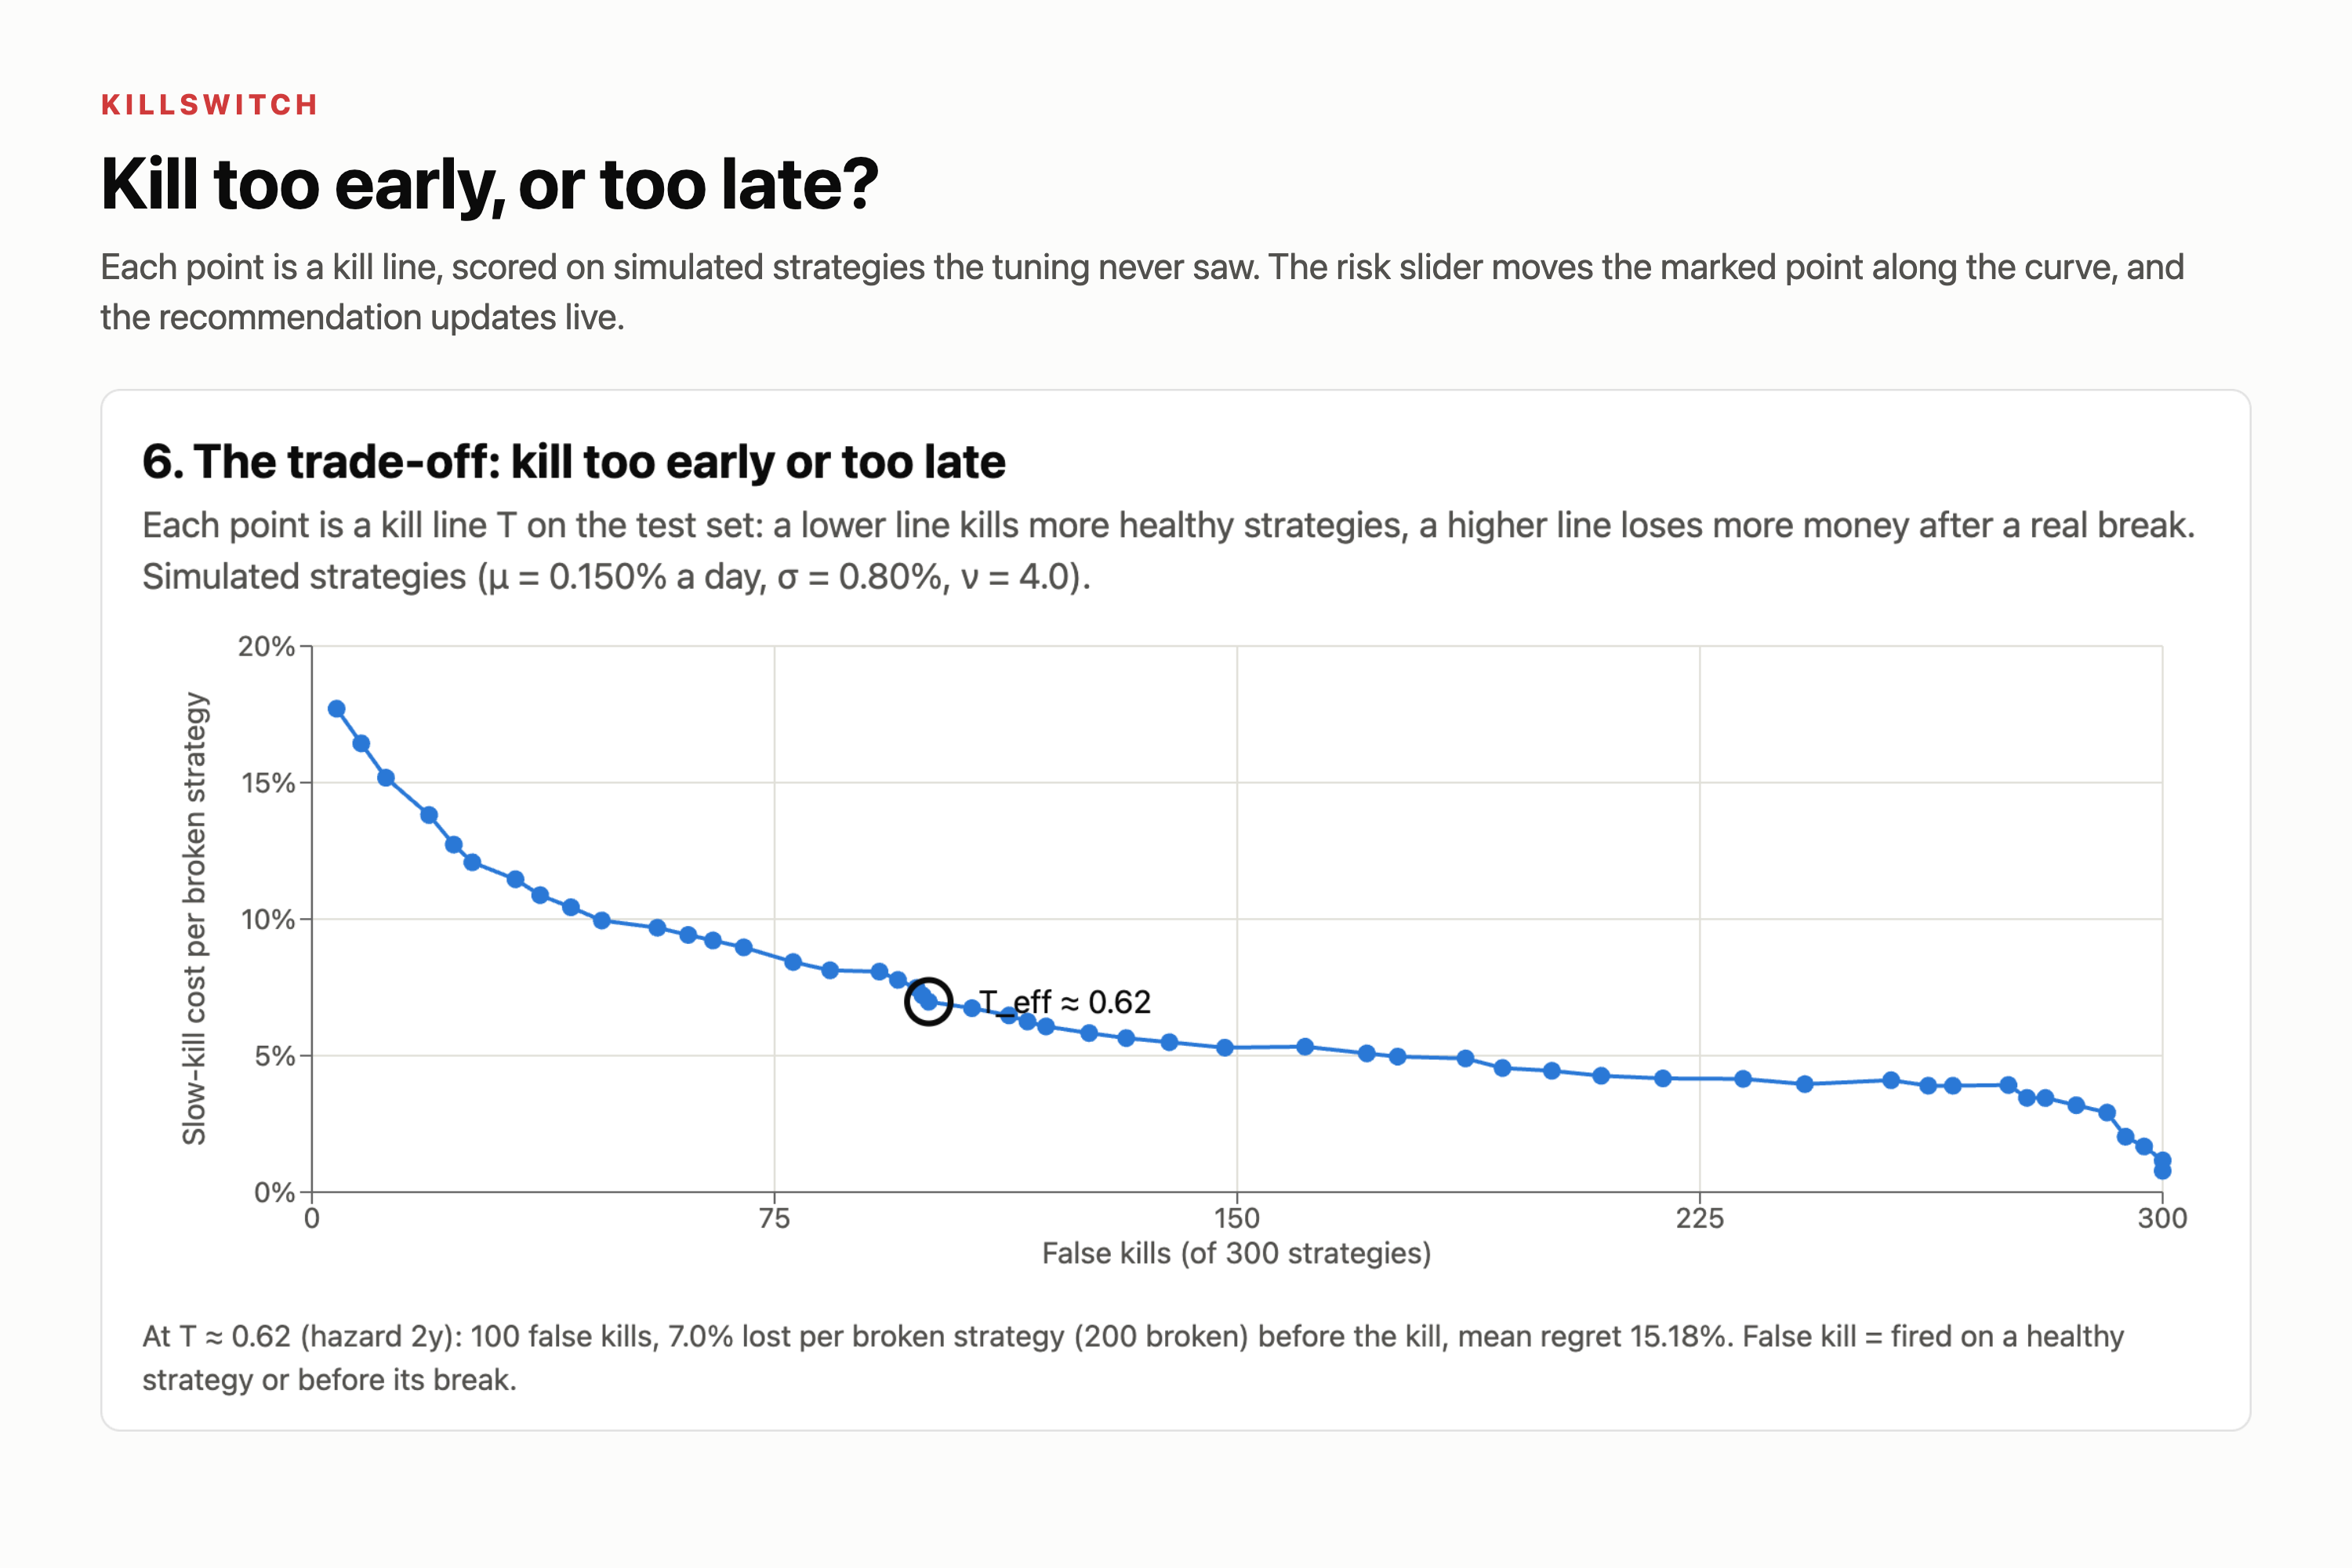
Honest tuning. Each detector's threshold is chosen by grid search to minimise regret: the profit lost against an
oracle that stops trading exactly on the day the strategy breaks.
$$
\text{Regret} = \text{PnL}{\text{oracle}} - \text{PnL}{\text{rule}}
$$
- We tune on 300 simulated strategies (healthy, sudden break, slow decay) and score on 300 fresh ones that tuning never
saw.
- For a real series, those strategies are simulated from its own warm-up fit, so its later returns never touch the
tuning.
- After a kill, a rule sits out 60 days, then restarts with its detectors reset.
The front end (React, Vite, Recharts). Anything that responds to the risk slider is recomputed in the browser. For
uploads, we run the same Python code in a web worker with Pyodide. There is only one copy of the maths, and an upload
reproduces our precomputed results exactly.
Challenges we ran into
- 250 days is not much data. At a realistic Sharpe ratio, the warm-up often can't even tell whether the mean is positive. When the fitted mean came out negative, "healthy" and "broken" became the same model, and the detector drifted towards "broken" on strategies that were fine.
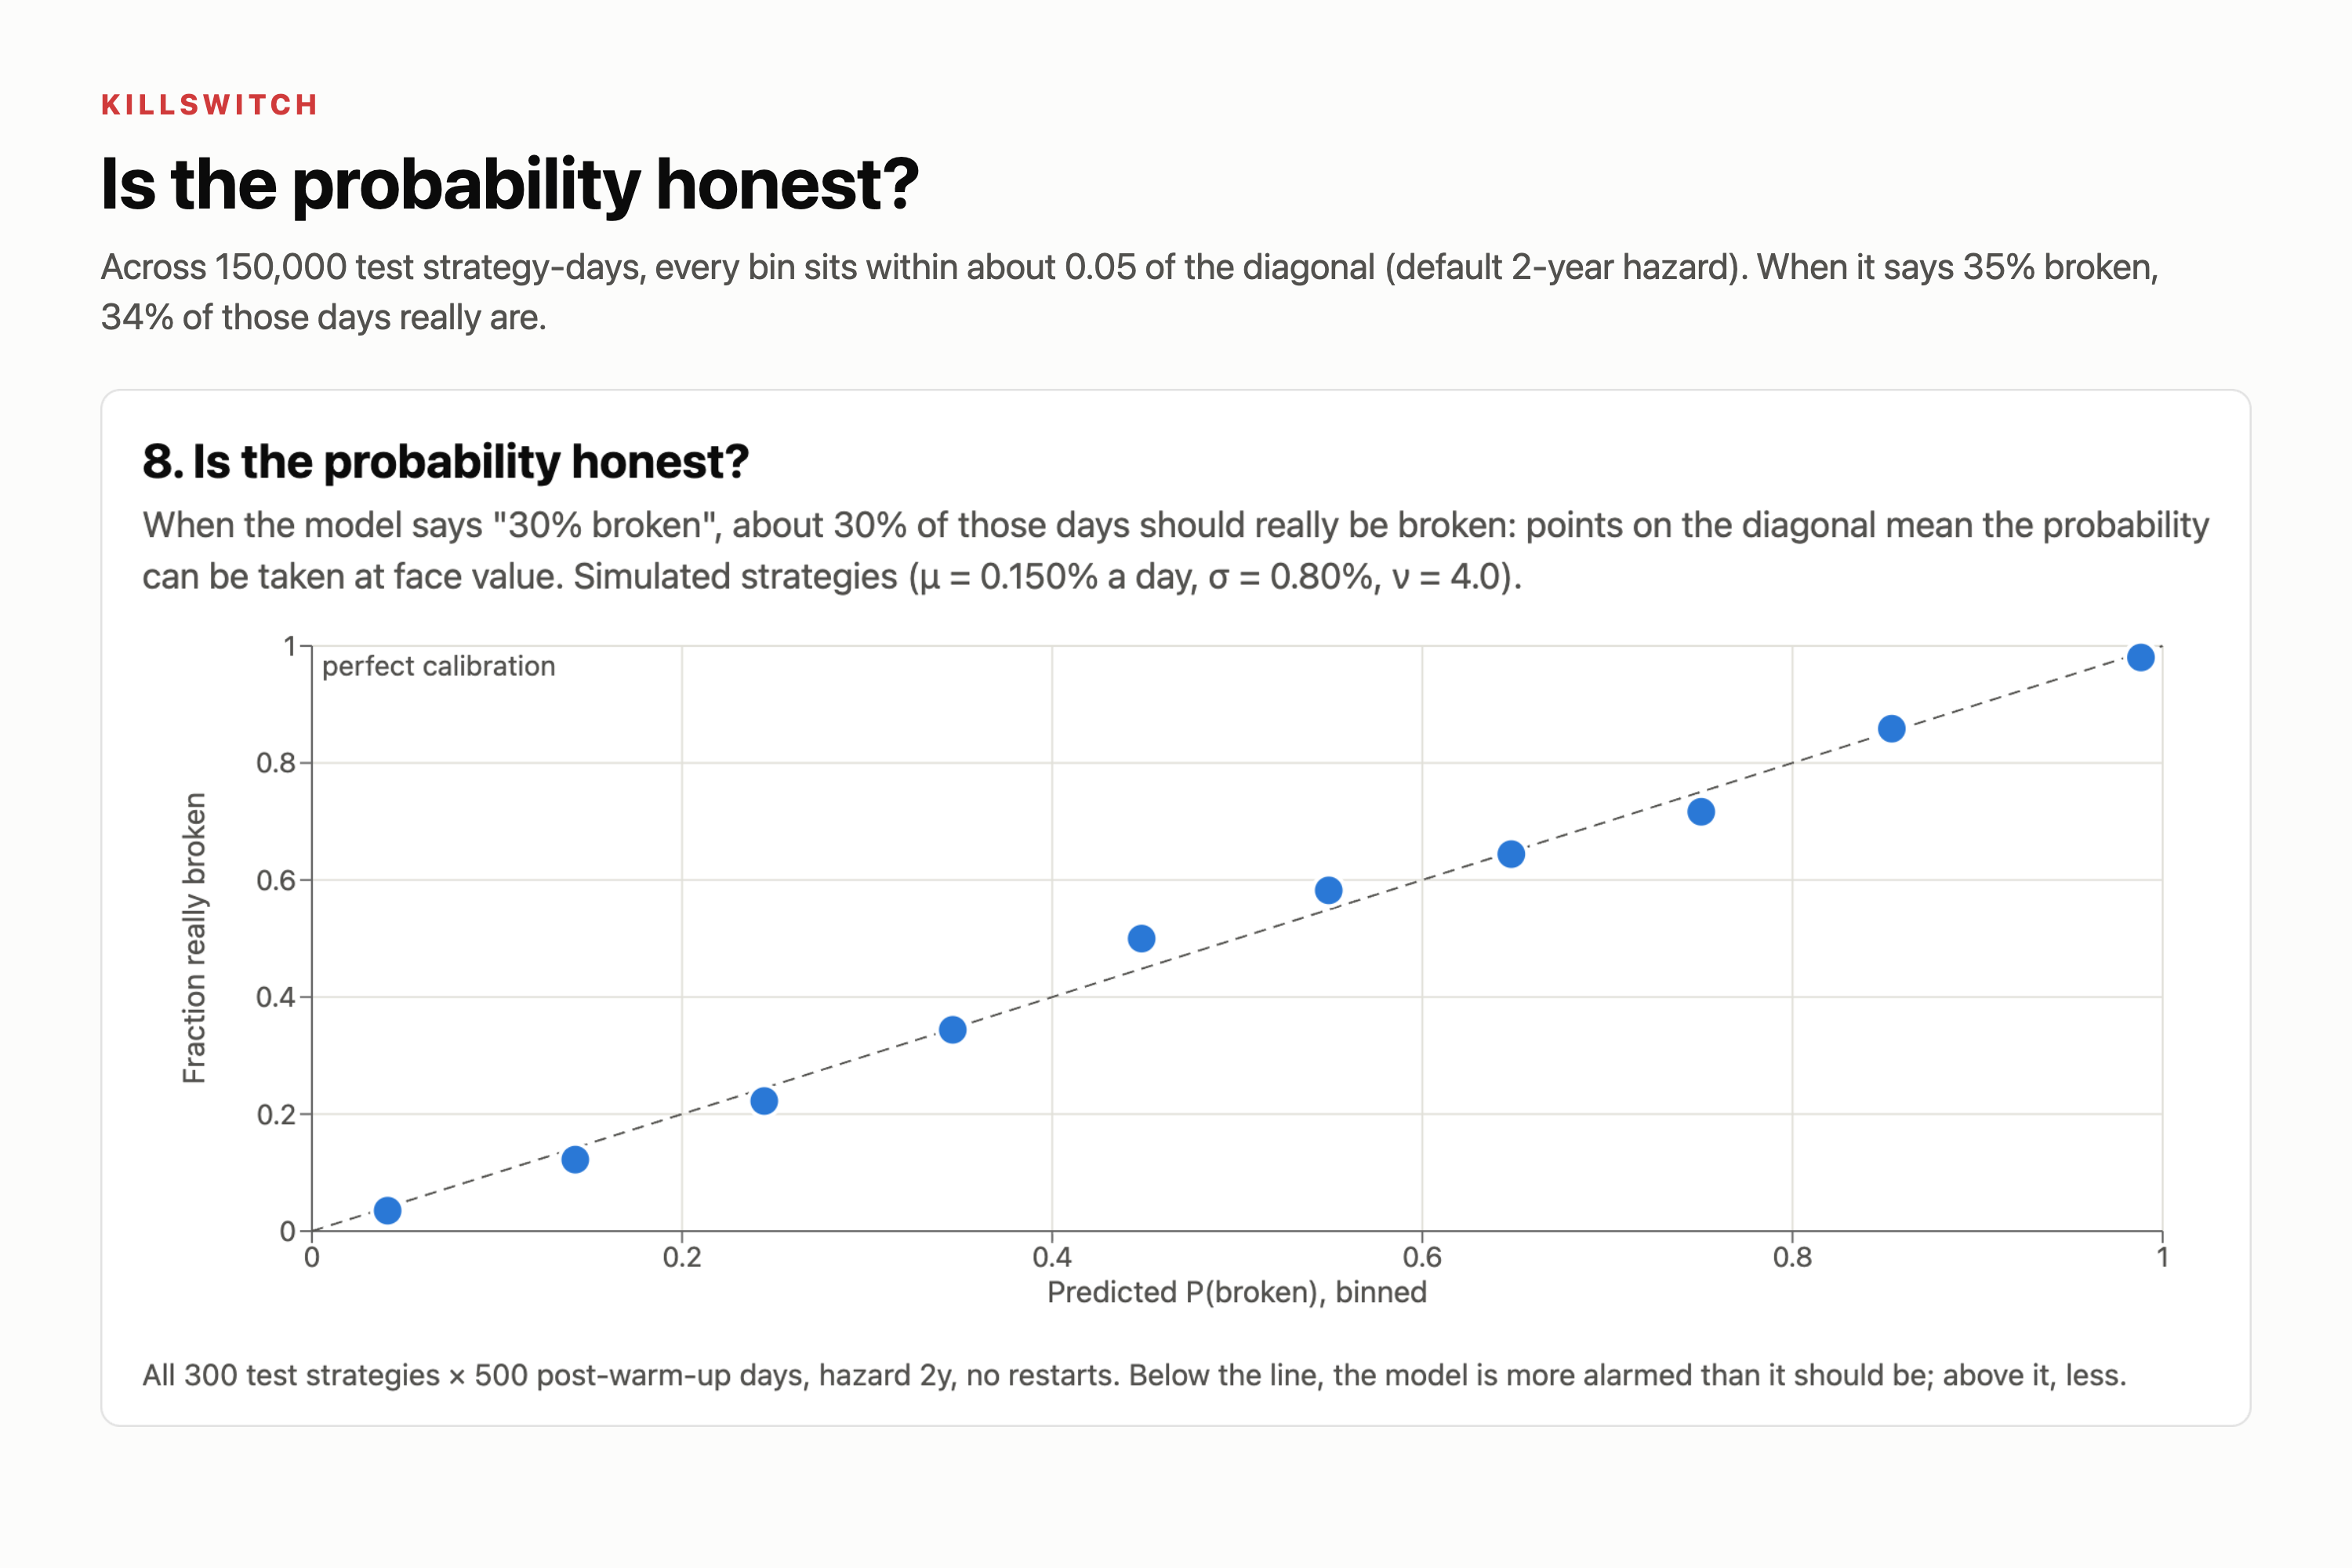
- Our own bug made the calibration chart look worse than the model was. The probabilities on the calibration chart were computed from day 0 instead of starting fresh after the warm-up. Some bins were off by up to 0.13. A code reviewcaught it, and we added a regression test.
- Speed in the browser. Running Python in the browser meant fitting 600 Student-t distributions per upload. scipy's general-purpose fitter took 11 of our 12 seconds. We replaced it with a vectorised EM fit across all strategies at once, which is about 6× faster and at least as likely as scipy's fit on every test series.
- Real data doesn't follow our model.
- Momentum's volatility roughly tripled in 2008. The drawdown detector fired in January 2008, a year before the real crash, because it measures depth against 2007's calm volatility.
- Value's 2018–2020 slump had already started inside our warm-up window. The tool correctly refuses to judge it. We kept that dataset rather than move the window until it looked good.
Accomplishments that we're proud of
- An honest scoreboard. It shows standard errors and paired gaps, and it says plainly when our Bayesian rule doesn't win. On simulated data it clearly beats never killing, but it ties CUSUM and drawdown within noise. On several real factor series, drawdown depth wins.
- Calibration. With the default 2-year hazard, every calibration bin is within about 0.05 of the diagonal. When the model says "35% likely broken", 34% of those days really are.
- The 2009 momentum crash. Using thresholds tuned only on simulations of the 2007 warm-up, the Bayesian detector fired on 2 January 2009, ahead of the March–May crash.
- One source of truth. The same Python runs on the command line and in the browser, with 59 tests behind the maths.
What we learned
- A small lead isn't a win. A 0.1-point lead in regret means nothing next to a standard error of 0.9. Tuning on one dataset and scoring on another is the only way to know whether a threshold is real.
- Heavy tails change the answer. The −14.4% momentum day on 9 November 2020 didn't make the Bayesian detector or CUSUM fire. Under a fat-tailed model, one terrible day is weak evidence of a broken strategy.
- Both kinds of error have a price. Framing the decision as two costs, rather than one threshold, made the trade-off easy to explain and to tune.
What's next for Killswitch
- A test of whether the edge was ever real, before trusting the warm-up at all.
- A volatility-regime detector alongside the mean-shift model.
- Uploads of strategy rules, broker trade logs and equity curves, not just daily returns.
- A decision journal recording what the tool recommended and what the trader actually did.
- Running the browser upload fully offline.


Log in or sign up for Devpost to join the conversation.