-
-
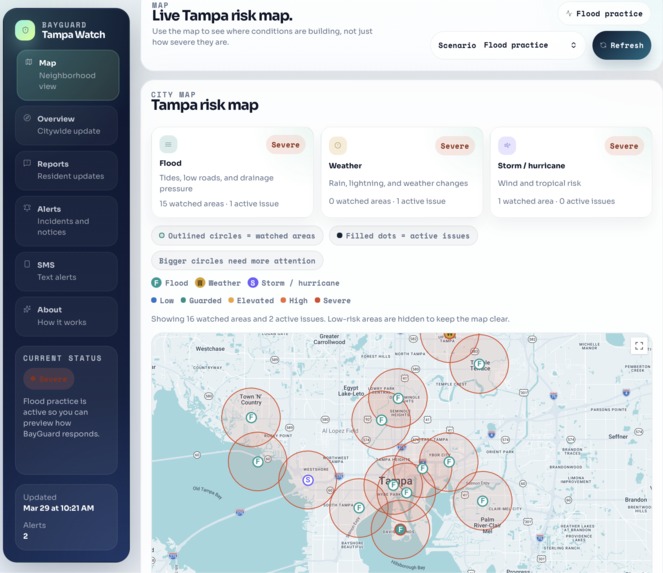
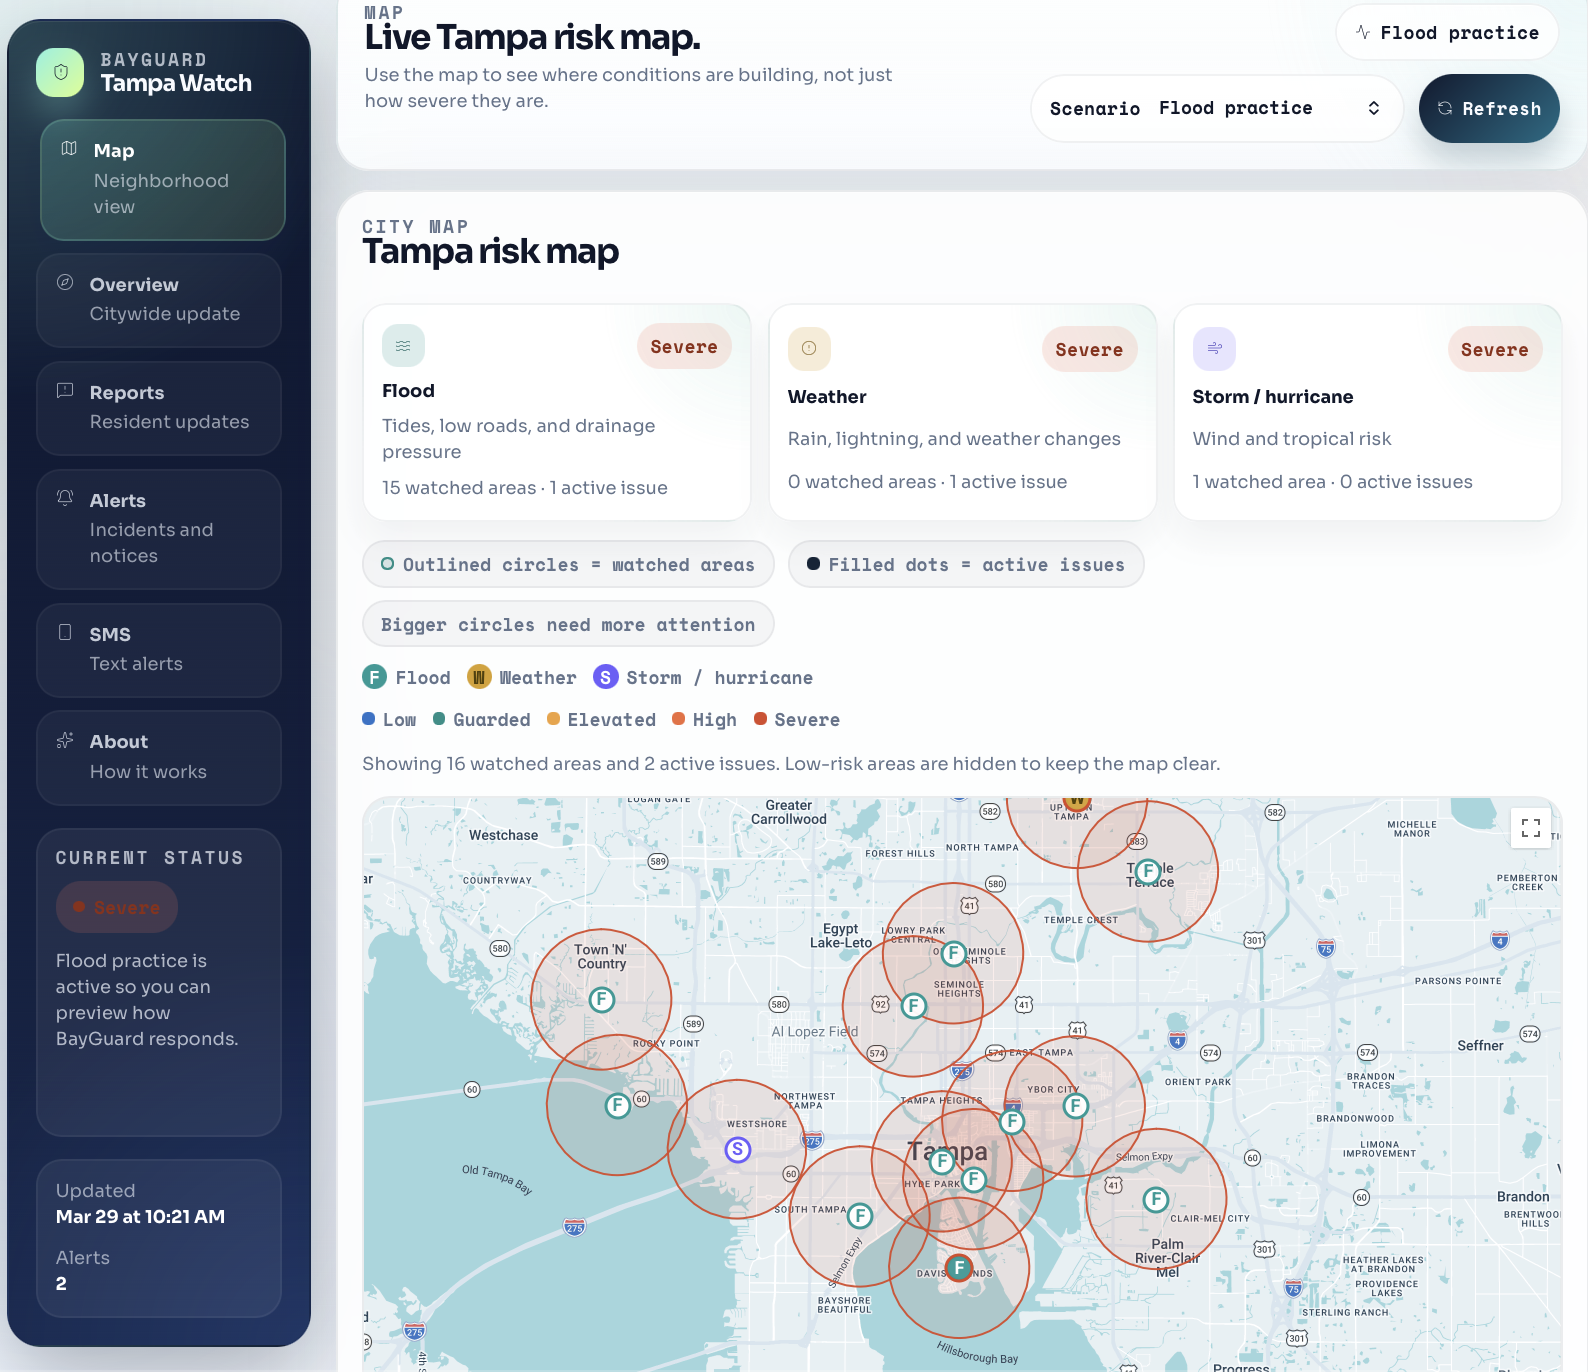
Live Tampa risk map using Google Maps, NWS, NOAA, and BayGuard zone scoring.
-
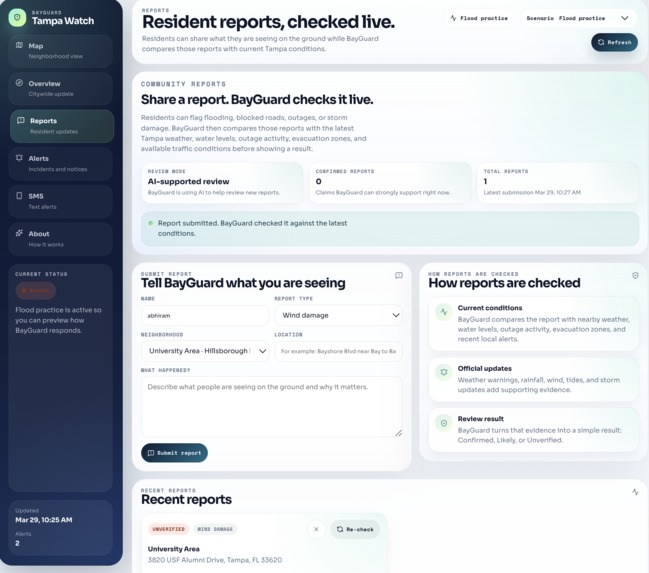
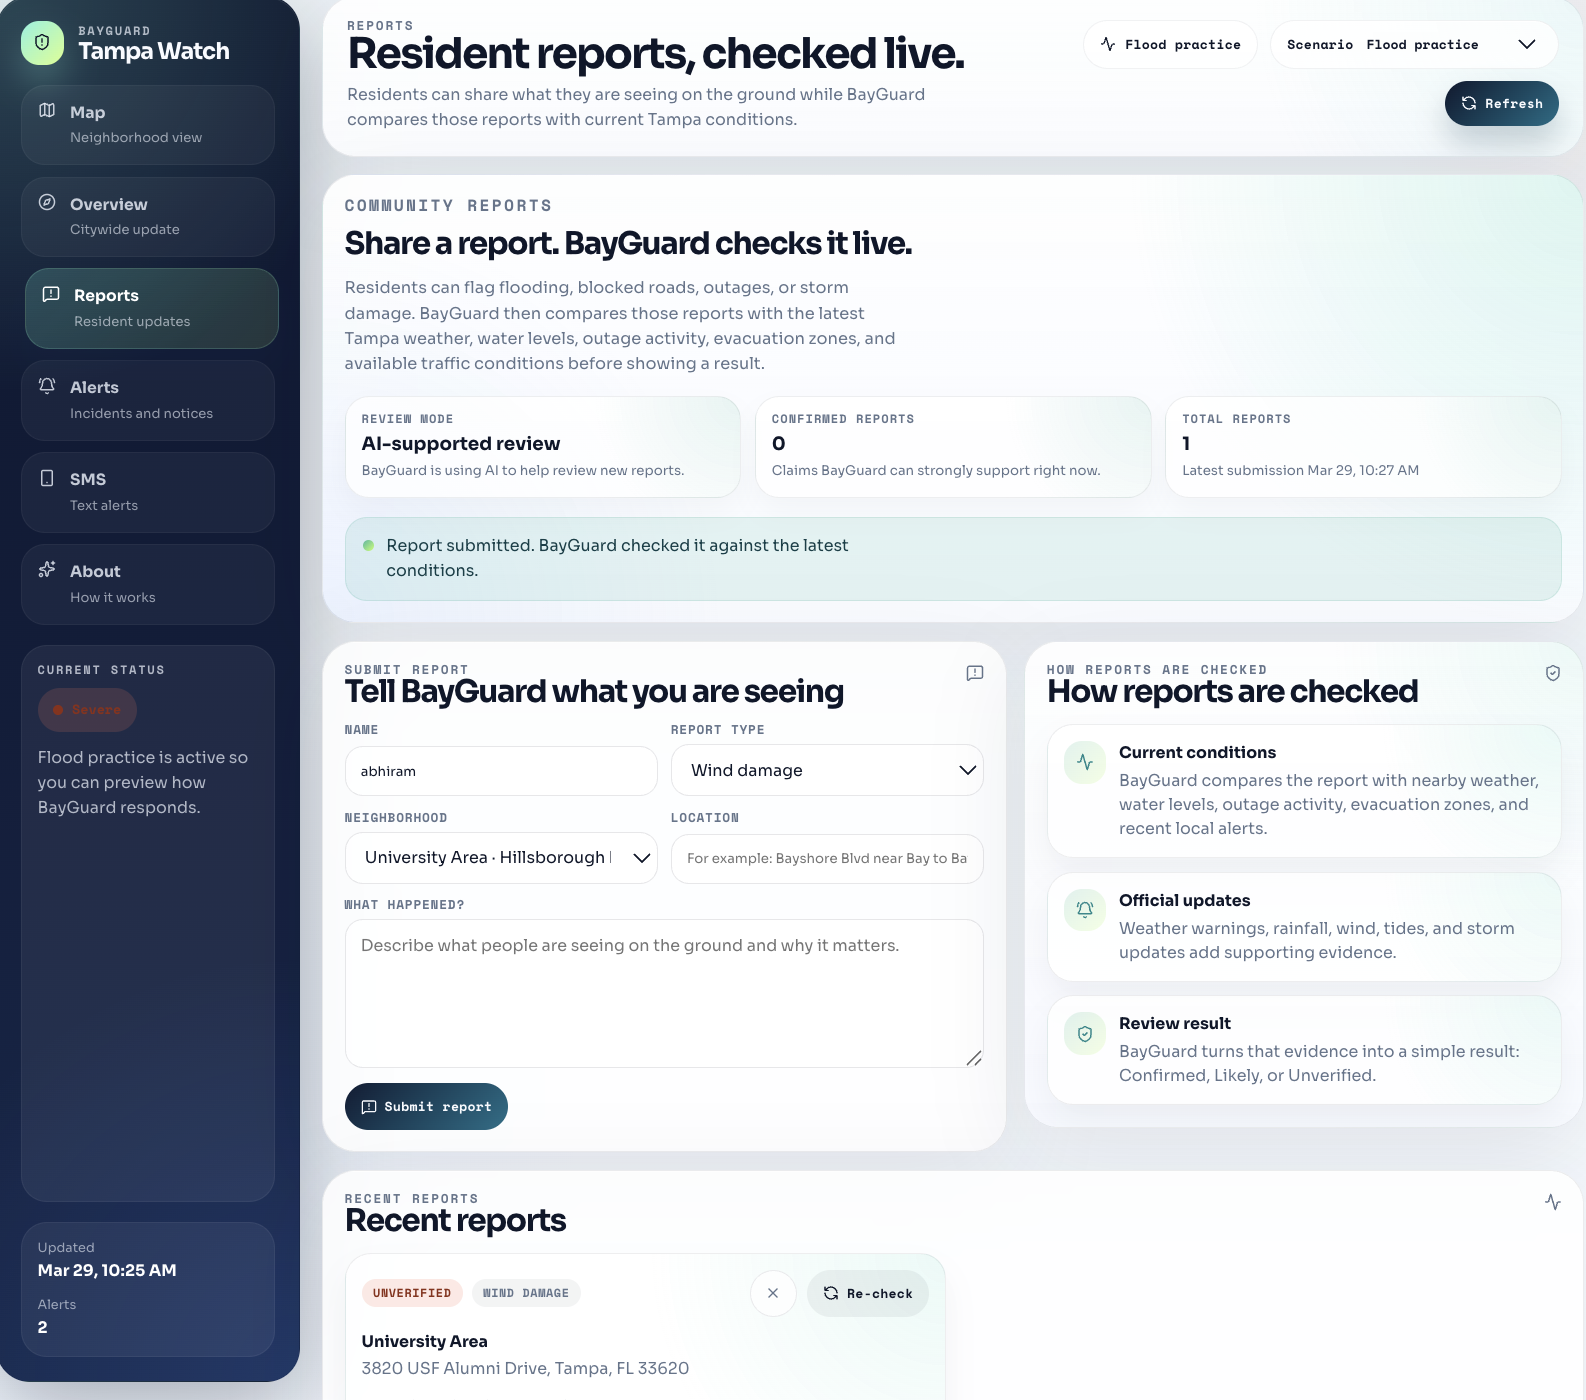
Reports: Resident reports checked with Gemini, NWS, NOAA, TECO outages, and evacuation data.
-
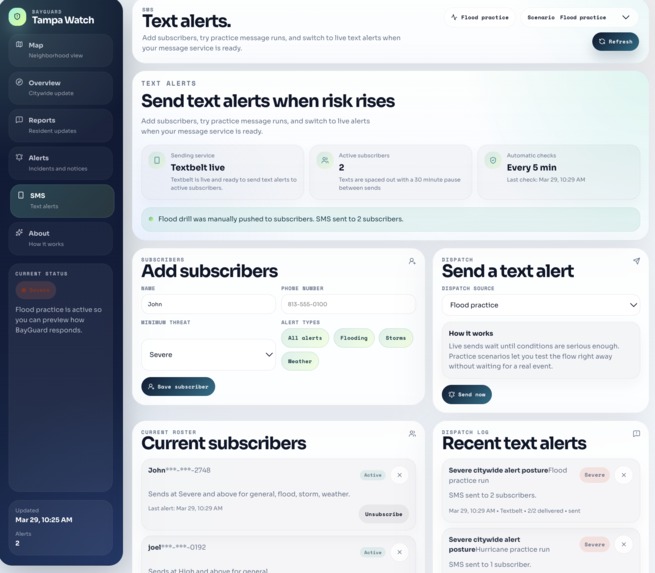
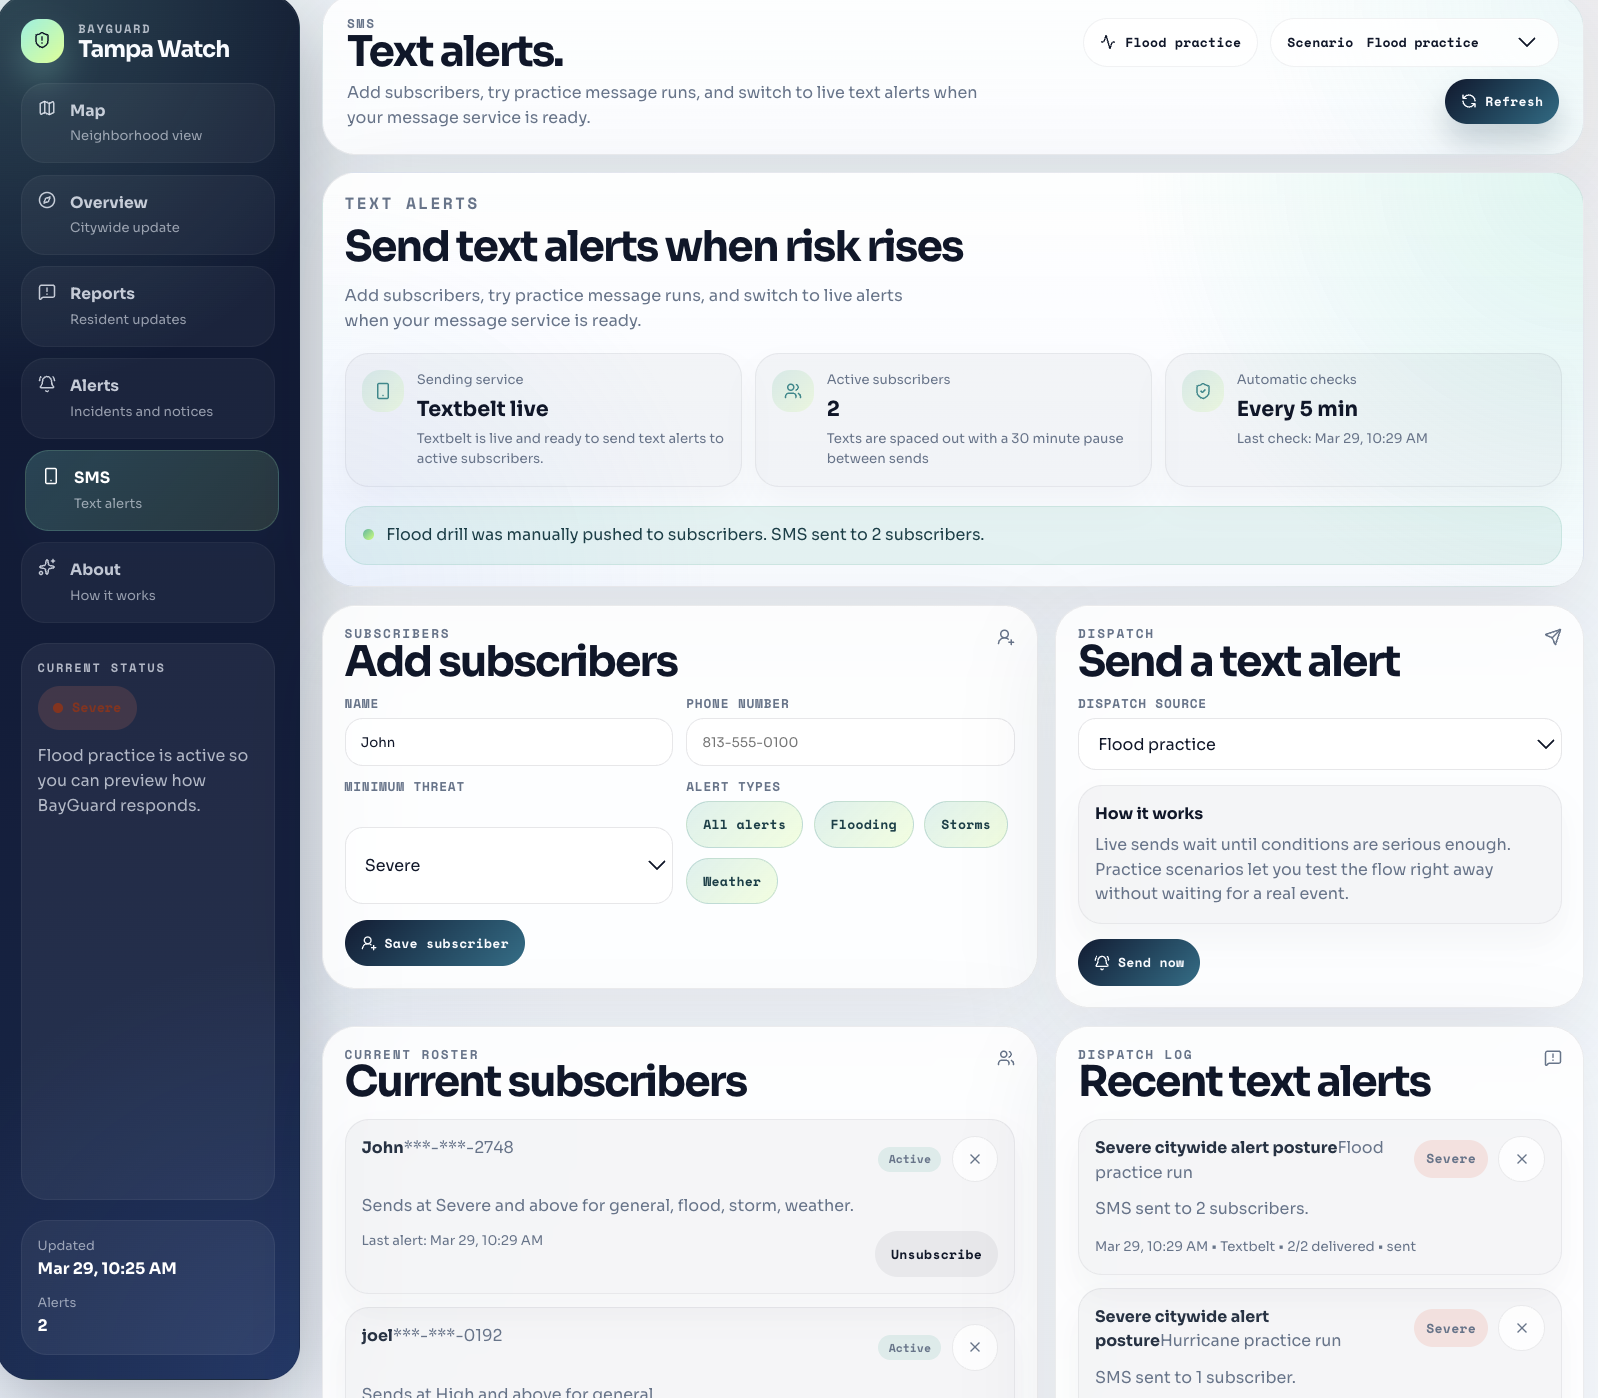
Live SMS alerts: Text alerts via Textbelt with thresholds, cooldowns, and subscriber controls.
-
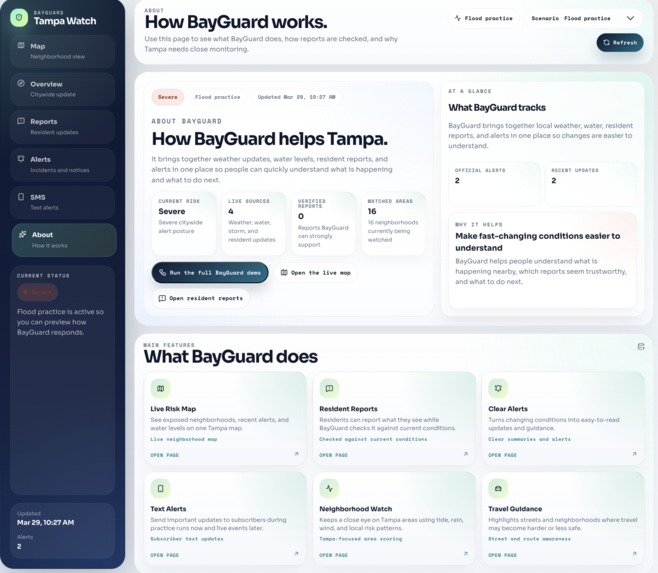
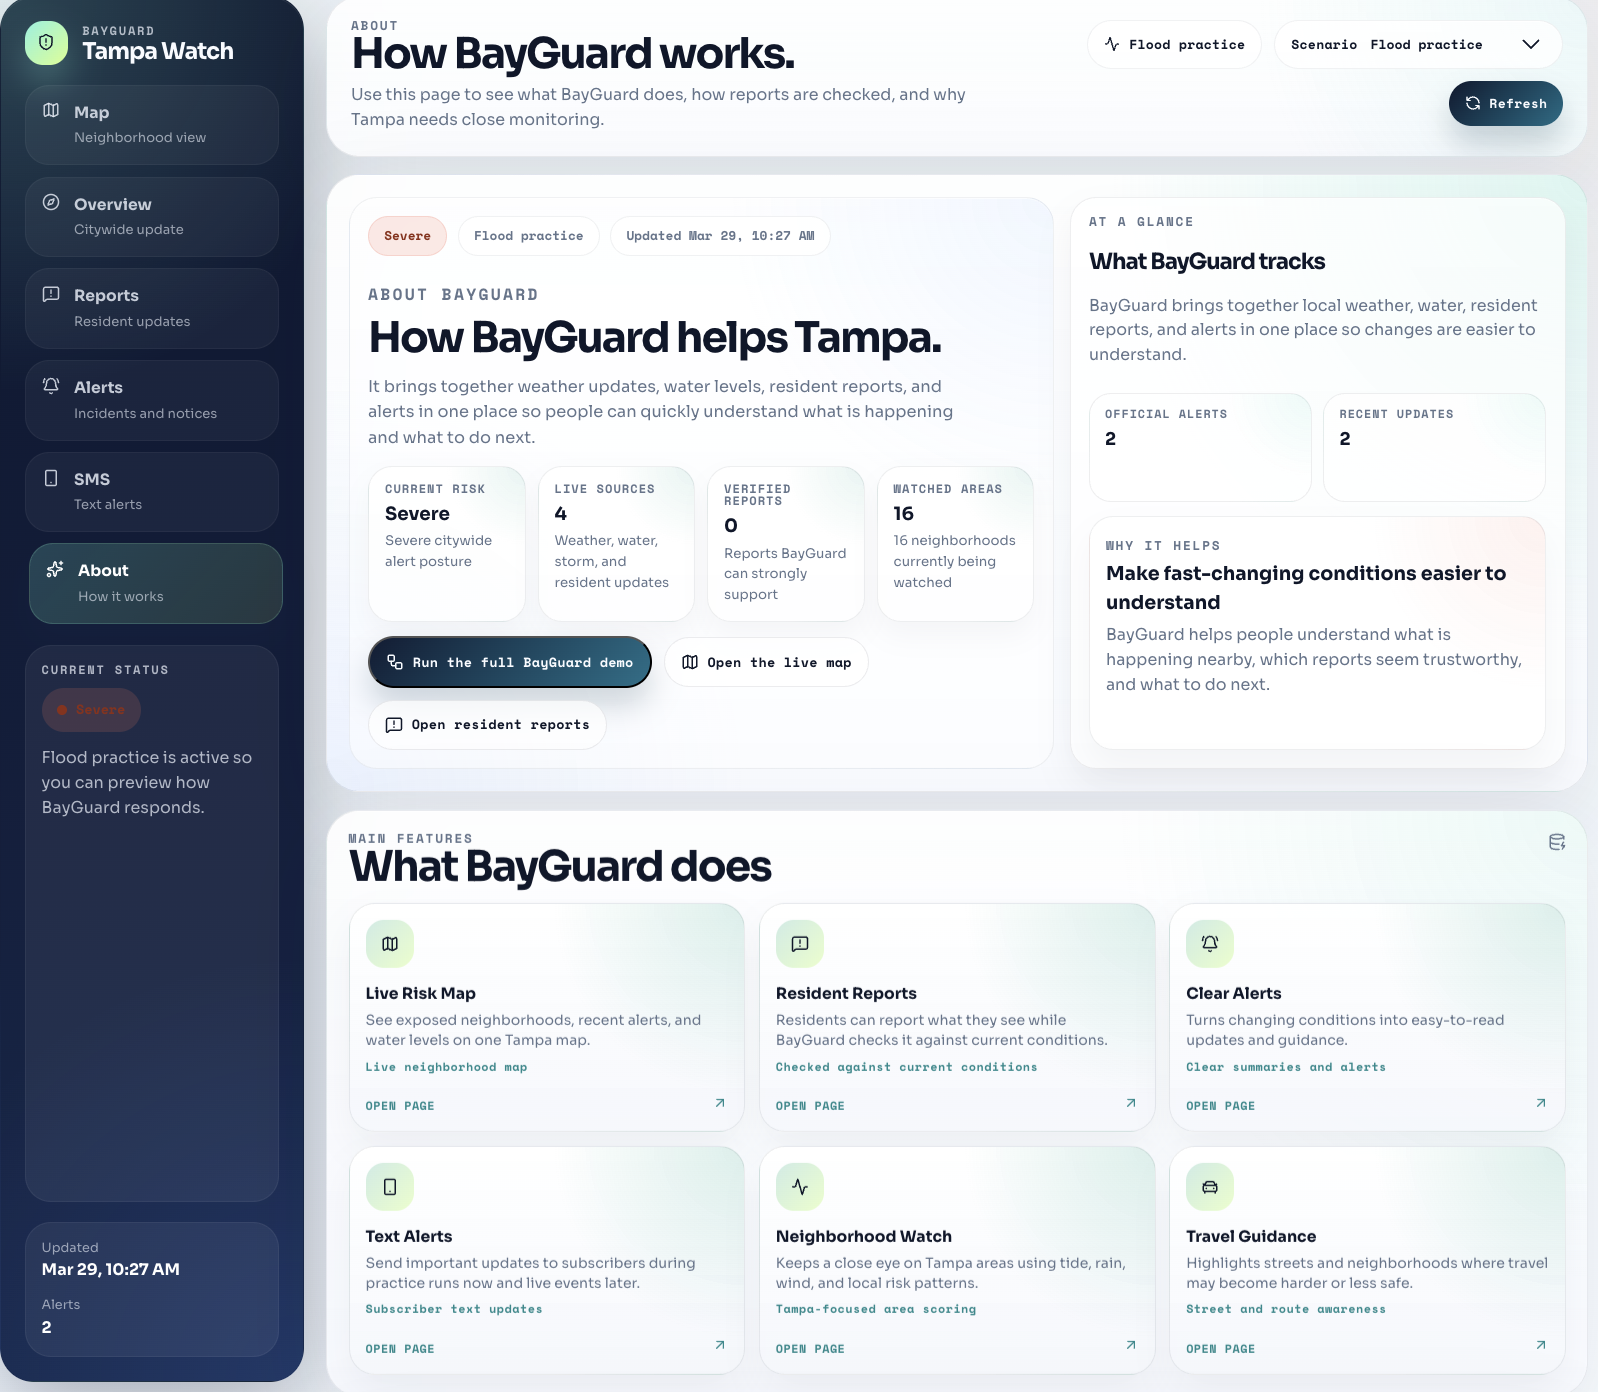
About: Explains BayGuard’s AI bots, live data sources, and Tampa-focused system design.
-
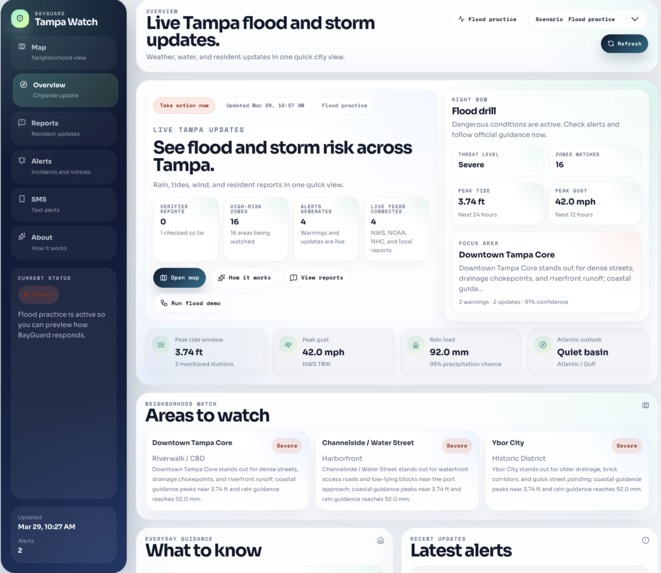
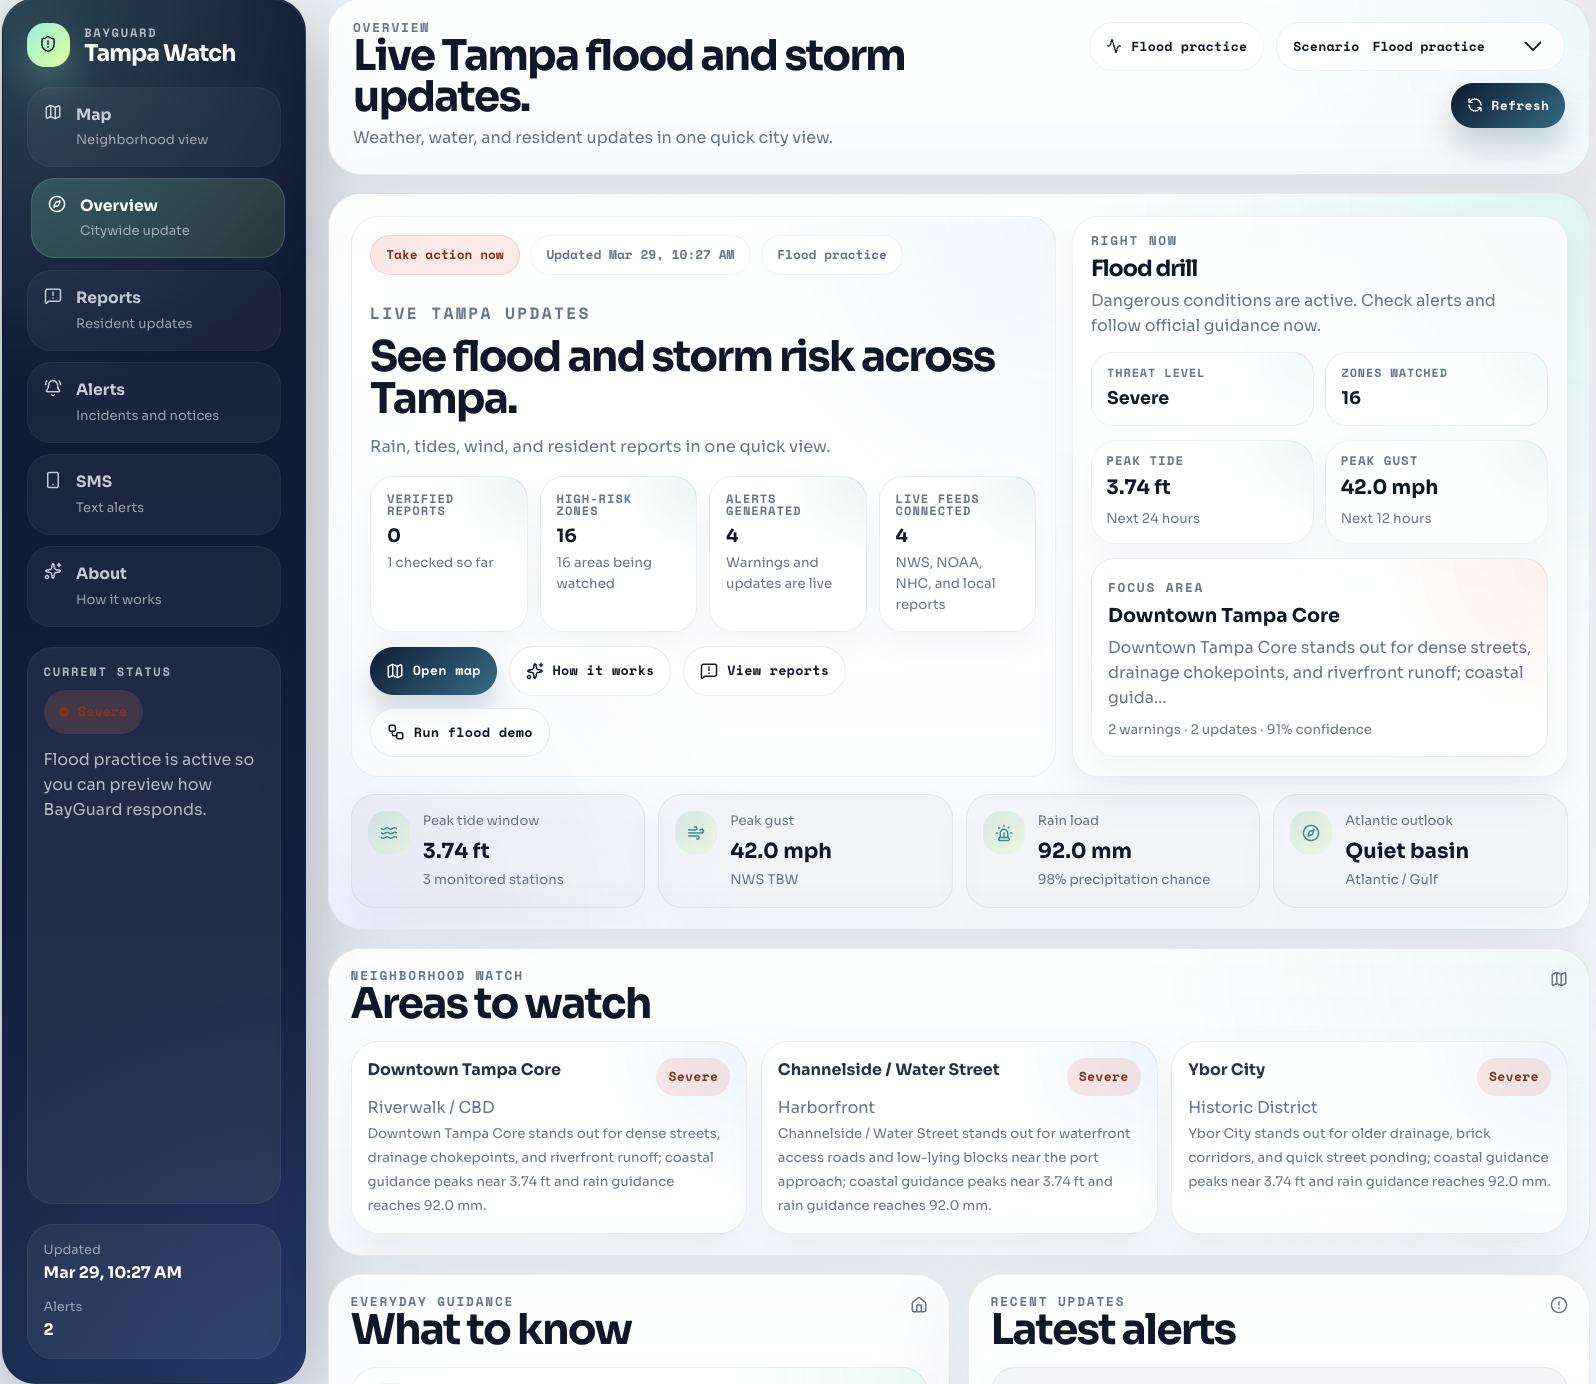
Overview: Citywide summary powered by BayGuard agents, NWS, NOAA, NHC, and reports.
Inspiration✨
Students in Tampa have sat through hurricane seasons watching friends and family scramble between weather apps, news feeds, county alert pages, and group chats trying to figure out one simple thing: is my neighborhood safe right now? The information is out there — NWS forecasts, NOAA tide gauges, hurricane center outlooks — but it's scattered across a dozen sources, written in technical language, and almost never specific to where you actually live. We wanted to build something that watches all of those signals together, checks what residents are reporting on the ground against what the data actually says, and turns fast-changing conditions into plain language anyone can act on. BayGuard started from a question we kept asking ourselves: what if Tampa had its own local intelligence system that understood the difference between Davis Islands and the University Area when a storm rolls in?
What it does🤔
BayGuard Tampa is a real-time multi-agent disaster intelligence platform built specifically for Tampa Bay. It fuses live data from the National Weather Service, NOAA coastal gauges, and the National Hurricane Center into a single operational dashboard with a Google Maps risk view, neighborhood-level scoring, community report verification, AI-generated alert language, SMS dispatch for subscribers, and an address-based evacuation zone checker. Residents can submit ground-truth reports — flooding on Bayshore, a downed tree in Seminole Heights, a power outage near USF — and BayGuard cross-references those claims against current rainfall, tide levels, wind guidance, Tampa Electric outage data, and official Hillsborough County evacuation zones before labeling them Confirmed, Likely, or Unverified. The system covers 16 Tampa neighborhoods, each scored with localized flood, weather, and storm risk profiles, so the map shows not just how severe conditions are but where they matter most.
How we built it😎
The frontend is React 19 with Vite, styled with a custom CSS design system, and uses the Google Maps JavaScript API for the interactive Tampa operations map with zone circles, incident markers, and info windows. The backend runs on Express with TypeScript, orchestrating three specialized data agents — a Weather Bot that reads NWS alerts, hourly forecasts, and gridpoint precipitation and wind data; a Flood Bot that tracks NOAA coastal water levels and tide predictions across three Tampa Bay stations; and a Storm Bot that parses NHC Atlantic tropical outlook and active advisory feeds from XML. A Final Judge agent combines their outputs into a single citywide threat posture using weighted scoring with deterministic guardrails. When a Gemini API key is configured, Google Gemini refines the final synthesis, assists with community report verification, generates evacuation guidance, and produces clearer alert language — all bounded by caps and guardrails so the AI cannot override measured sensor evidence. The SMS system supports Twilio and Textbelt for real subscriber alerts, with cooldown deduplication, automatic background evaluation, and safe dry-run mode for demos. The community report verification engine cross-references seven distinct signal sources including Florida 511 traffic events, Tampa Electric outage polygons, and Hillsborough County ArcGIS evacuation zone polygons. The app is deployed on Vercel with serverless API functions and supports Upstash Redis or Vercel KV for durable persistence.
Challenges we ran into‼️
The hardest part was getting the community report verification system right. We needed BayGuard to be skeptical enough to flag a false hurricane claim when no tropical system is active, but trusting enough to confirm a flooding report when rainfall and tide data actually back it up. Balancing heuristic scoring with AI-assisted review — and then capping Gemini's confidence so it can never override weak sensor evidence — took a lot of back and forth. Integrating five different external data sources (NWS, NOAA, NHC, Tampa Electric's CDN-based outage tile system, and Hillsborough County's ArcGIS evacuation zone layer) each with their own response formats, rate limits, and failure modes pushed us to build resilient fallback paths for every single signal. Parsing NHC XML feeds and TECO's outage tile manifests were particularly tricky. Making the Google Maps layer visually clear without overwhelming users — distinguishing zone risk circles from incident markers, color-coding by hazard type and severity — required a lot of design iteration under serious time pressure.
Accomplishments that we're proud of🏆
We shipped a fully working end-to-end system where a resident can report flooding, BayGuard checks it against live weather, water, outage, evacuation zone, and traffic data, the matching neighborhood lights up on the map, an AI-drafted alert gets generated, and the SMS control room can dispatch it to real phone numbers — all in one continuous loop. The verification engine cross-references seven distinct signal sources and produces a transparent evidence trail for every single report. The evacuation address checker uses real Hillsborough County ArcGIS zone polygons with Google Maps geocoding. We're especially proud that the entire system still runs meaningfully without any AI key — the deterministic guardrail layer keeps the dashboard functional and honest even in pure fallback mode. Every piece of data on the screen can be traced back to a live government source or a verified resident claim, and we think that kind of transparency is what makes people actually trust a tool like this.
What we learned💡
We learned how to orchestrate multiple specialized data agents into a single decision pipeline with both AI and deterministic components working together. We gained deep experience with real-time government data APIs — NWS gridpoint forecasts, NOAA tide predictions, NHC XML advisory feeds — and how to make them resilient when they go down unexpectedly. Building the verification system taught us how important transparent confidence scoring really is: users trust the system more when they can see exactly which signals support or contradict a claim instead of just getting a green or red label. We also learned a lot about structuring a full-stack TypeScript project for both local development and Vercel serverless deployment with shared types between frontend and backend, and about designing UI that communicates urgency without causing panic.
What's next for BayGuard🔮
Our immediate goals are adding real-time push notifications through a Progressive Web App layer, expanding the zone model to cover more of Hillsborough County and nearby Pinellas, and training a fine-tuned verification model on historical Tampa flood and storm report data. We want to integrate live river gauge data from the Hillsborough River to strengthen inland flood detection, add a Spanish-language interface for Tampa's bilingual communities, and build a mobile-first companion app. The Climate Teach-In Sustainability Challenge prize includes the opportunity to present BayGuard to the Tampa Bay Regional Planning Council — if selected, we would love to explore how BayGuard's neighborhood-level risk model could support real resilience planning for the communities most affected by water-related threats.
Built With
- express.js
- fast-xml-parser
- gemini-ai
- google-maps
- lucide-react
- nhc-xml-feeds
- noaa-co-ops-api
- nws-api
- react
- redis
- typescript
- upstash
- vercel
- vite


Log in or sign up for Devpost to join the conversation.