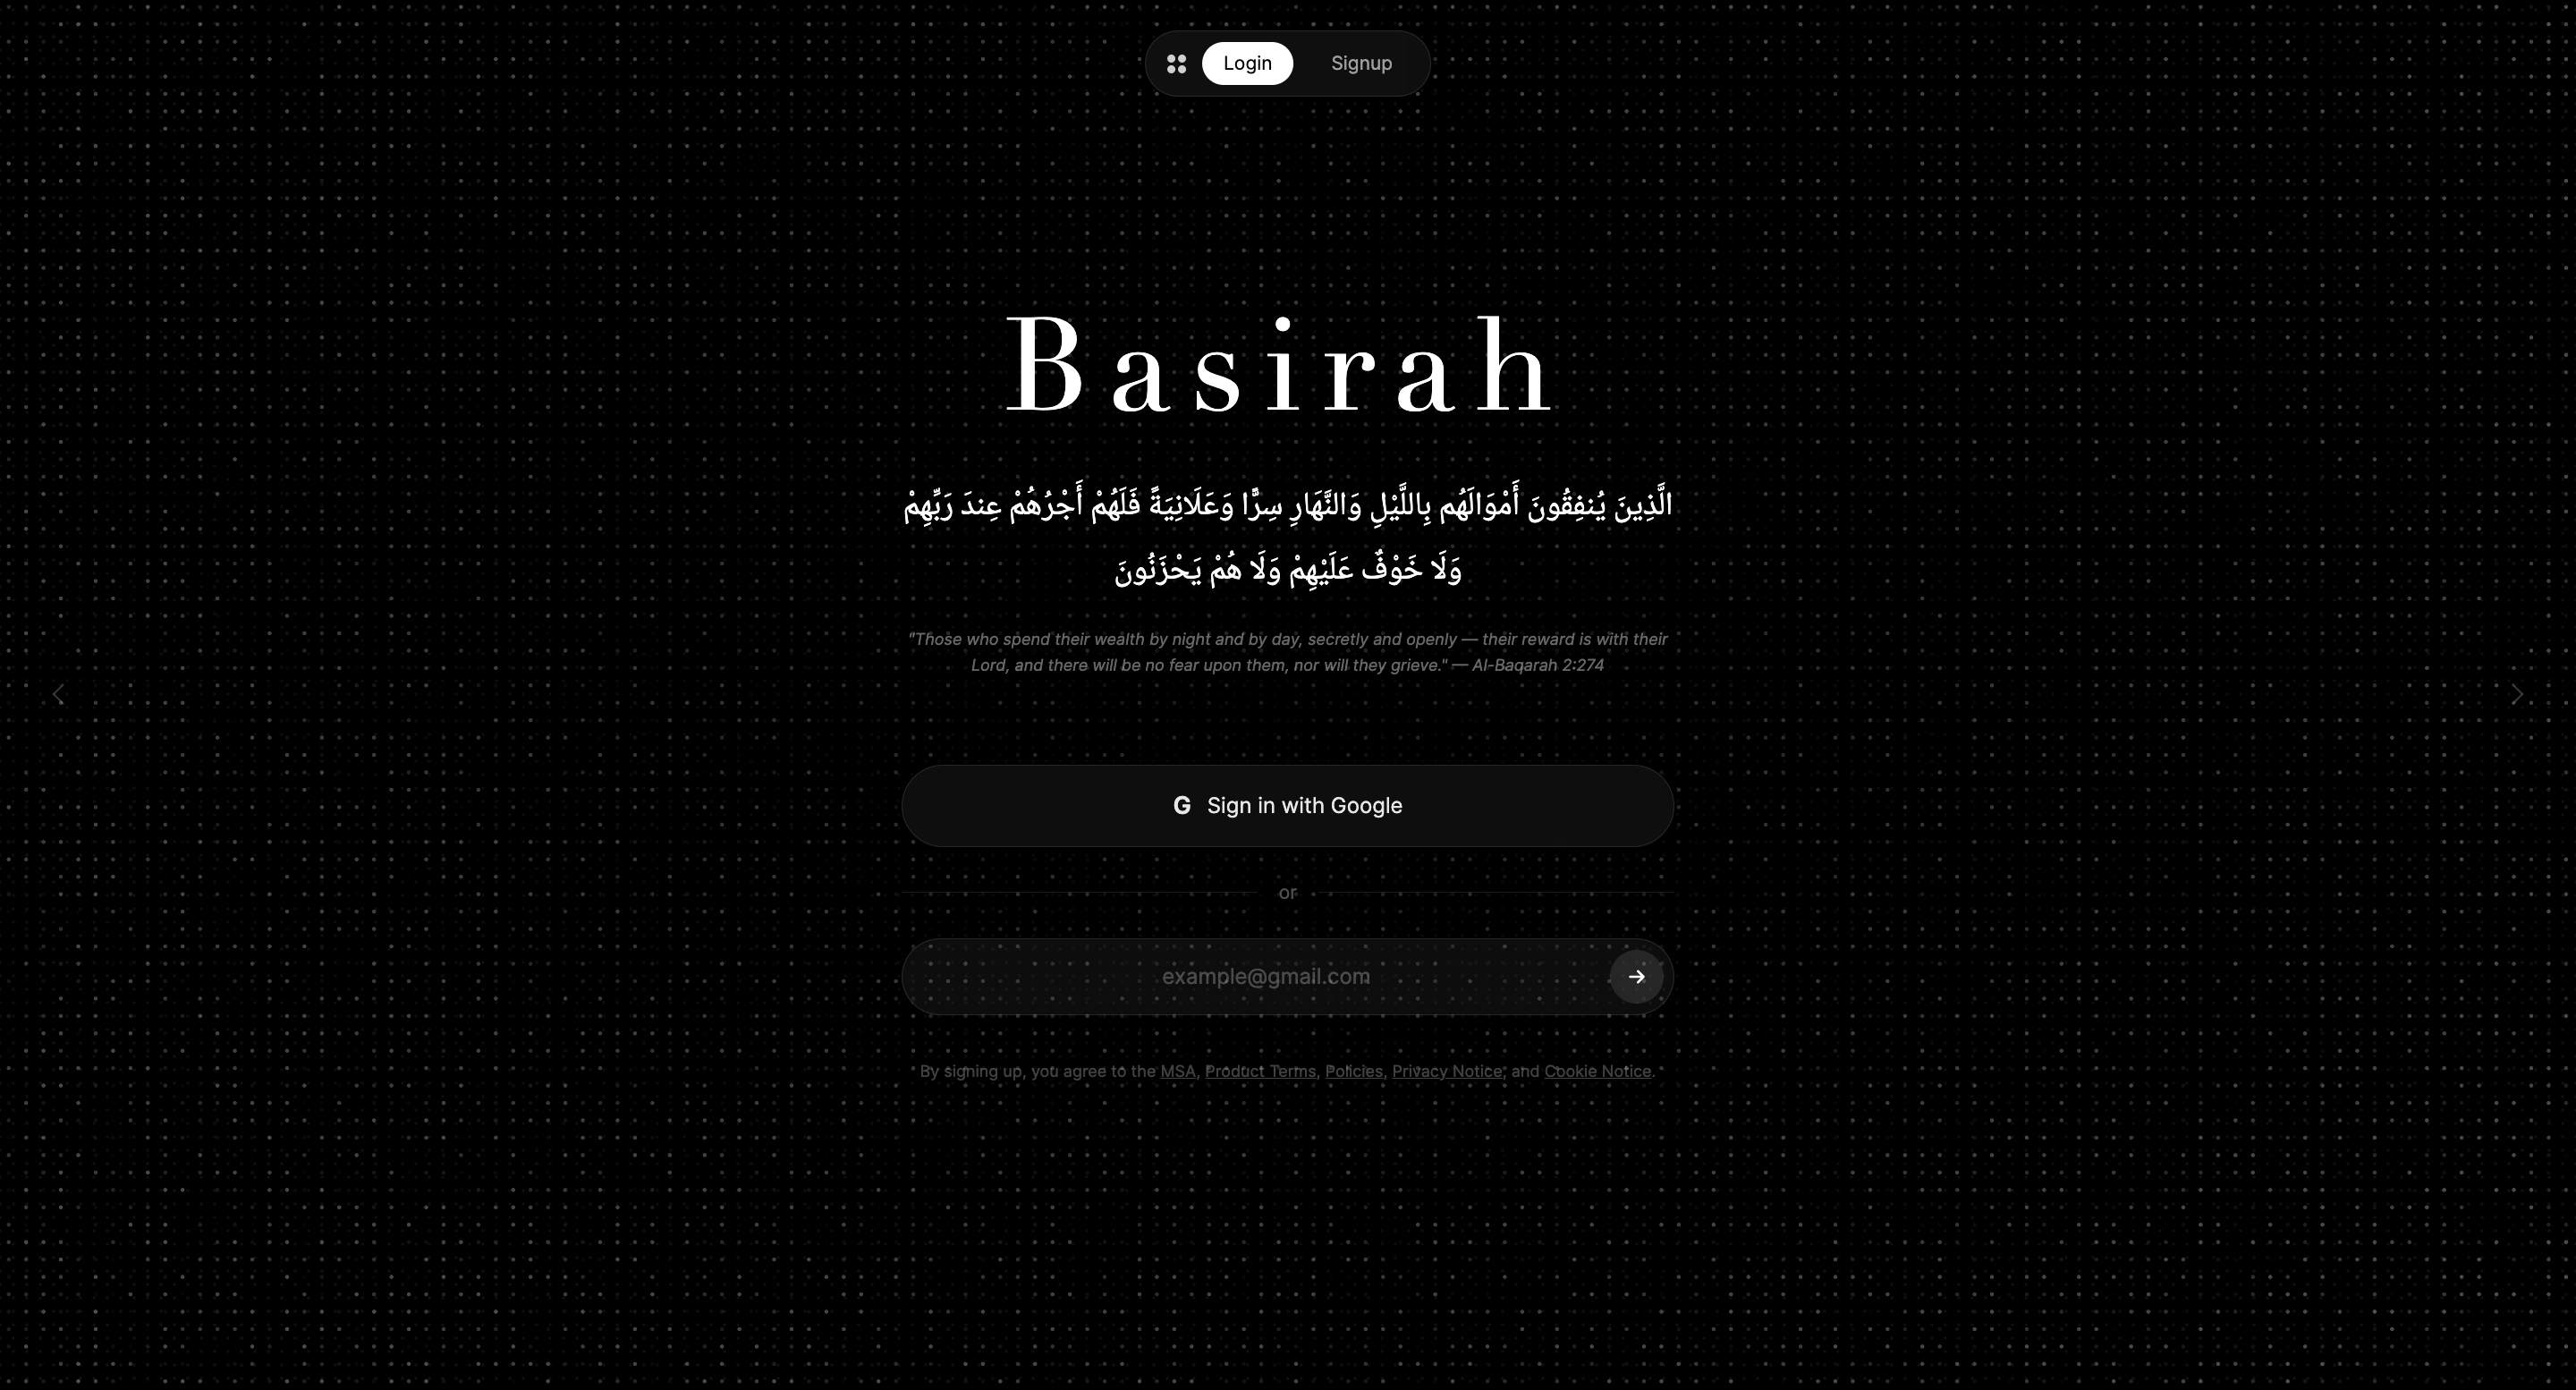
Basirah — بصيرة
"Those who spend their wealth by night and by day, secretly and openly — their reward is with their Lord, and there will be no fear upon them, nor will they grieve." — Al-Baqarah 2:274
Inspiration
Humanitarian crises only get funded when they go viral.
When a disaster trends on Twitter, donations flood in. When it doesn't — even if millions are suffering — it gets nothing. This is spotlight inequality, and it kills people.
We wanted to build something that made every crisis visible, not just the ones that happen to capture the internet's attention for 48 hours. As Muslims, the concept of Zakat — obligatory charitable giving — already frames generosity as a duty, not a reaction to a news cycle. Basirah is the tool we wished existed: one that shows you the full picture, not just what's trending.
The name Basirah (بصيرة) means insight — the ability to see truth clearly. That's exactly what we set out to build.
What It Does
Basirah is a humanitarian crisis dashboard that turns data into understanding, and understanding into action.
The core flow: Explore → Understand → Donate → See Your Impact
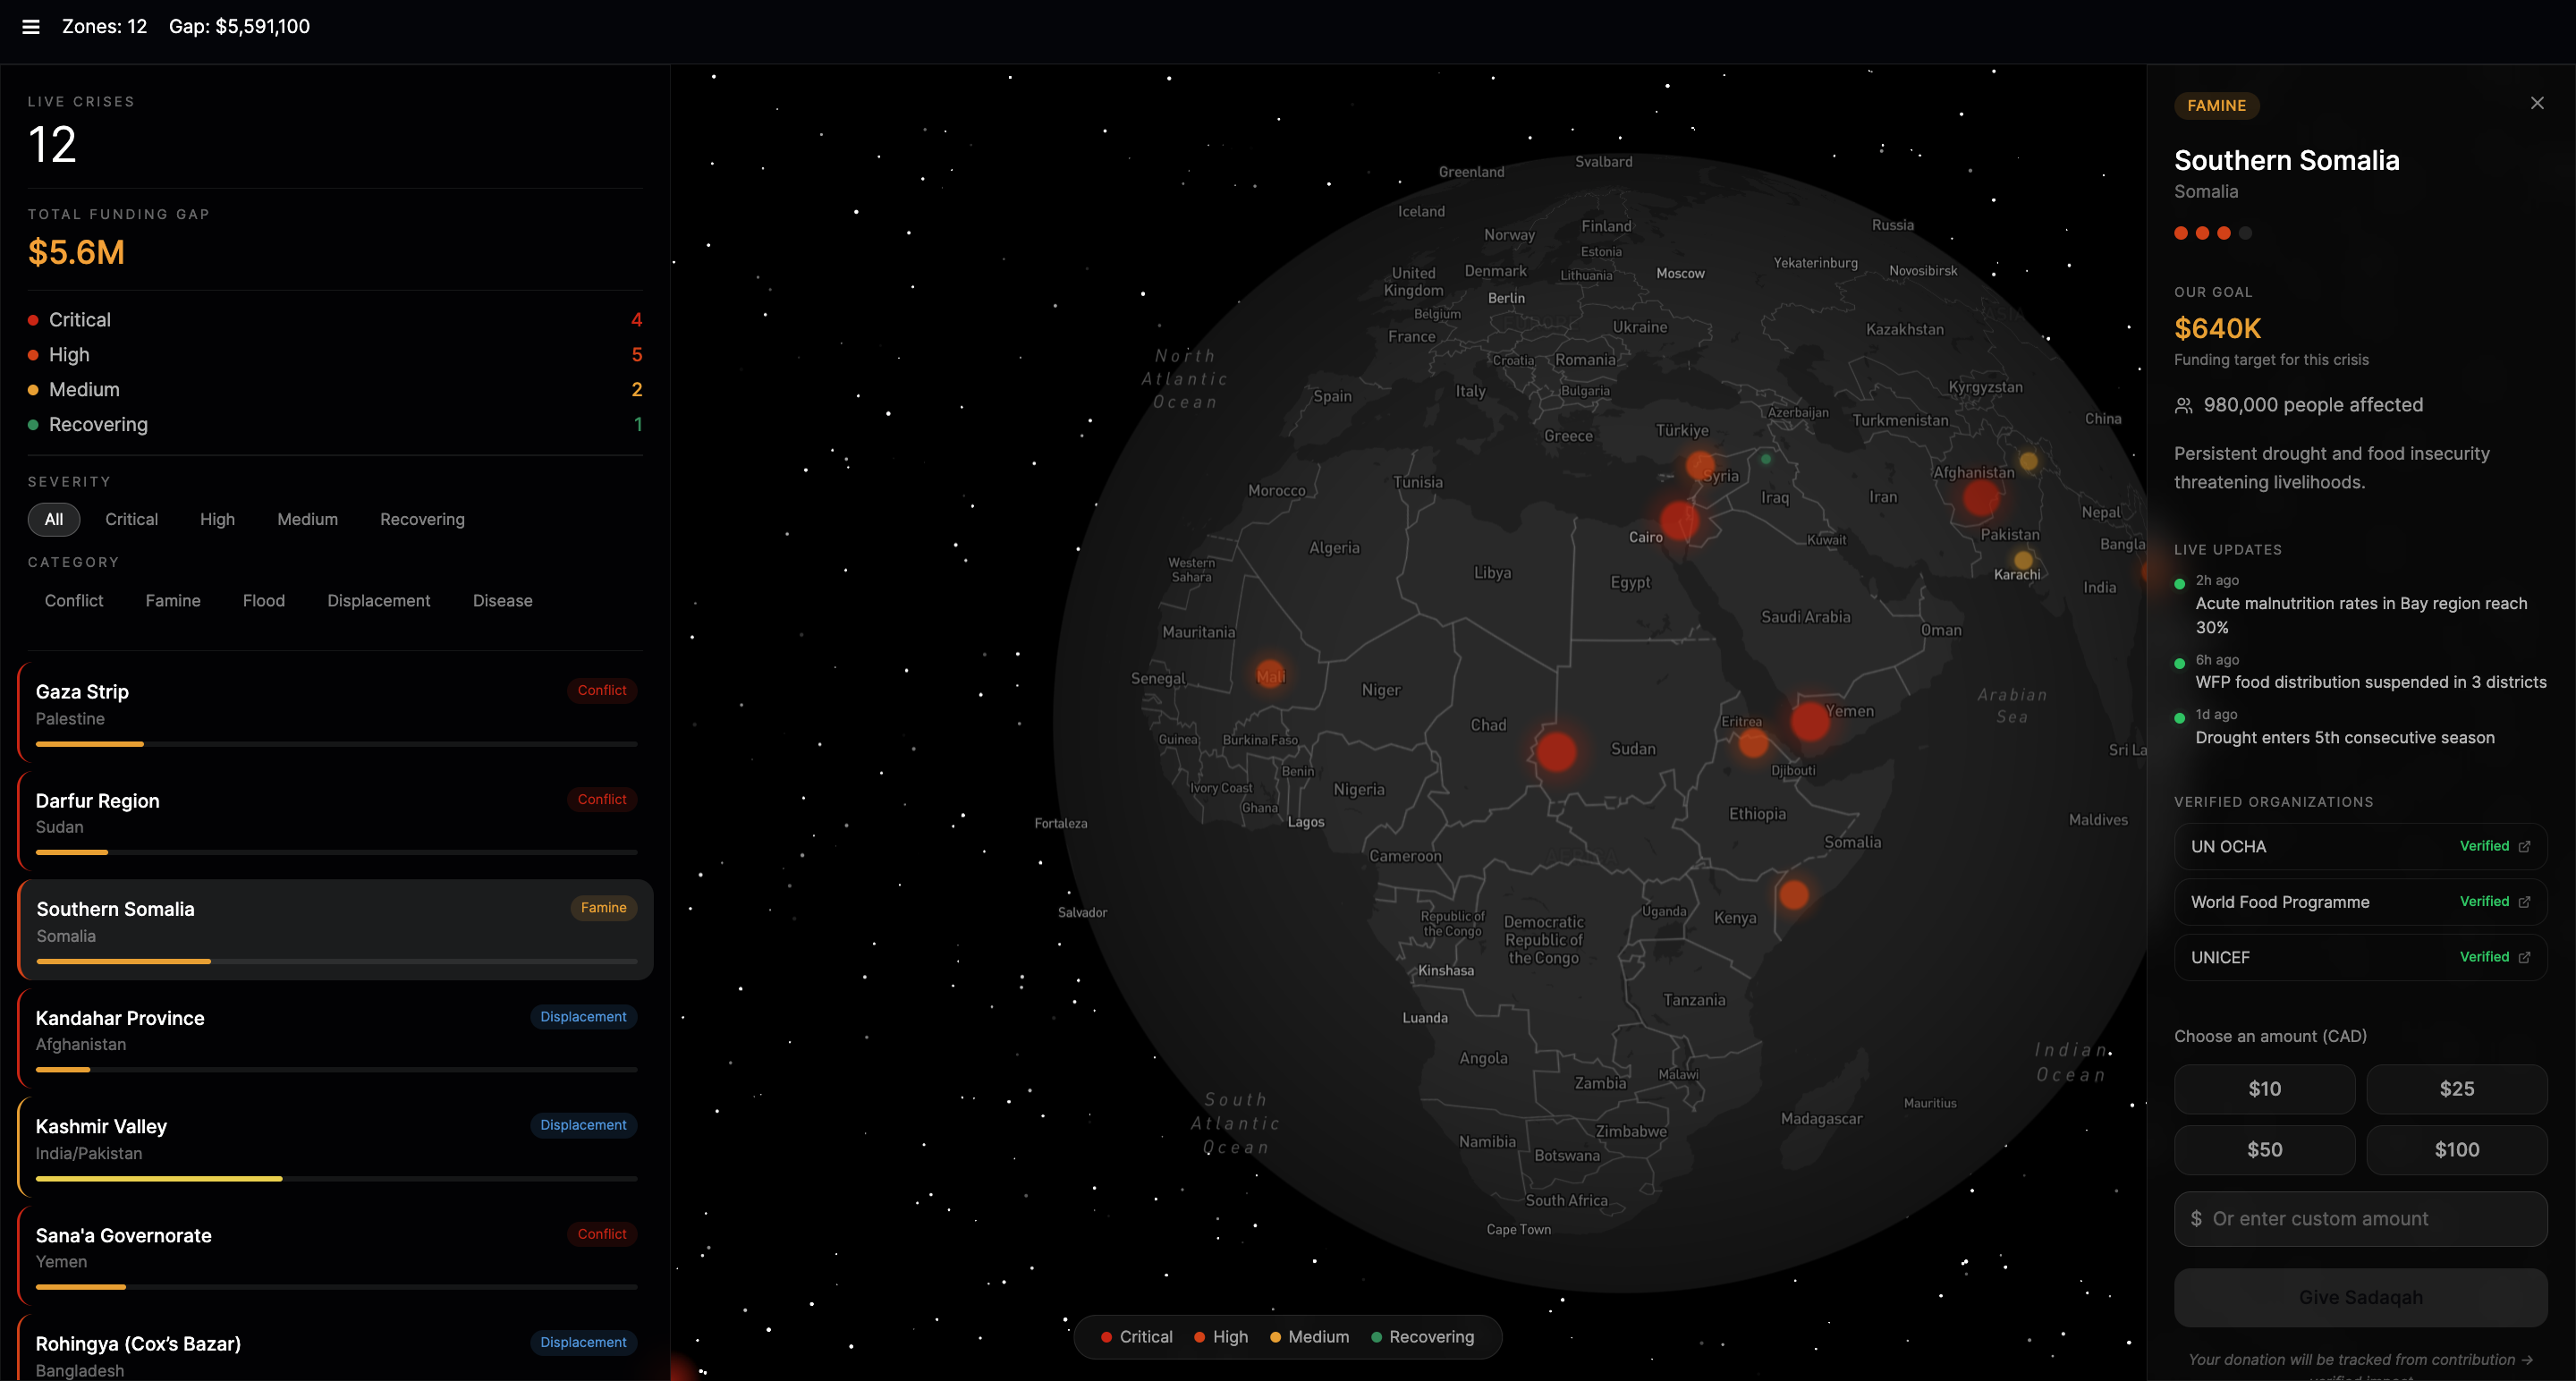
🌍 Live Crisis Globe
An interactive 3D globe powered by Mapbox GL JS displays 12 active crisis zones worldwide. Each zone is color-coded by severity — Critical (red), High (orange), Medium (yellow), Recovering (green) — and the globe auto-rotates to give a real sense of global scale. Users can filter by severity or crisis category (conflict, famine, flood, displacement, disease).
📋 Crisis Intelligence Panel
Clicking any zone flies the camera directly to it and opens a detailed panel with real-time updates, casualty figures, funding gaps, and aid status. Every zone links to verified organizations — UNICEF, MSF, Islamic Relief, UNHCR, Red Cross — so users know exactly where their money goes.
💸 Zakat & Sadaqah Donation Flow
Users choose their intention (Zakat or Sadaqah), pick an amount ($10, $25, $50, $100 or custom), and donate in CAD. The distinction between Zakat and Sadaqah is intentional — for many Muslim users, this is spiritually significant, and we wanted to honor that.
✨ Impact Beam Animation
When a donation is made, the globe zooms out to show the full Earth. A gold beam of light animates from the user's location to the crisis zone using a great-circle arc, with a ripple effect pulsing at the destination. A confirmation toast appears: "$X sent to [Crisis Zone] — impact recorded." It makes giving feel real.
How We Built It
| Layer | Technology |
|---|---|
| Framework | React 18 + Vite + TypeScript |
| Styling | Tailwind CSS + shadcn/ui |
| Globe / Map | Mapbox GL JS (globe projection) |
| Animations | Framer Motion |
| Auth | Google OAuth via @react-oauth/google |
| UI Components | Lucide React, Radix UI |
Globe: Mapbox GL JS renders a true 3D globe using the globe projection. Crisis zones are GeoJSON circle layers with severity-based color mapping. The auto-rotation uses requestAnimationFrame and pauses on user interaction.
Donation Beam: DonationBeam.tsx calculates a great-circle arc from the user's coordinates to the crisis zone and animates it using Mapbox's line-dasharray trick — a moving dash pattern that simulates a traveling beam of light.
Auth: Google OAuth gates the entire app. On success, the main dashboard renders with the user's name displayed in the top bar.
Data: All crisis data lives in a structured TypeScript file (crisisZones.ts) with coordinates, severity levels, live update feeds, funding goals, and verified organization links per zone.
Challenges
- Mapbox globe projection has quirks with GeoJSON layer rendering at high zoom levels — getting smooth
flyTotransitions between crisis zones without jarring camera jumps took significant tuning. - The donation beam animation required combining Mapbox's line layer system with a custom great-circle path calculator. Making it feel smooth and emotionally impactful (not just a technical gimmick) was harder than expected.
- Scope vs. time — we had to cut a live data API integration and fall back to structured static data. Real-time OCHA/ReliefWeb API integration is the obvious next step.
Accomplishments
- Shipped a fully functional, visually polished app in 36 hours
- Built an experience that actually feels meaningful — the impact beam was the moment we knew we had something real
- Designed a donation flow that respects Islamic giving intentions (Zakat vs. Sadaqah) — something no mainstream platform does
What We Learned
- Mapbox GL JS is incredibly powerful but has a steep learning curve for custom layer animations
- Emotional design matters as much as technical design — the beam animation changed how the whole app felt
- Scope ruthlessly. We cut 4 features to ship 1 great one.
What's Next
- Live data from OCHA Financial Tracking Service and ReliefWeb APIs
- Donation processing via Stripe with receipts for Zakat records
- Impact tracking — show users the cumulative effect of their giving over time
- Mobile app — the globe experience on a phone could be incredible
- More crisis zones — we want to cover every active humanitarian emergency, not just 12
Crisis Zones Covered
| Zone | Category | Severity |
|---|---|---|
| Gaza Strip, Palestine | Conflict | 🔴 Critical |
| Darfur, Sudan | Conflict | 🔴 Critical |
| Kandahar, Afghanistan | Displacement | 🔴 Critical |
| Sana'a, Yemen | Conflict | 🔴 Critical |
| Southern Somalia | Famine | 🟠 High |
| Cox's Bazar, Bangladesh | Displacement | 🟠 High |
| Idlib, Syria | Conflict | 🟠 High |
| Tigray, Ethiopia | Famine | 🟠 High |
| Kashmir Valley | Displacement | 🟡 Medium |
| Sindh, Pakistan | Flood | 🟡 Medium |
| Mosul, Iraq | Displacement | 🟢 Recovering |
Built in 36 hours at MSA Hacks 2026
Team: Arshan Shareef · Humayl Khan
May your wealth be purified and your impact be seen. آمين

Log in or sign up for Devpost to join the conversation.