-
-
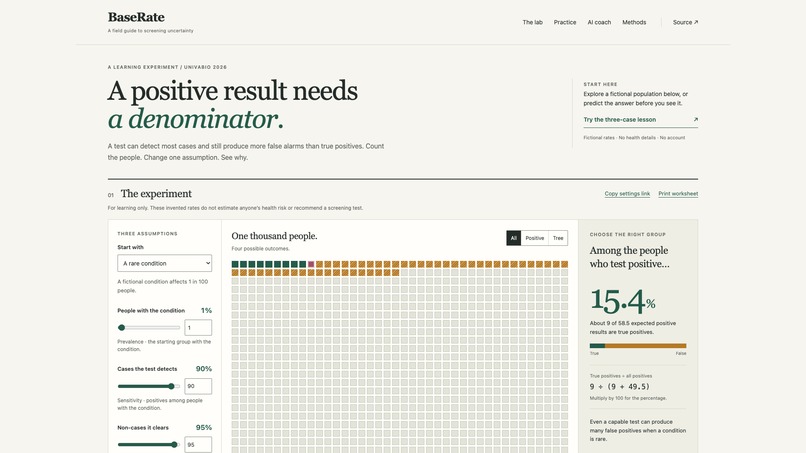
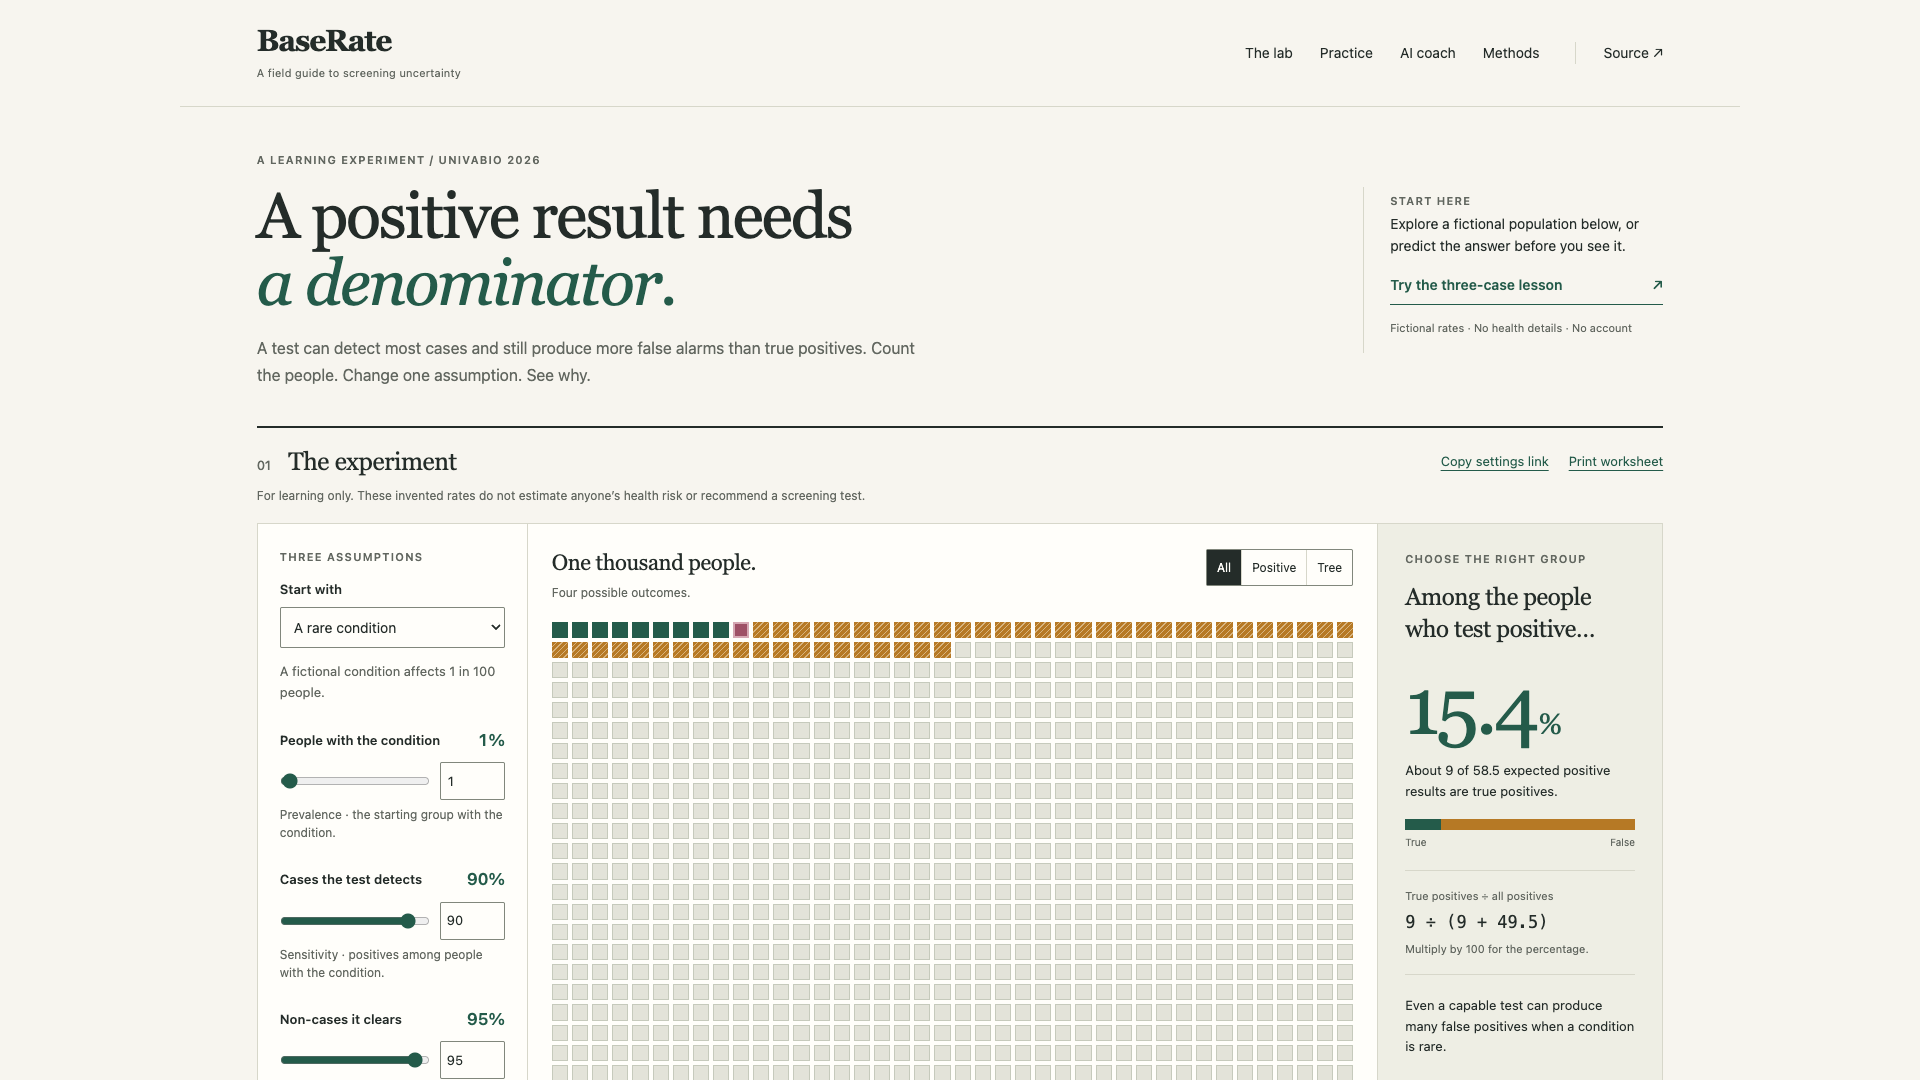
Upgraded field notebook UI: numeric controls, population patterns and an explicit positive-group denominator.
-
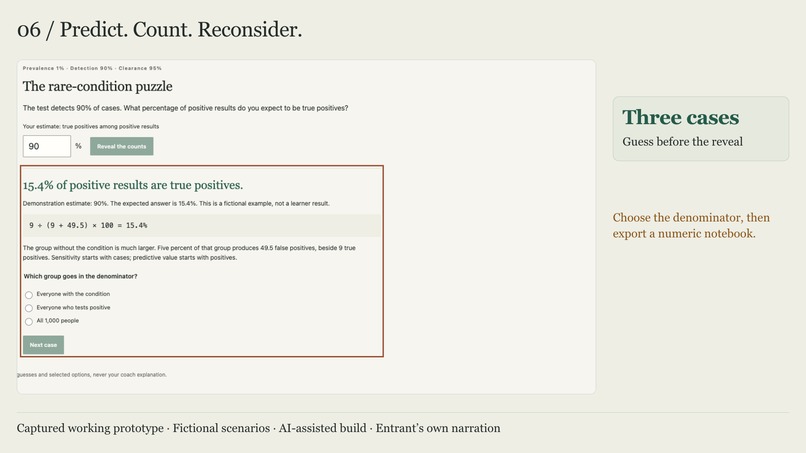
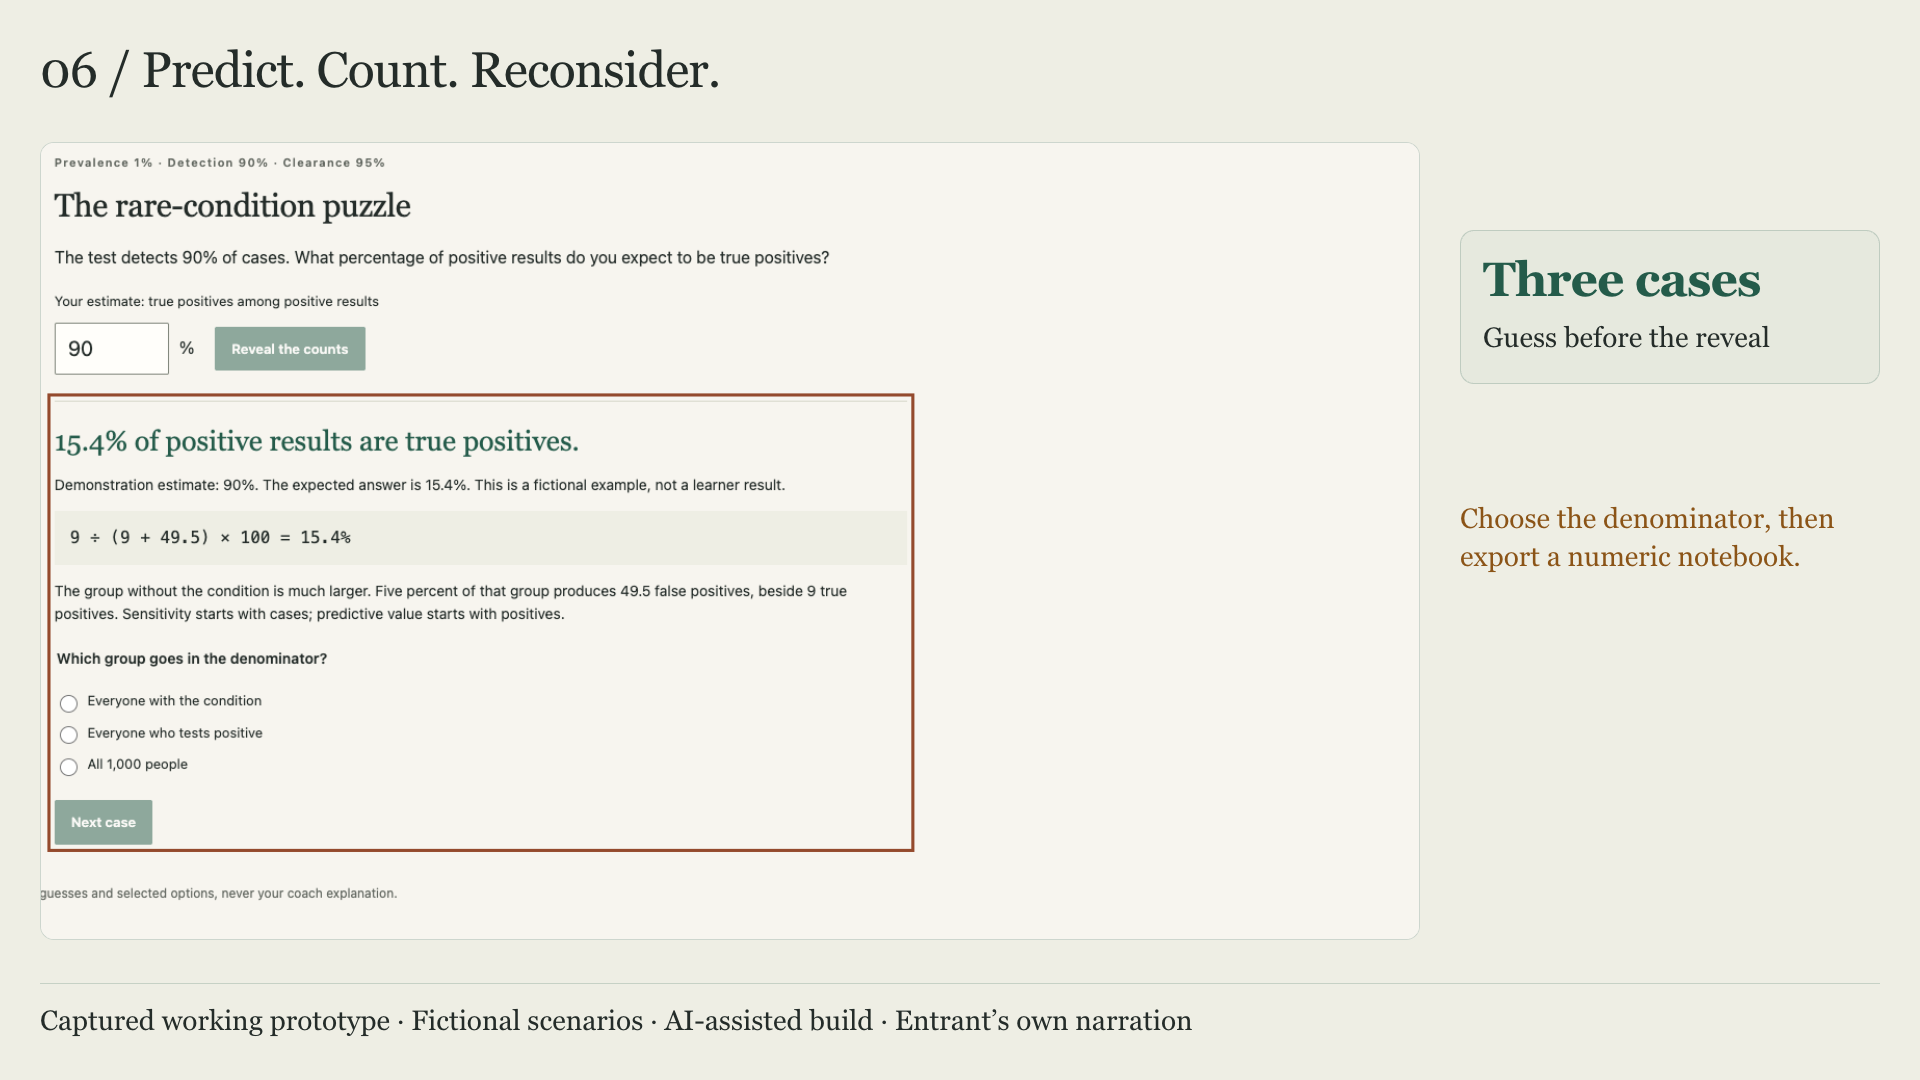
Predict, reveal and choose the denominator. This screenshot uses a labelled fictional demonstration estimate.
-
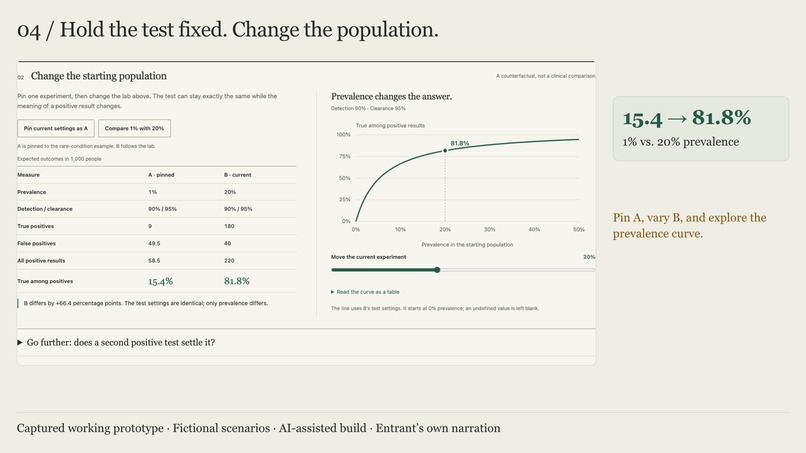
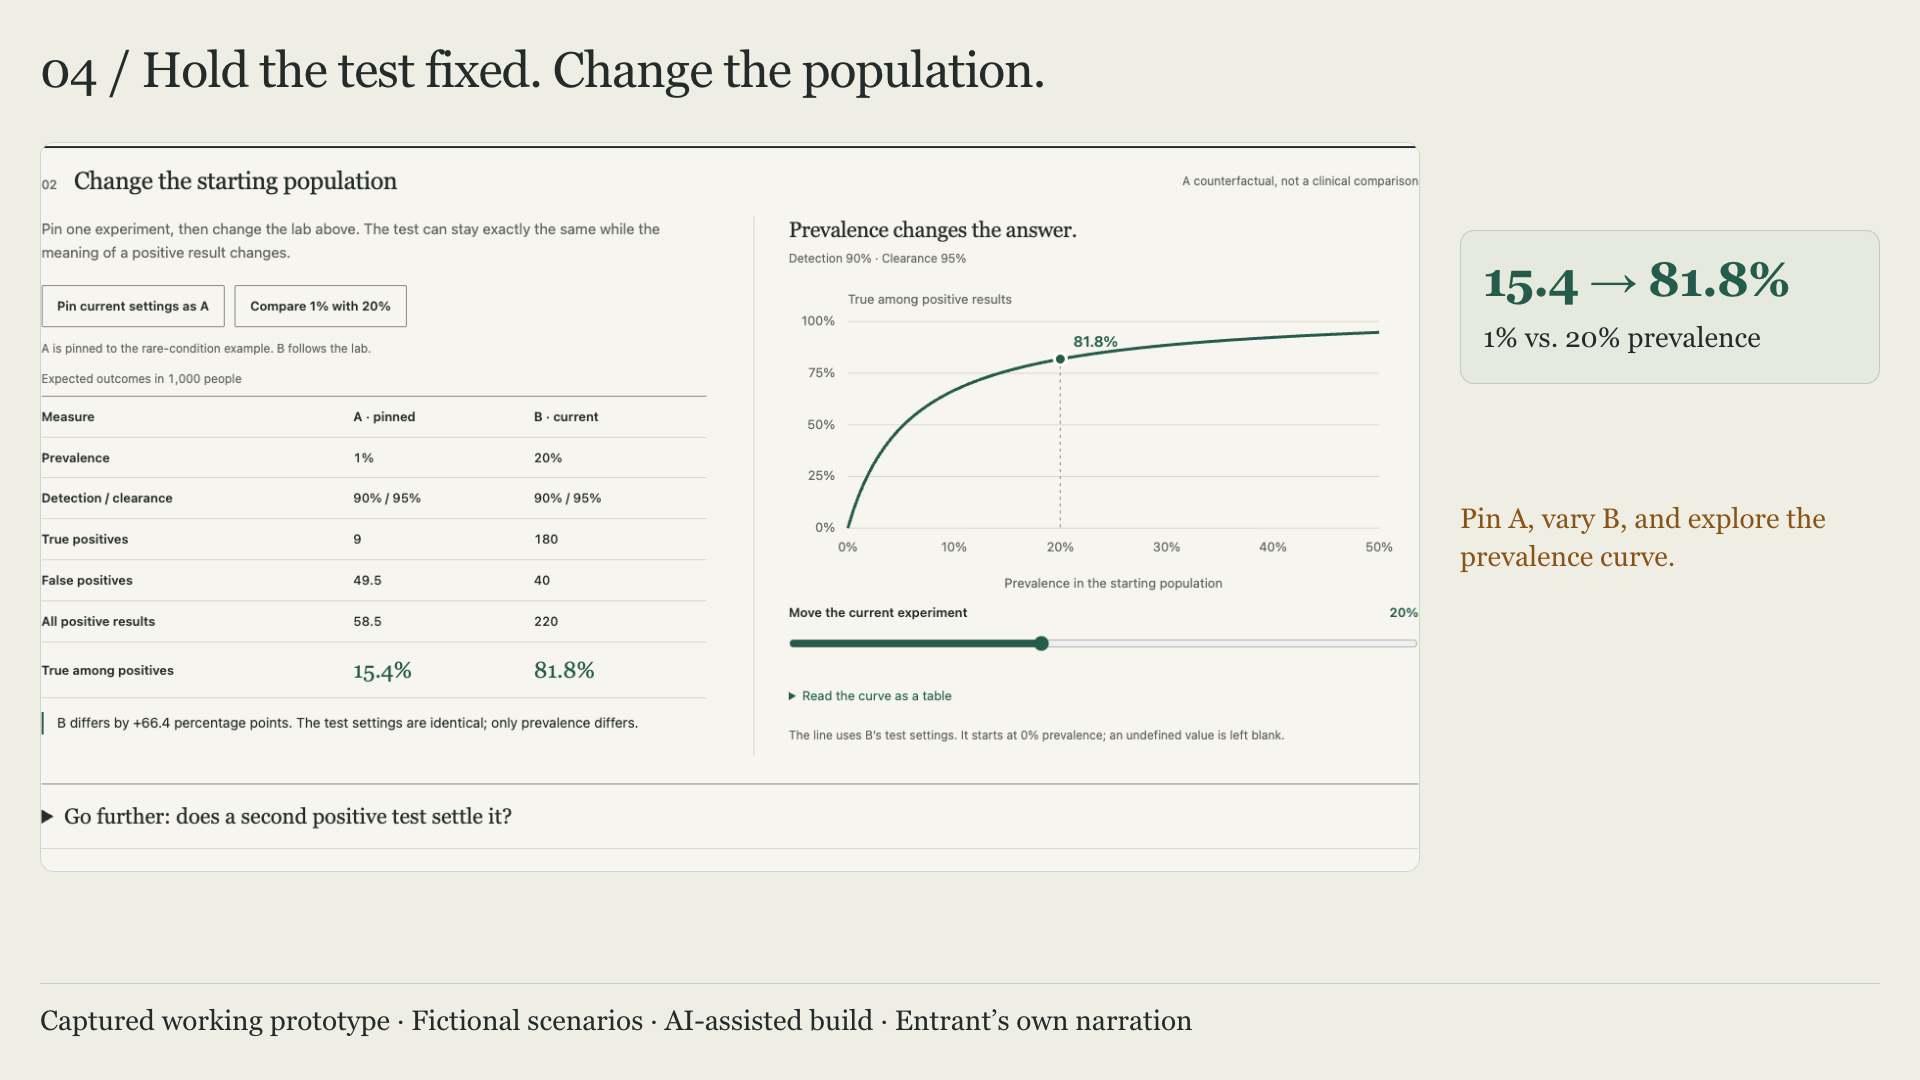
Pin A and vary B: the same 90%/95% test gives 15.4% vs 81.8% PPV when prevalence changes from 1% to 20%.
-
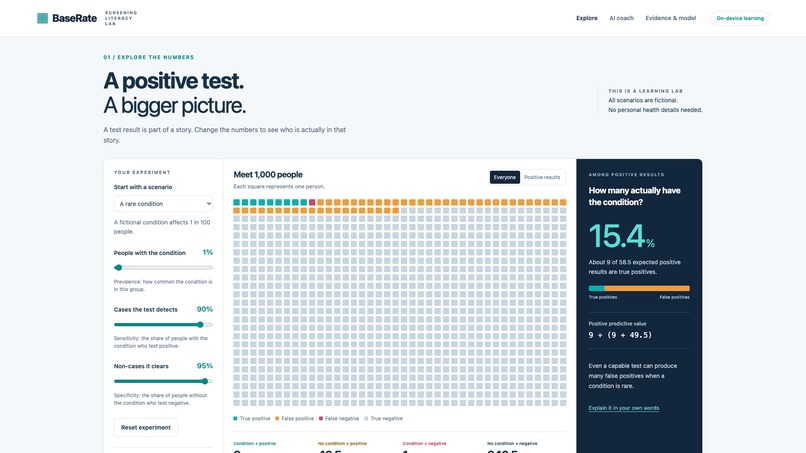
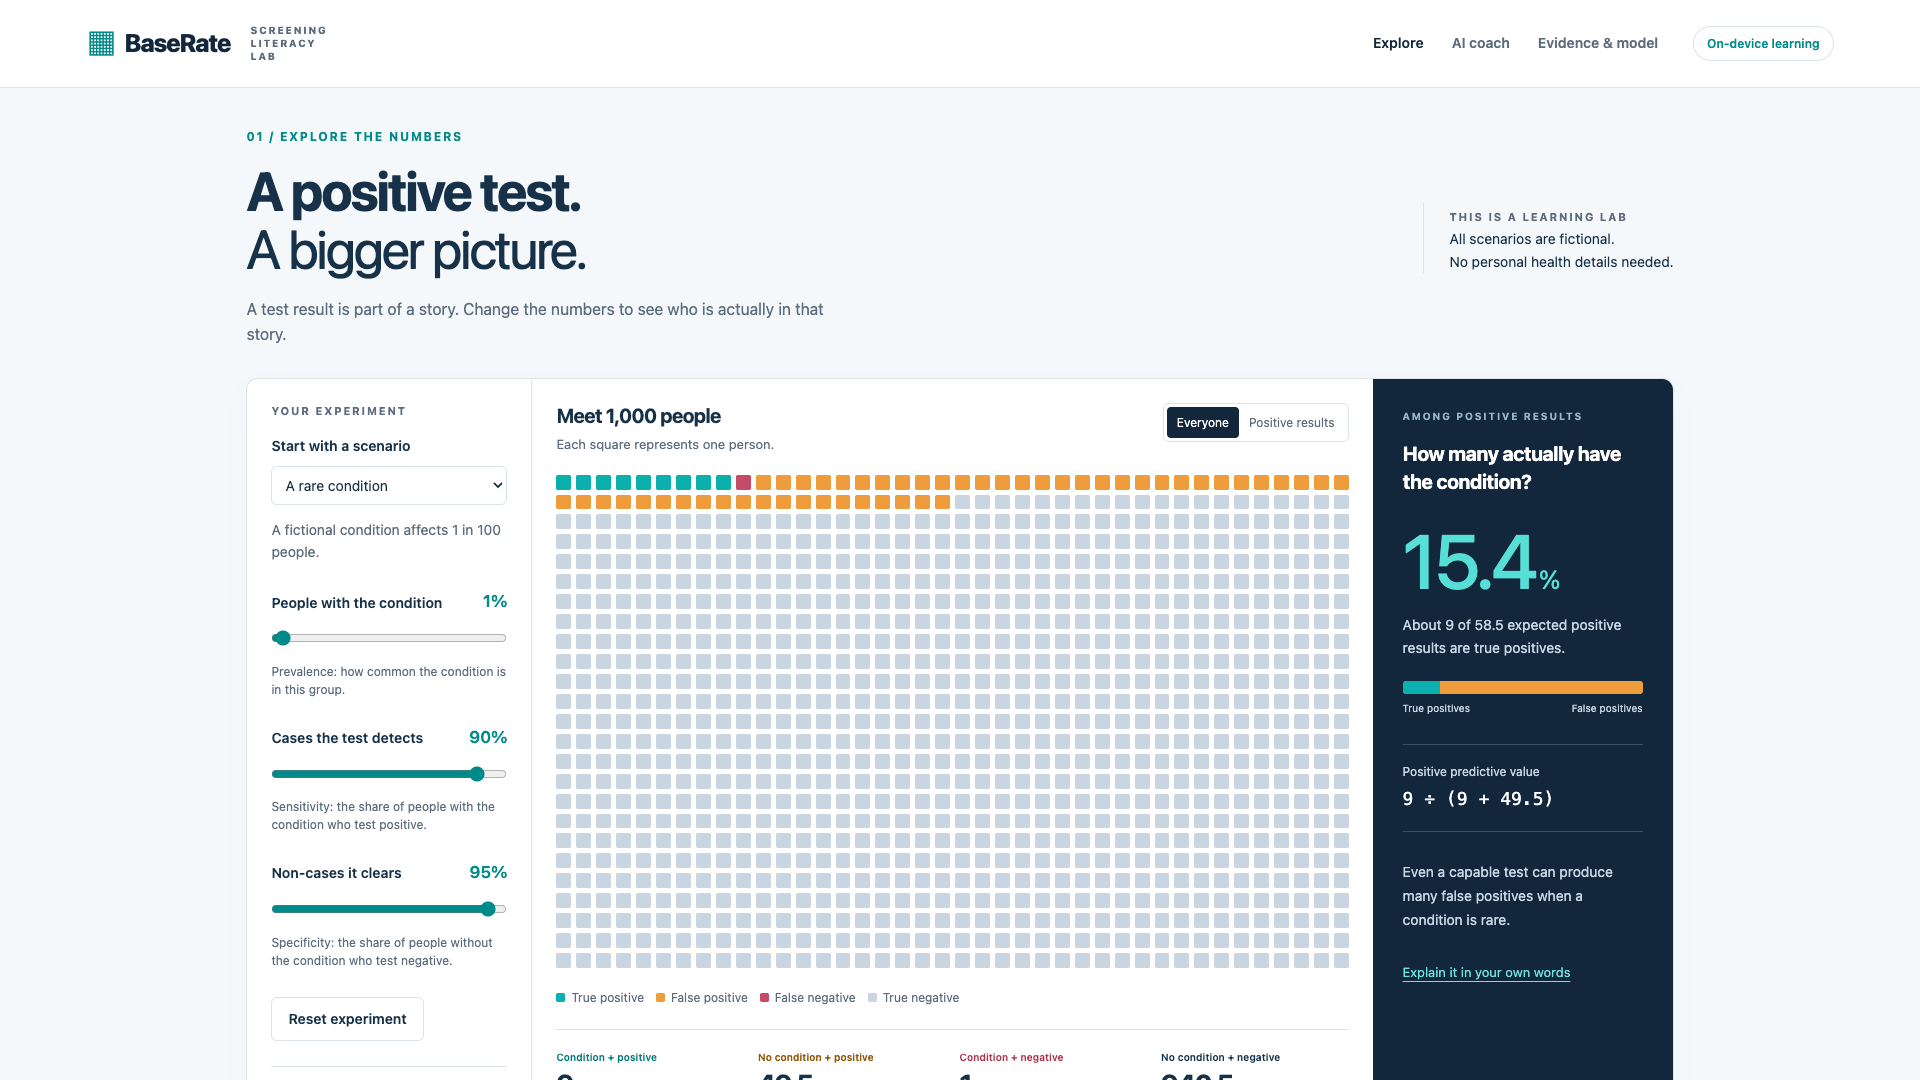
Earlier development prototype, retained to document the progression.
-
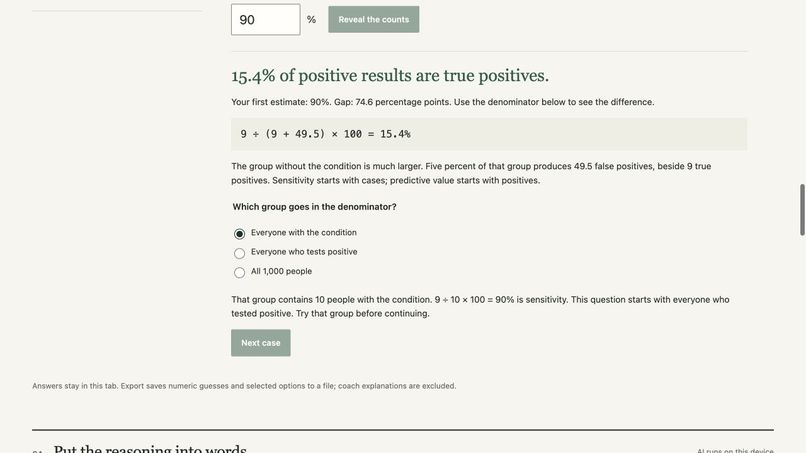
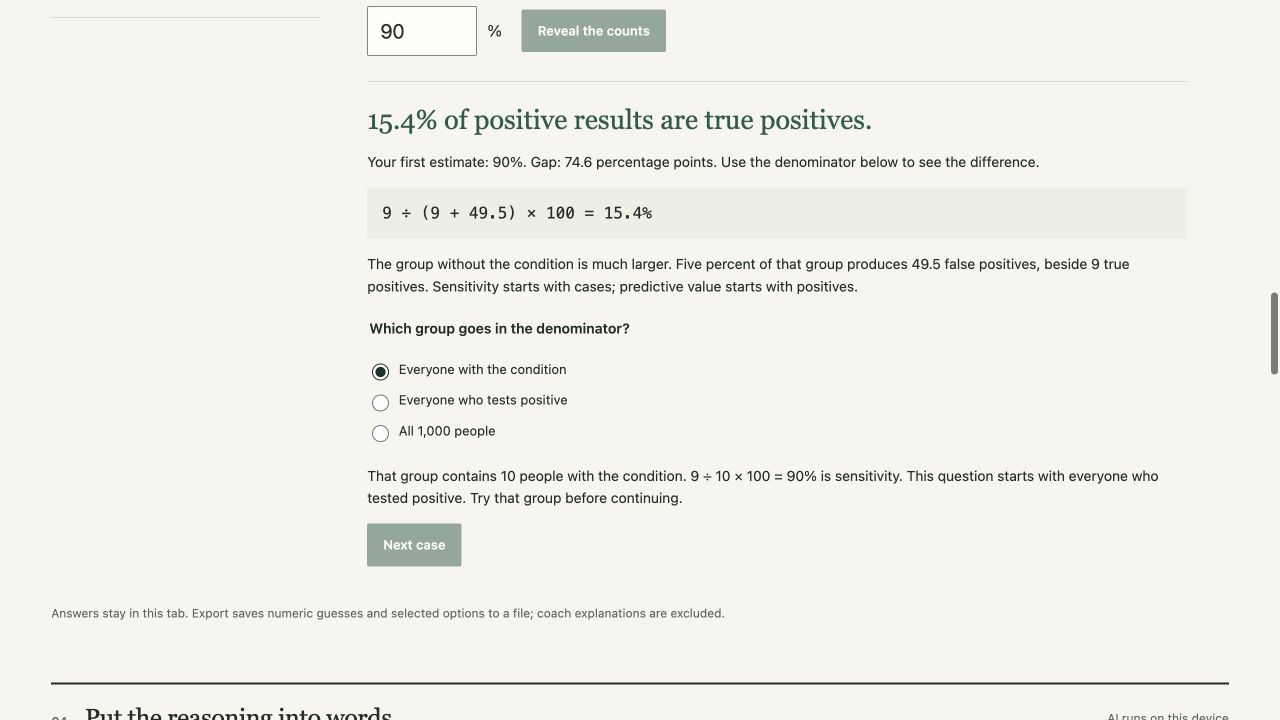
Staged 90% estimate: the wrong condition-group denominator gives sensitivity. Correction is required before the next case.
-
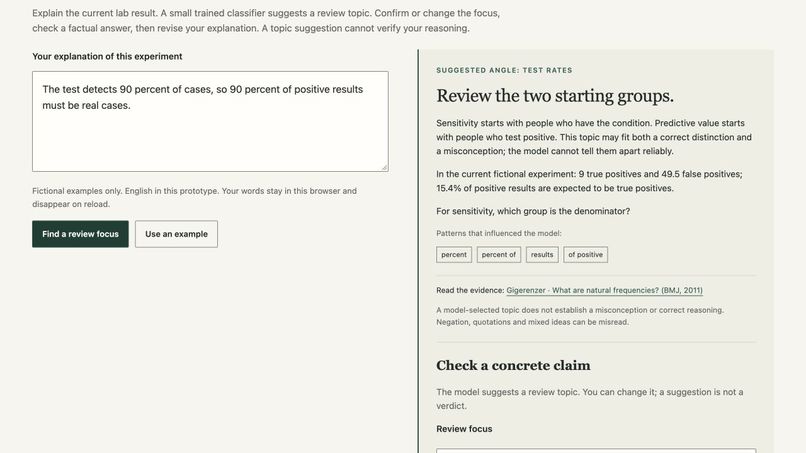
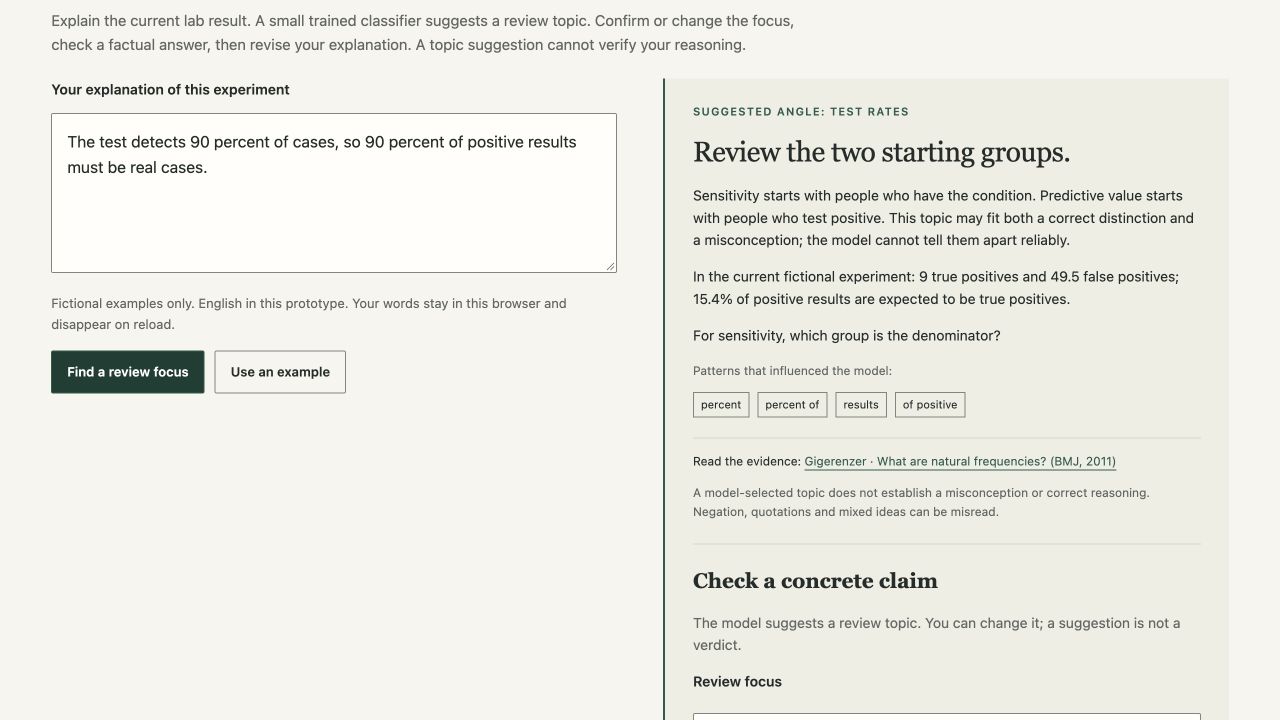
Final coach: a provisional review topic, current counts and a separate factual check. A topic suggestion cannot verify an explanation.
-
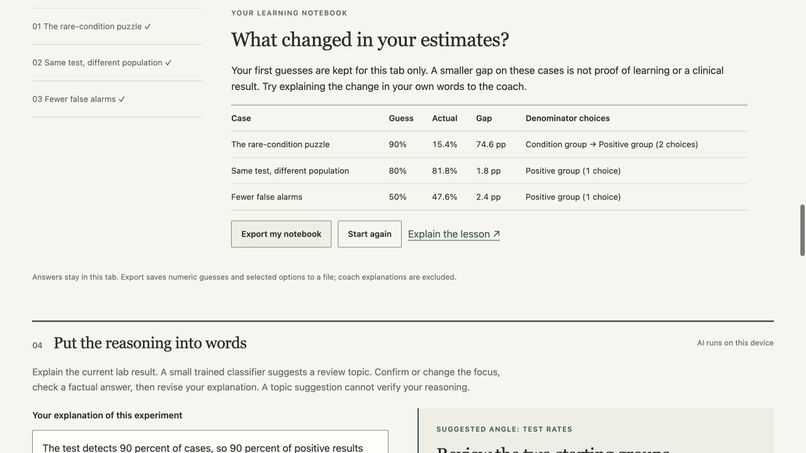
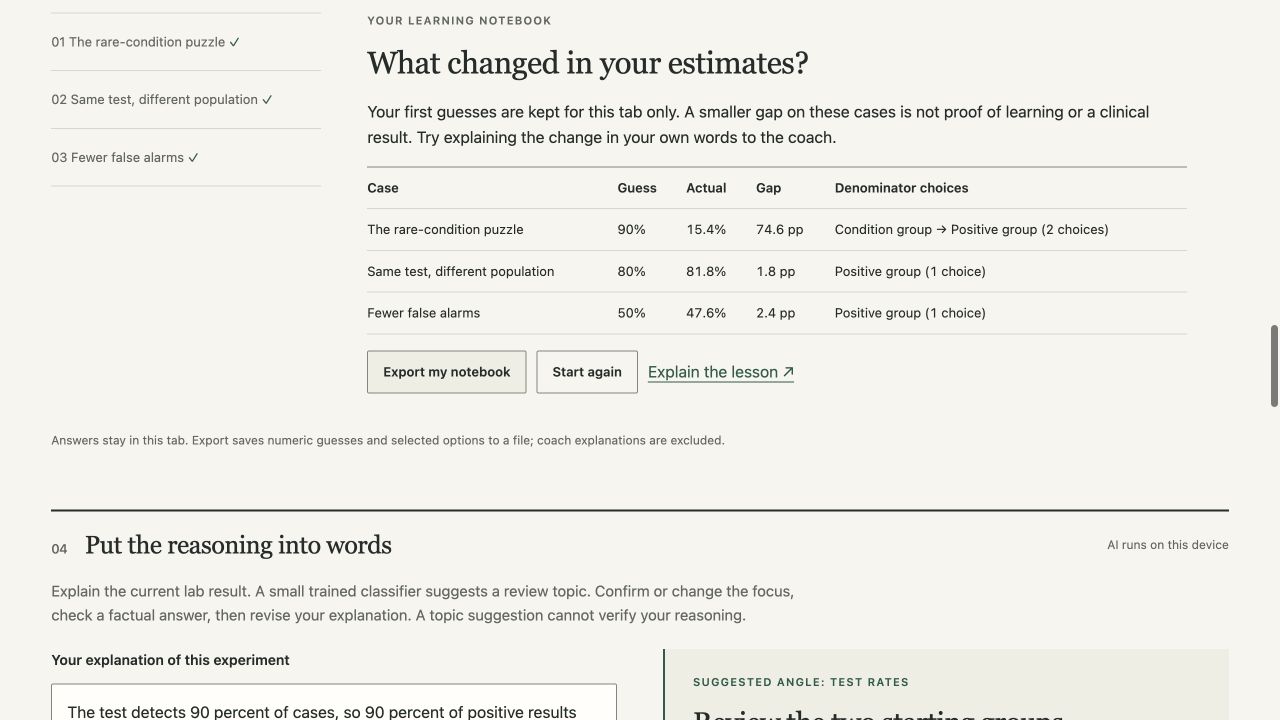
Completed demonstration notebook: first guesses 90%, 80%, 50% and first/final denominator choices. These are not learner-study results.
-
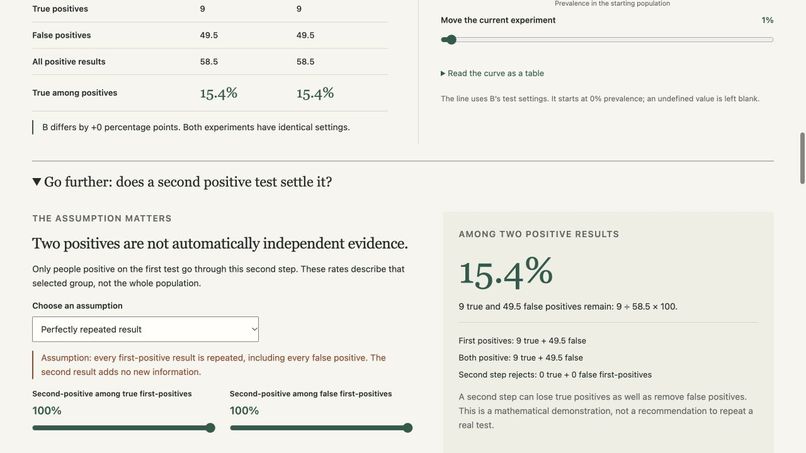
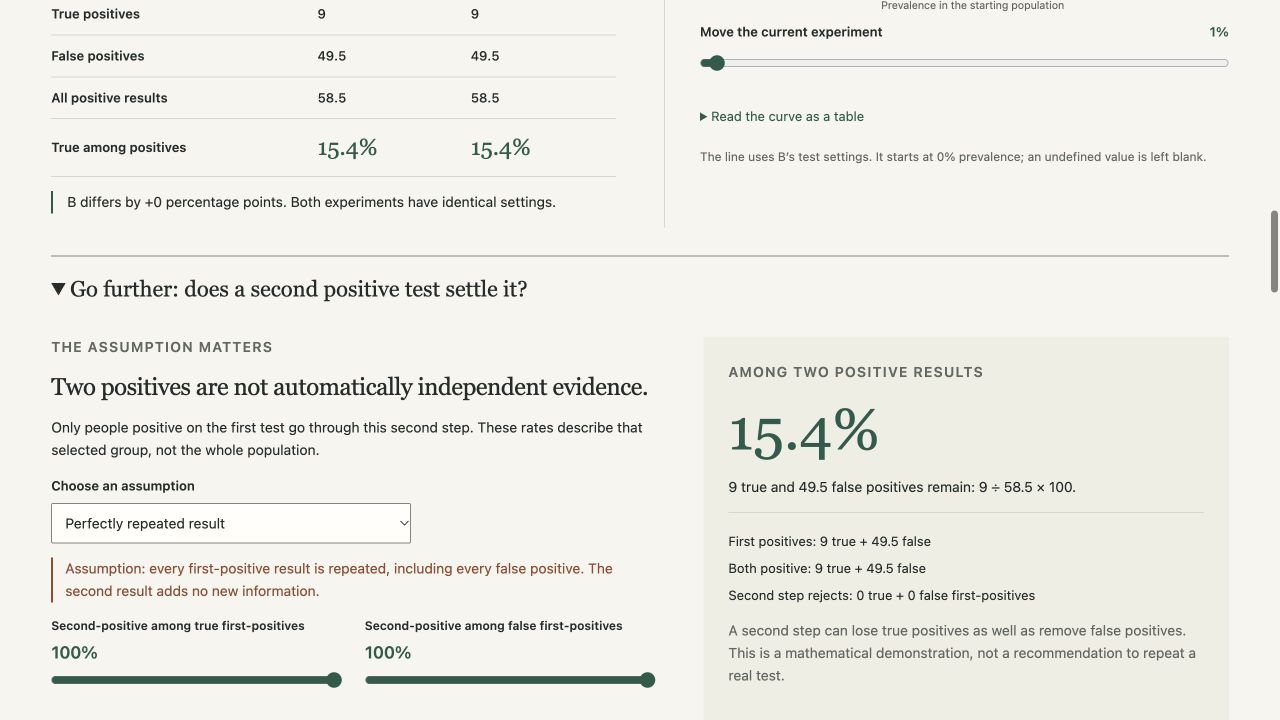
Perfectly repeated positives include every false positive and add no information. The explicit assumption leaves PPV at 15.4%.
Inspiration
A test that detects 90% of cases can still produce a positive group in which most results are false positives. The denominator explains the apparent contradiction. BaseRate turns that distinction into a learning experiment: predict, count, change an assumption and explain it back.
The audience is students, health-literacy learners and educators. The intended contribution to human health is understanding screening uncertainty. The project does not diagnose or estimate personal risk. Natural-frequency research informed its representations, and the National Cancer Institute informs its screening context. These sources do not validate this prototype.
What it does
The working lab connects several views of the same fictional population. Change prevalence, sensitivity and specificity with sliders or numeric inputs. A 1,000-person grid, positive-group focus, frequency tree, four expected outcome counts and PPV equation update together. Only the squares are rounded.
Pin experiment A and vary B to compare the positive groups. A prevalence curve, with an equivalent table, shows why the same test changes meaning across populations. In the default case, 1% prevalence, 90% sensitivity and 95% specificity give 9 true positives and 49.5 false positives: 9/58.5 = 15.4%. At 20% prevalence, the unchanged test gives 81.8%.
The second-test explorer applies explicit conditional rates only to first-positive people. Independent identical tests yield 76.6% in the default fictional example. A perfectly repeated result leaves PPV unchanged. The assumptions are visible so the tool does not imply that two positives automatically provide independent evidence.
A three-case lesson asks for an estimate before revealing counts, then asks which group belongs in the denominator. Wrong choices receive the actual ratio for their chosen reference group and require correction before progression. First numeric guesses and first/final denominator choices stay in tab memory; learners can export a numeric notebook. A demonstration estimate is explicitly labelled as an example, not learner-study data.
The AI coach reads an explanation locally and proposes a provisional review topic. Learners can override it, answer one of five factual checks using current counts or an evidence distinction, and revise their explanation. Feedback checks only the selected answer; it does not declare an inferred misconception or endorse the explanation. Learners can inspect influential words, feature coverage, label alternatives and uncalibrated model votes, then follow a relevant practice link. The coach suggests an interpretation rather than grading competence.
How it was built
A static HTML/CSS/JavaScript app runs without dependencies, accounts or API keys. Pure arithmetic and learning modules feed separate interface controllers. A dependency-free Python trainer learns a Multinomial Naive Bayes classifier from 100 synthetic English explanations. Word and adjacent-word features distinguish contextual reasoning and four common misconception patterns.
Inference stays in the browser. Coverage and vote separation can trigger uncertainty; personal-health queries are redirected away from the fictional experiment. The app has no analytics or remote inference calls. Explanations stay in tab memory, without persistent app storage or server transmission; exports exclude them. Loading static app/model files and demo media still contacts GitHub Pages, which may retain ordinary request logs. Connected browser assistants have separate data handling.
The interface uses a restrained field-notebook style, clear hierarchy, readable labels, patterned outcomes and keyboard controls. Essential explanations stay visible; advanced assumptions and model details use progressive disclosure. The refreshed 109.4-second demo uses the entrant's supplied narration with one repetitive clause removed over actual final-application screen-state captures, with edited holds and cuts. It shows the local coach, staged prediction, correction, notebook export, pinned comparison and explicit repeat-test assumptions. The estimates are demonstration data, not a learner study; this is not a continuous screen recording. Watch the final demo and access the deliverables.
Challenges and what was learned
Exact expectations can be fractional while the grid must contain exactly 1,000 squares. Largest-remainder rounding keeps that illustration consistent; calculations, comparisons and practice answers retain raw values. Adaptive display precision preserves tiny nonzero denominators.
Repeated testing exposed a second conceptual trap: multiplying test rates without explaining dependence. The conditional explorer makes the selected population and assumption explicit, including a repeat that adds no information.
A small text model can sound overly certain or misread a correct explanation. The app exposes uncertainty and failure modes. One holdout sentence correctly distinguishing sensitivity from predictive value was misread as confusion. The project retains the known error and complete evaluation instead of moving the sentence into training. A 24-case development stress audit also exposed correct, ambiguous and mixed explanations with high but incorrect votes. Among ten flawed/mixed probes, the previous wording praised two; provisional feedback now praises zero. All classifications remain unchanged, so this is a measured feedback-policy correction, not improved classifier accuracy.
Validation
Five reproducible test suites and a deterministic model audit pass. They cover 336 base arithmetic/rounding combinations, 2,525 prevalence-curve points, 405 conditional repeat-test combinations, all lesson equations, immutable snapshots, invalid inputs, zero denominators, tiny-count display, exports excluding learner text and missing-model feedback. All 30 holdout examples match between Python and browser inference.
Browser checks verified comparison pinning, independent/repeated presets, three-case progression and restart, numeric-input errors and recovery, validated settings links, local model diagnostics and the actual app at 390 pixels without horizontal overflow. A separate code review was completed and its display/recovery findings corrected.
The synthetic holdout from the same project produced 29/30 correct raw classifications. Uncertainty checks accepted 28 labels, 27 correct. These are development checks, not a benchmark, clinical accuracy claim, evidence of learning gain or health outcome. No independent learner study or clinical validation has been completed. No exact split duplicates were found; shared authorship and claim types limit semantic independence. The reproducible audit, full model card and entrant code walkthrough are in the repository.
What's next
Independent learner explanations, health-educator review, accessibility testing with users, evaluated multilingual support and a properly designed comprehension study. These are proposed validation steps, not completed outcomes.

Log in or sign up for Devpost to join the conversation.