Here is the project pitch structured for the sections you provided, based on the "Baseline Tool - Time Series Anomaly Detection" description.
Inspiration Our inspiration stemmed from the need for a simple, robust, and easily deployable solution for monitoring real-world time series data. Existing enterprise-level anomaly detection tools are often overly complex or require expensive licenses. We realized that for the vast majority of IoT, manufacturing, and web data monitoring scenarios, a statistically sound, lightweight, and fast Python toolkit based on established methods like moving averages and standard deviation would be invaluable. We aimed to democratize access to core time series analysis capabilities.
What it does The Baseline Tool is a Python-based time series analysis toolkit designed specifically for anomaly and trend detection in numerical data. It automatically establishes a "normal" baseline for a given sequence of values and then flags any data point that deviates significantly from that established norm.
Key Functions:
Baseline Calculation: Computes a smooth, configurable moving average baseline to represent the underlying trend.
Outlier Detection: Identifies anomalies using configurable standard deviation thresholds (e.g., 2σ or 3σ) around the baseline.
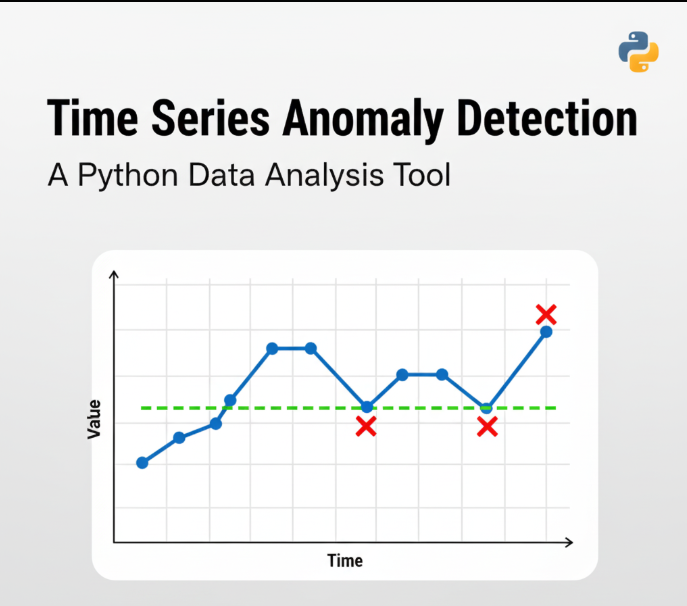
Visualization: Generates professional plots showing the raw data, the calculated baseline, and highlighted outliers, making complex data interpretation immediate and clear.
Batch Processing: Includes a Command-Line Interface (CLI) for efficient batch processing of data from CSV or JSON files.
How we built it The tool was built entirely in Python to leverage its rich data science ecosystem.
Core Logic: We used NumPy for high-performance numerical operations, which is crucial for efficient moving average and standard deviation calculations across large datasets.
Data Structure: Pandas was integrated to handle flexible input (lists, arrays, series) and provide robust data manipulation capabilities, ensuring the tool is compatible with most data pipelines.
Visualization: We utilized Matplotlib to create the clean, professional, and customizable charts showing the data, the calculated baseline, and the red markers for outliers.
Structure and Testing: The entire package was designed with modularity in mind. We used pytest to develop a comprehensive suite of 15+ unit tests to ensure accuracy, especially in edge cases and outlier calculations. The project was version-controlled using Git and licensed under MIT for open-source adoption.
Challenges we ran into Window Size Optimization: Determining an optimal, non-fixed window size for the moving average that could smoothly track trends without being overly sensitive to noise was a significant challenge. We addressed this by making the window size a configurable parameter and providing clear documentation on how users can choose the best size for their specific dataset.
Edge Case Handling: Time series data often has missing values or starts abruptly. We spent time ensuring the moving average calculation gracefully handles the initial data points where the window isn't yet full, preventing inaccurate baseline establishment at the start of the series.
Performance with Large Datasets: Initial implementations were slow for very large datasets. We overcame this by ensuring all core statistical computations were vectorized using NumPy and Pandas functions, drastically improving performance.
Accomplishments that we're proud of Robust Accuracy: We are most proud of the accuracy and reliability of the outlier detection, validated through our extensive unit test suite covering various data patterns and noise levels.
Clear Visualization: Creating a visual output that is instantly understandable—clearly showing the baseline, the threshold, and the anomalies—was a major accomplishment, as it greatly enhances the utility of the tool for non-technical users.
Production Readiness: Developing a solution that is not just a prototype but a well-tested, fully documented, and production-ready Python library with a flexible CLI is something we take great pride in. The MIT license makes it immediately useful for the broader community.
What we learned We learned the critical importance of data smoothing techniques in time series analysis. A simple average can be misleading; a carefully chosen moving average window is essential for separating genuine trends from random noise. We also deepened our understanding of the trade-offs between calculation speed (using NumPy vectorization) and implementation complexity. Finally, we learned that clear, concise CLI documentation is just as important as the core code for an open-source tool.
What's next for Baseline Tool - Time Series Anomaly Detection Advanced Baselines: Integrate more sophisticated baseline techniques, such as Exponential Moving Average (EMA) and Seasonal Decomposition of Time Series (STL), to handle seasonal and long-term trends more effectively.
Alerting Integration: Develop wrappers or a small API to easily integrate anomaly alerts with common monitoring systems like Prometheus, Grafana, or PagerDuty.
Interactive Dashboards: Create a small, lightweight web interface (using tools like Streamlit or Dash) that allows users to upload a CSV, adjust the window size and threshold in real-time, and immediately view the resulting plot and detected anomalies.
Multi-Dimensional Analysis: Extend the tool's capability to detect anomalies across multiple correlated time series simultaneously.


Log in or sign up for Devpost to join the conversation.