-
-
owl
-
analysis
-
solana
-
camera
-
tigerdb
-
map
Inspiration
New York City has an estimated 3 million rats. The Health Department runs more than 150,000 rodent inspections a year, and it decides where to send them largely from 311 complaints. A complaint map is a map of who reports. Blocks where residents do not call, because of language barriers, distrust of the city, or tenants who have given up, appear clean on paper and are inspected less.
East Harlem and the West Village show the size of the gap. East Harlem has half the median income, three times the poverty rate, and one eighth the rat complaints. When inspectors actually sweep its blocks, they find up to 52% more rats. Citywide, 311 complaint rates between the loudest and quietest neighborhoods differ by 17.8×, while the rate at which proactive sweeps find rats differs by only 2.3×. Silence is not evidence of absence. 97% of the quietest areas received no proactive inspection in two years, so the city has the least ground truth exactly where reporting is weakest.
Night Owl is a rodent location predictor built for that blind spot, paired with low-cost sensors that supply the ground truth the complaint system cannot.
What it does
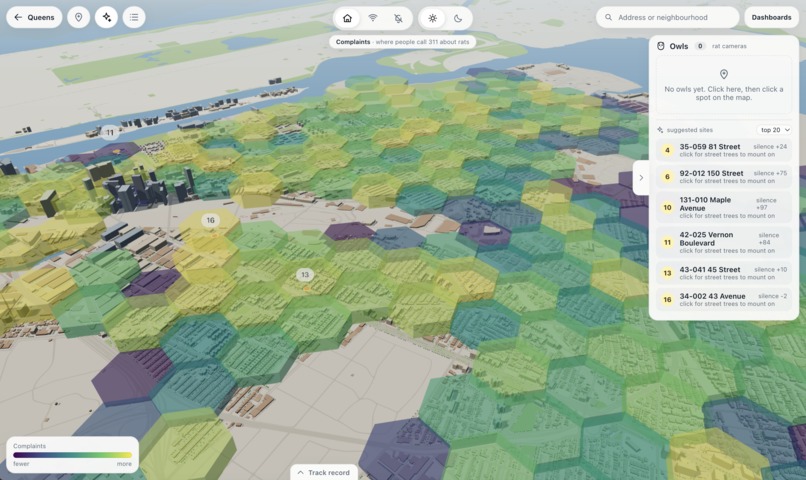
Night Owl identifies the silent blocks: cells where rats are probable but unreported.
- Model A, "what the city sees." A gradient-boosted model that predicts 311 rat complaints per block-scale cell, trained on 512,000 complaints and pest violations.
- Model B, "what is actually there." A gradient-boosted model that predicts the probability inspectors find rats, trained only on proactive block sweeps and 26 physical and environmental features from ten years of city open data: building age and height, restaurant density, refuse and containerization rules, construction permits, catch basins, street trees, and weather. It never sees a complaint.
- Silence Score. The gap between the two models. Each cell's Model B prediction and its per-resident Model A prediction are converted to citywide percentiles, and the score is the difference. A block scores high when inspectors would likely find rats but residents rarely report them.
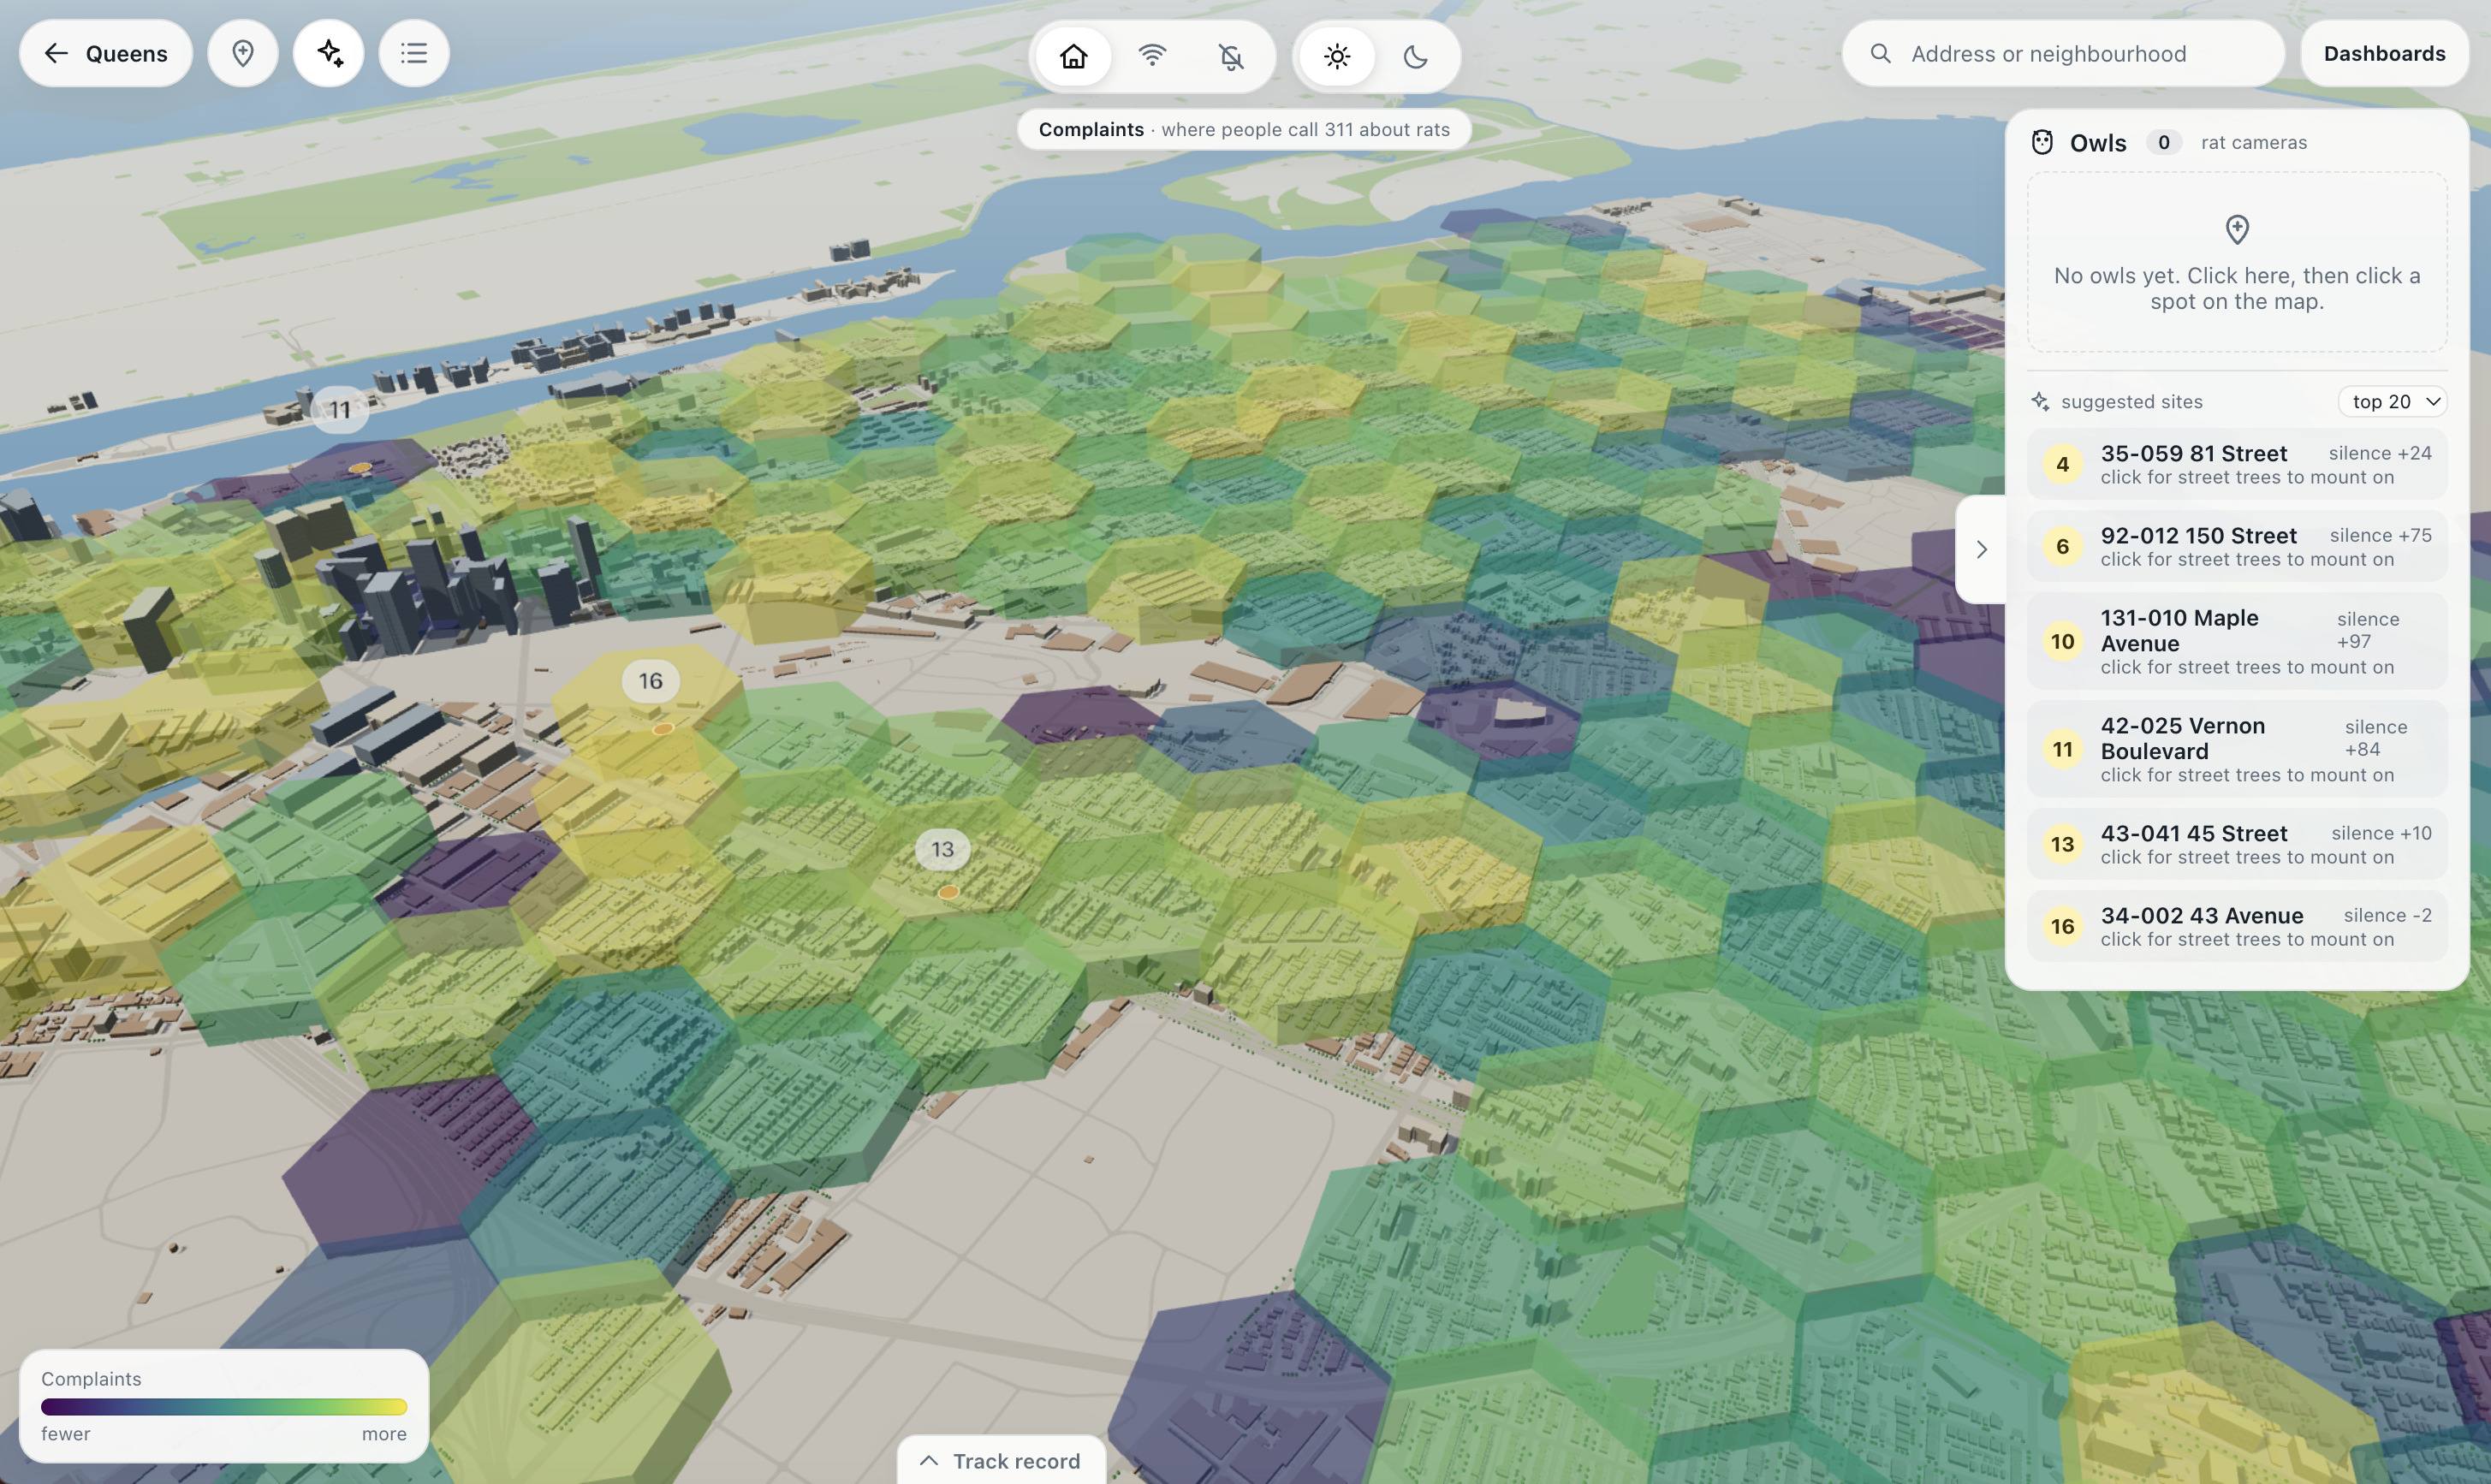
- Rankings and actions. Citywide hotspots, the five highest-priority buildings inside each silent block, and sensor sites resolved to a specific street tree.
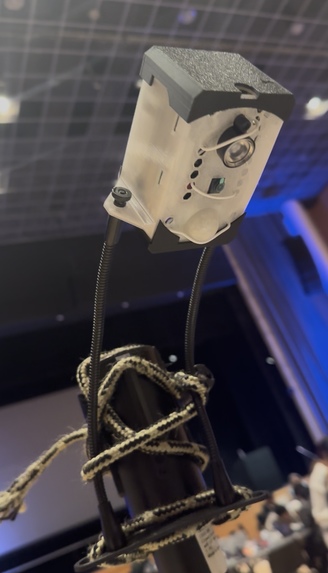
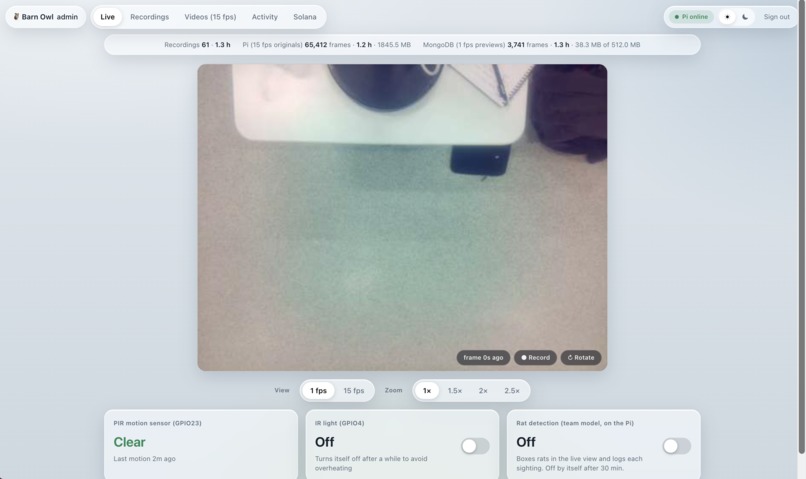
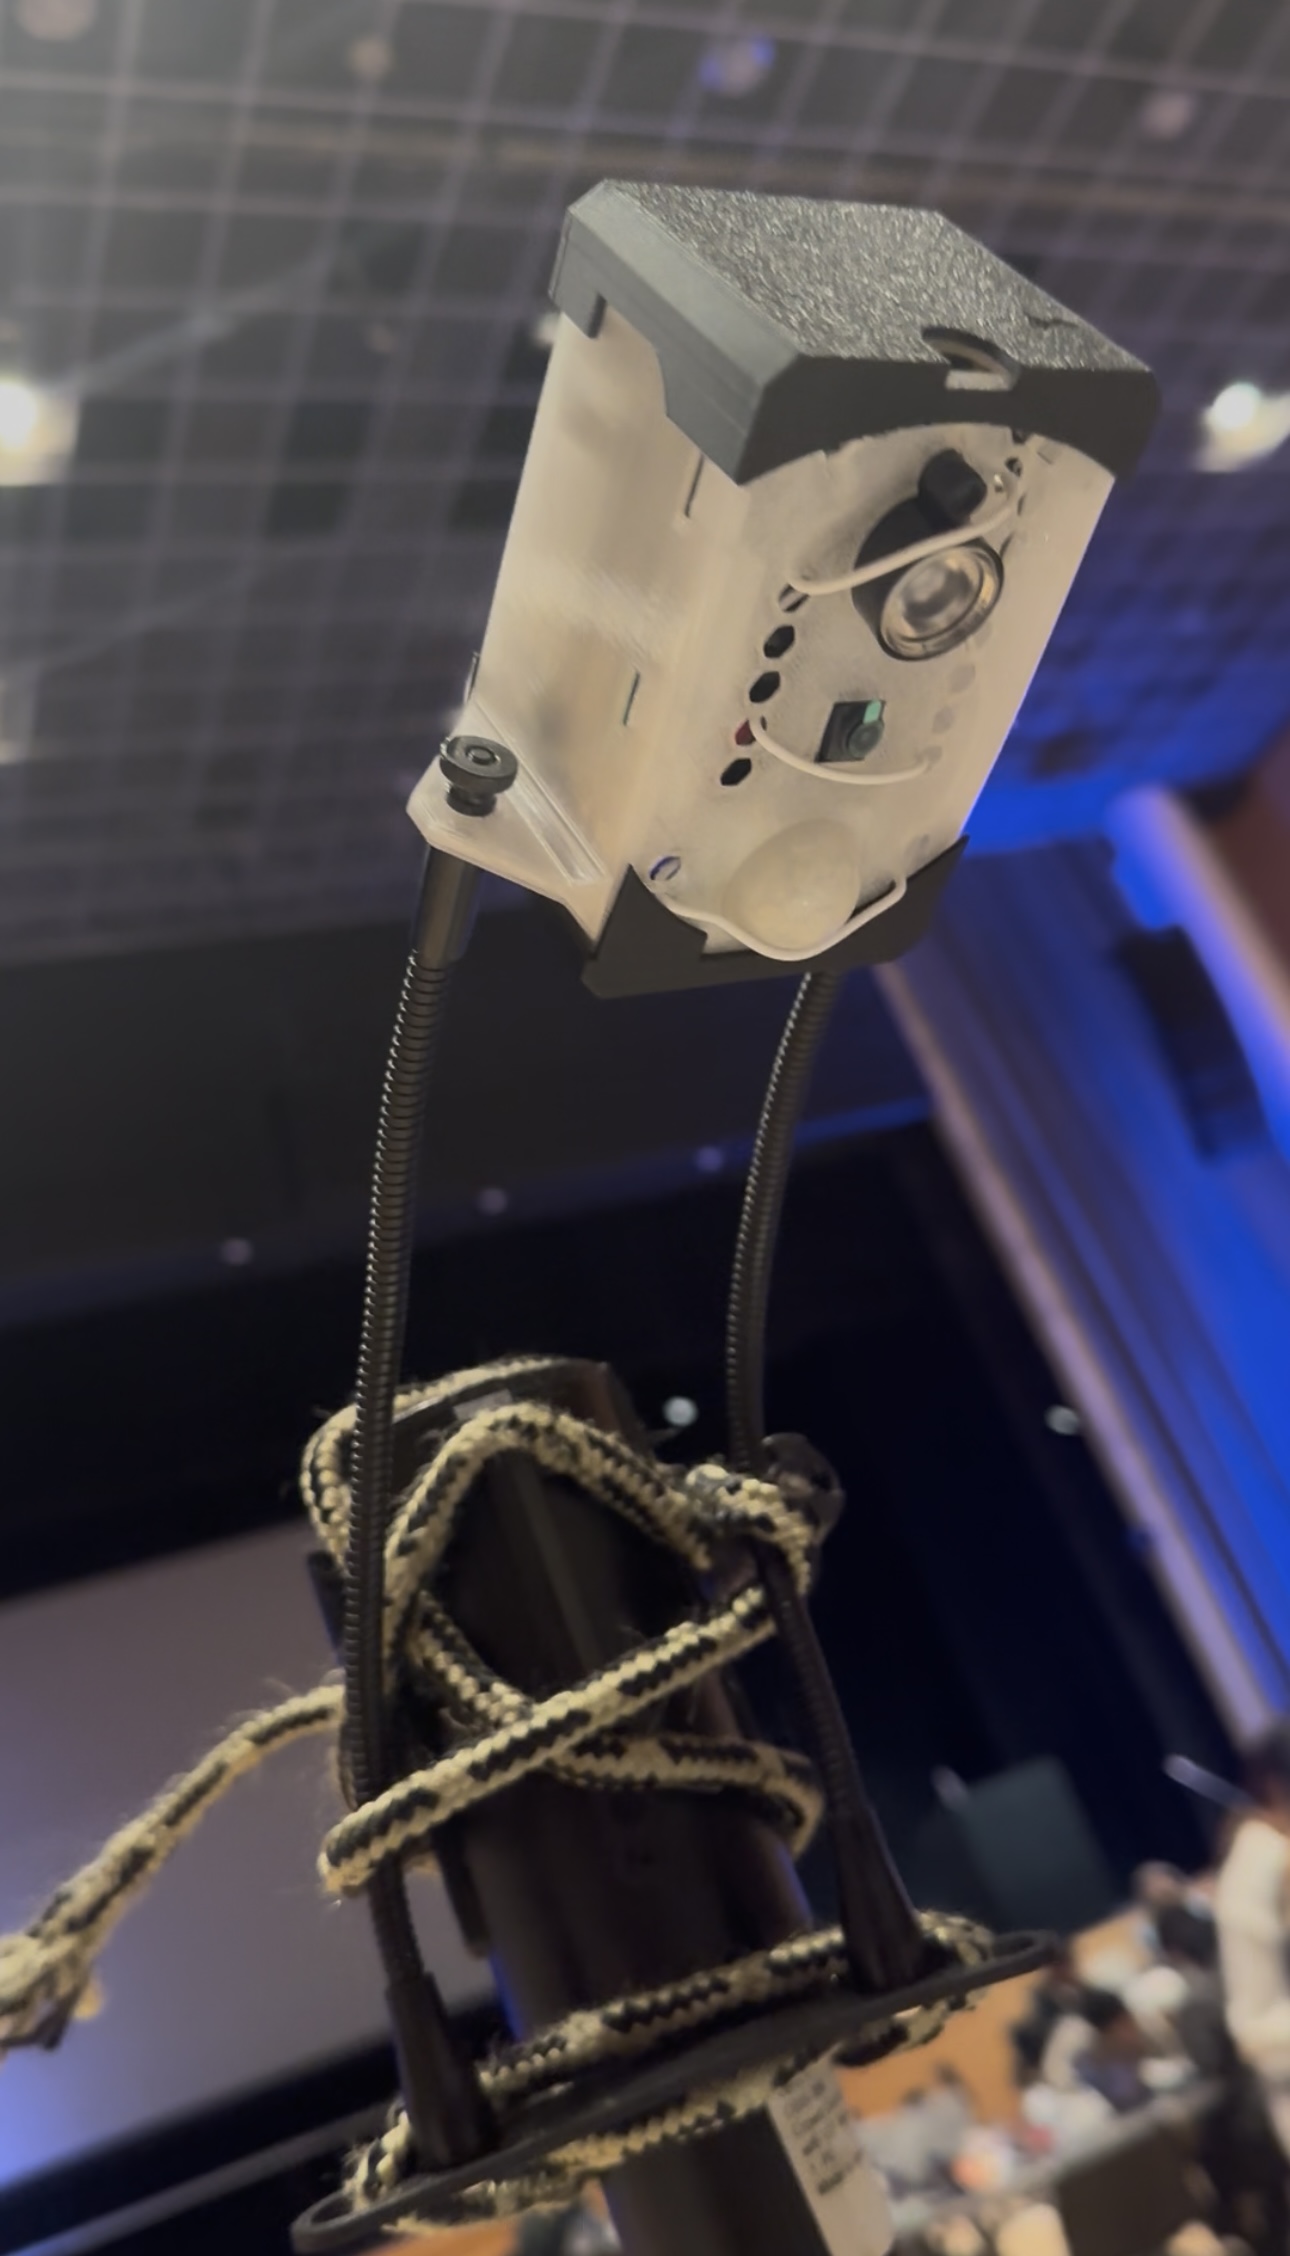
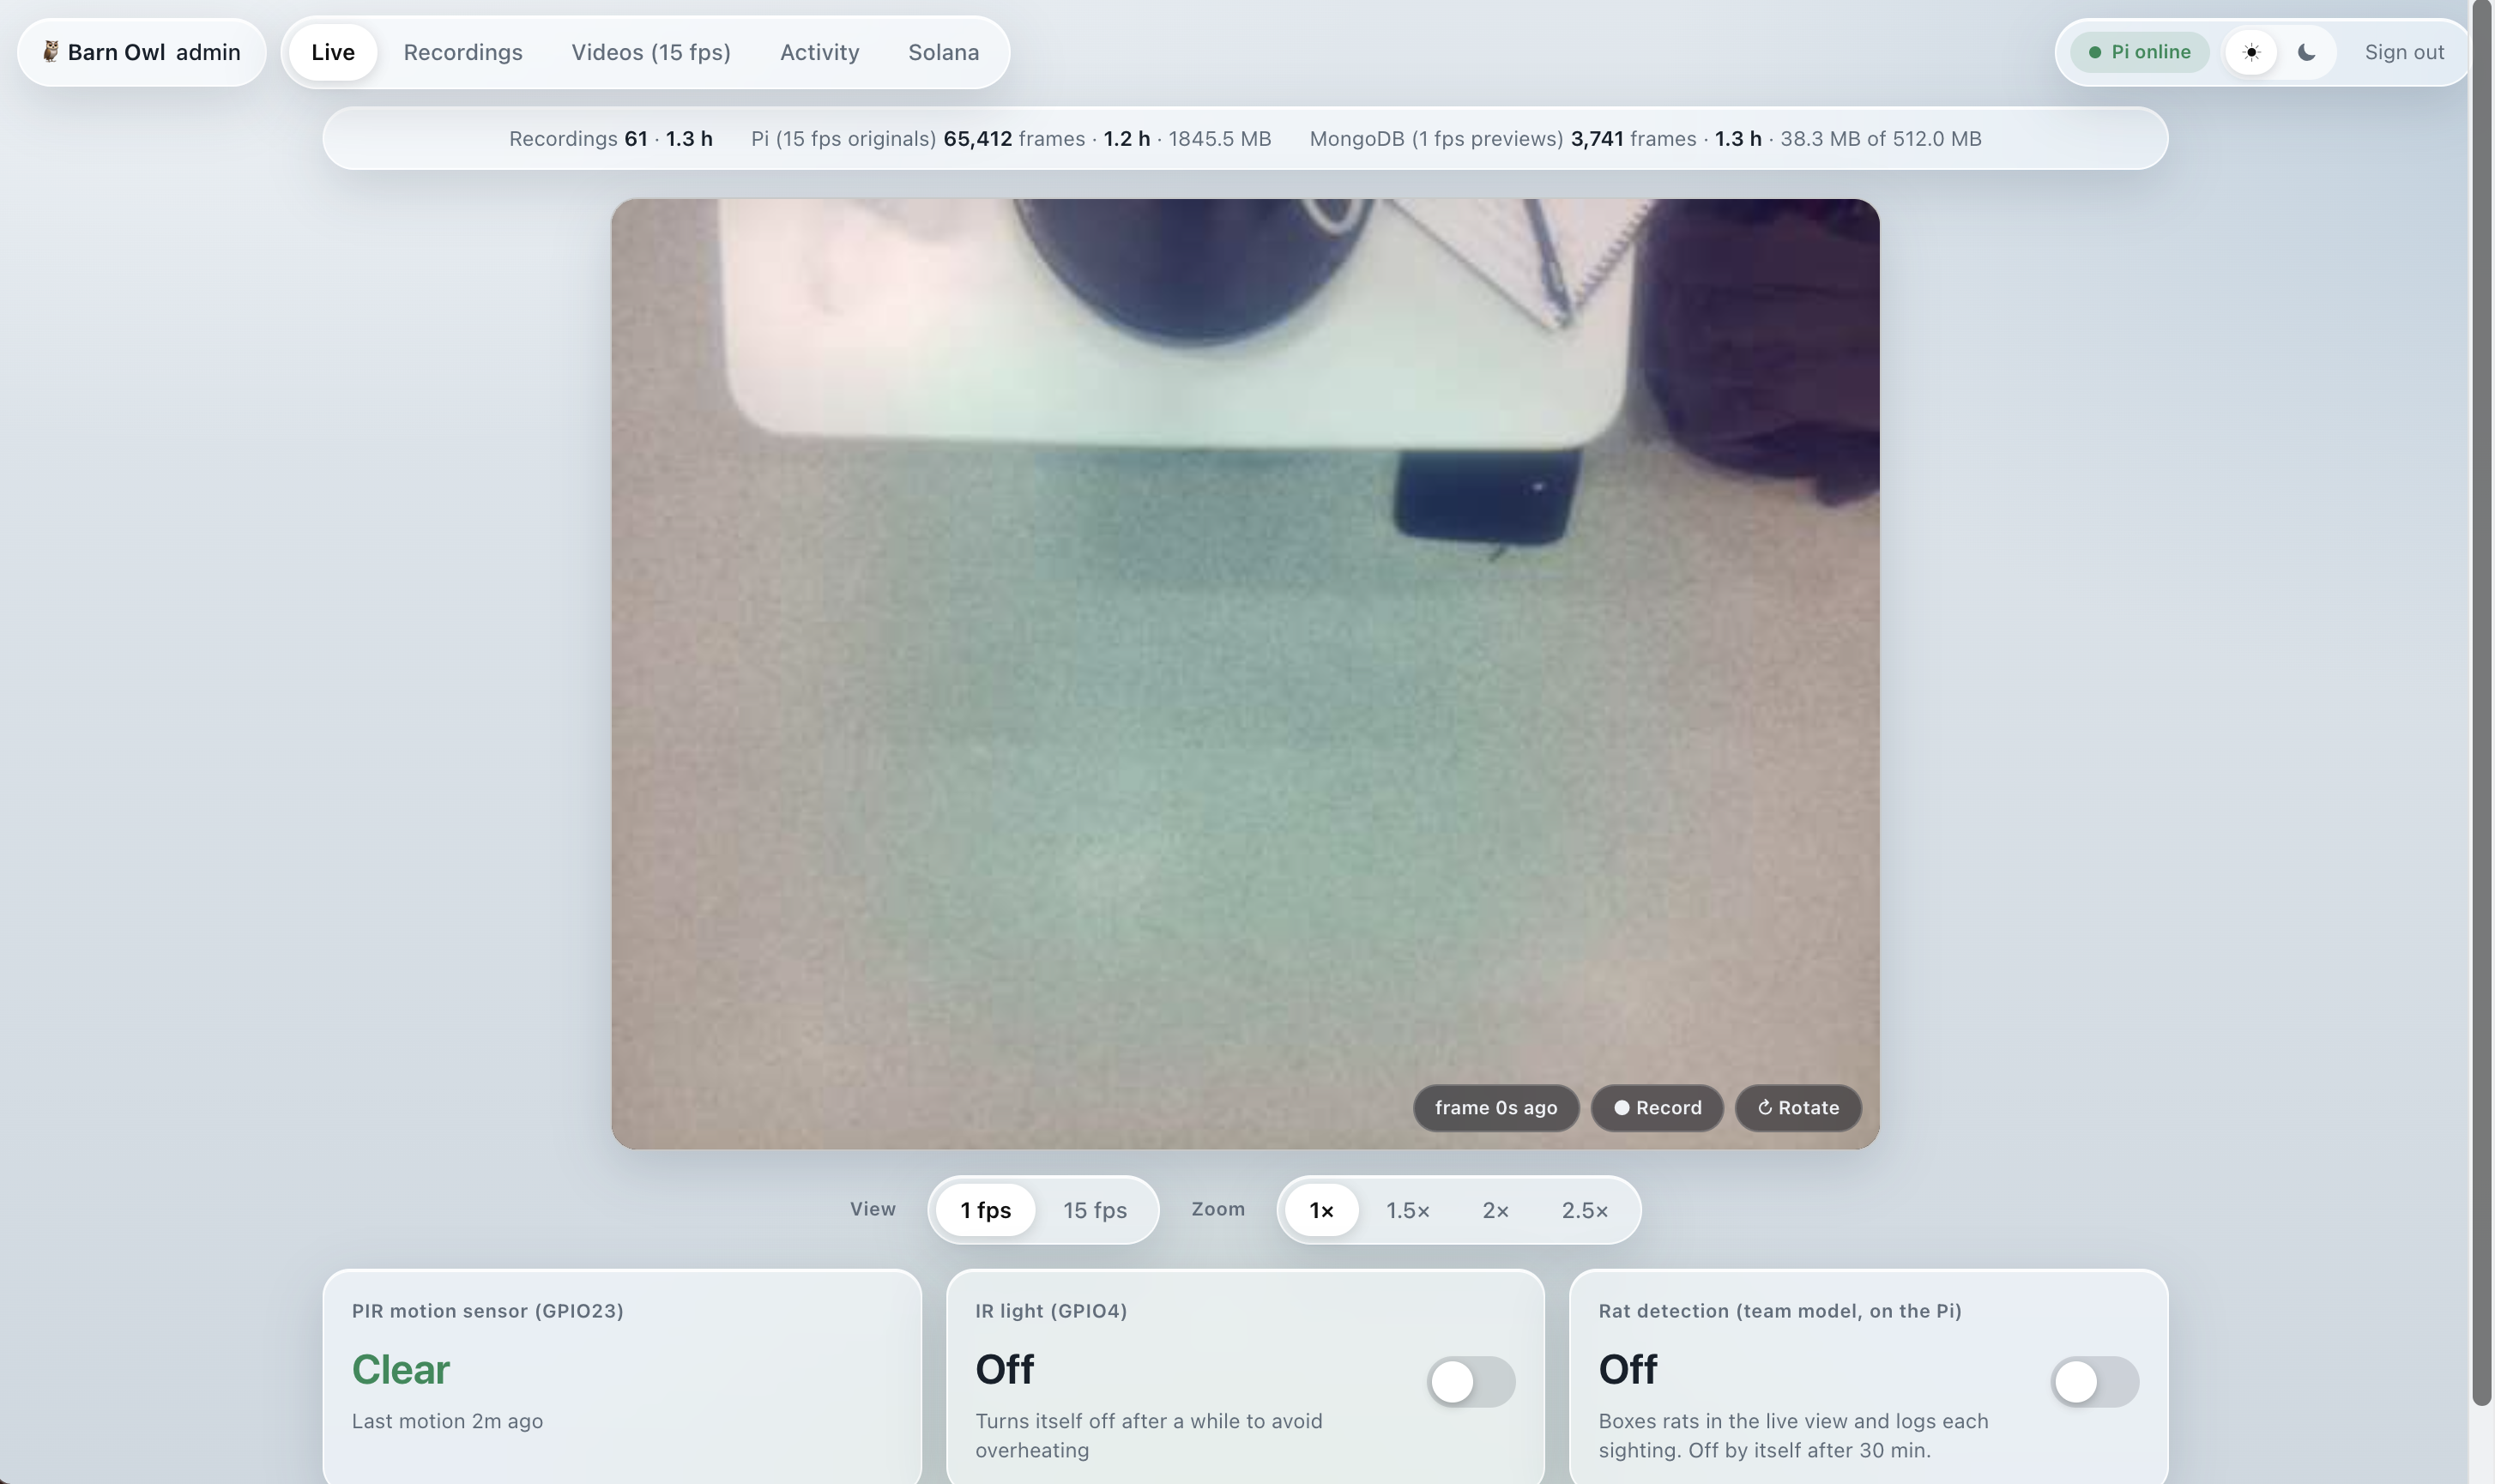
- Owls. Night-vision sensor nodes built on a Raspberry Pi 5 with an Arducam IMX219 NoIR camera, an 850 nm infrared illuminator, and an HC-SR501 PIR sensor. Each costs about $30, runs offline for up to six weeks, and wakes only on combined motion and heat signature. A YOLO11n detector, fine-tuned on footage we recorded ourselves, classifies rats on-device and transmits a small event record. No video leaves the node and no footage of residents is stored.
- Grok as the operator's interface. Grok 4.7 is not a chat box bolted onto the map. It is the layer that lets an inspector or a resident work the whole system in plain language, in three places:
- Map copilot. Grok has server tools over the live model output (citywide overview, ranked hexagon search, one cell's scores with its SHAP reasons and riskiest buildings, suggested owl sites, backtest quality, recent sightings) and over the physical node (status, PIR activity, recordings, and a live camera frame it can look at). It also has browser tools that drive the 3D map: fly to an address, switch between the "what the city sees," "what is there," and silence layers, enter a borough, open the owls or sightings panels, select a placed owl, and take a screenshot of the current view to reason about. "Where in the Bronx would inspectors find rats that nobody reports?" flies the camera there, pins the hexagon, and explains why the model thinks so.
- Dashboard builder. On the dashboards page Grok turns a question into interactive charts. It queries a bounded catalog of Night Owl data (modelled cells, the placement plan, the monthly backtest, sensor events, and 16 years of 311 complaint and inspection history by borough, ZIP code area, and income band), then publishes editable cards. Follow-ups see the current dashboard and the chart value the user clicked, so "split that by income band" or "same thing, before and after COVID" revises the cards in place. Dashboards export as a single self-contained HTML file.
- iMessage line. The same agent answers over text: rat risk and silent blocks for any address, suggested sites, and camera frames from the Pi sent back as photos.
- The loop. Each detection updates that block's belief, and the planner re-ranks the next wave of placements. The predictor decides where Owls go, and Owls decide what the model believes next. Grok reads the same live store as the map, so a detection shows up in its answers the moment it lands.
How we built it
- Data. 16 NYC open datasets, including 3.1M rodent inspections, 512k 311 rodent complaints, PLUTO building records, restaurant inspections, DOB permits, the street tree census, catch basins, DSNY refuse data, Census ACS, and NOAA weather. Everything is aggregated in DuckDB onto an H3 hexagon grid (7,633 cells, roughly 2–3 blocks each) by month from 2010 onward.
- Defining the ground truth. The inspection data has no "proactive" label, so we identify sweeps structurally: 10 or more properties inspected on one block on one day. Only 5% of those visits followed a complaint on the lot, versus 48% of single-lot visits.
- Models. LightGBM gradient-boosted trees trained from scratch. Model B runs as 5 bootstrap replicates over community districts to estimate uncertainty. Tree ensembles are overconfident in regions with no training coverage, so we add a Beta-Binomial layer. The model's output sets the prior belief for each block, and every inspection result or sensor detection updates that belief, so a block with fresh evidence outweighs one the model has only guessed at.
- Validation. Spatial cross-validation that holds out entire community districts, and a rolling backtest in which the model is trained on all data through a given month (for example, June 2025) and scored against the inspections recorded in the following month.
- Building level. A second model scores individual lots, and a spot scorer ranks roughly 50 m sites inside each hexagon so a crew knows which tree guard to mount on.
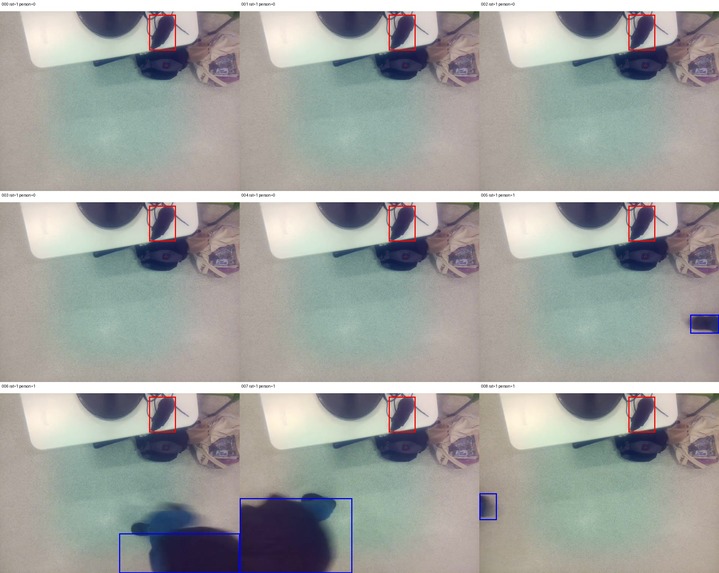
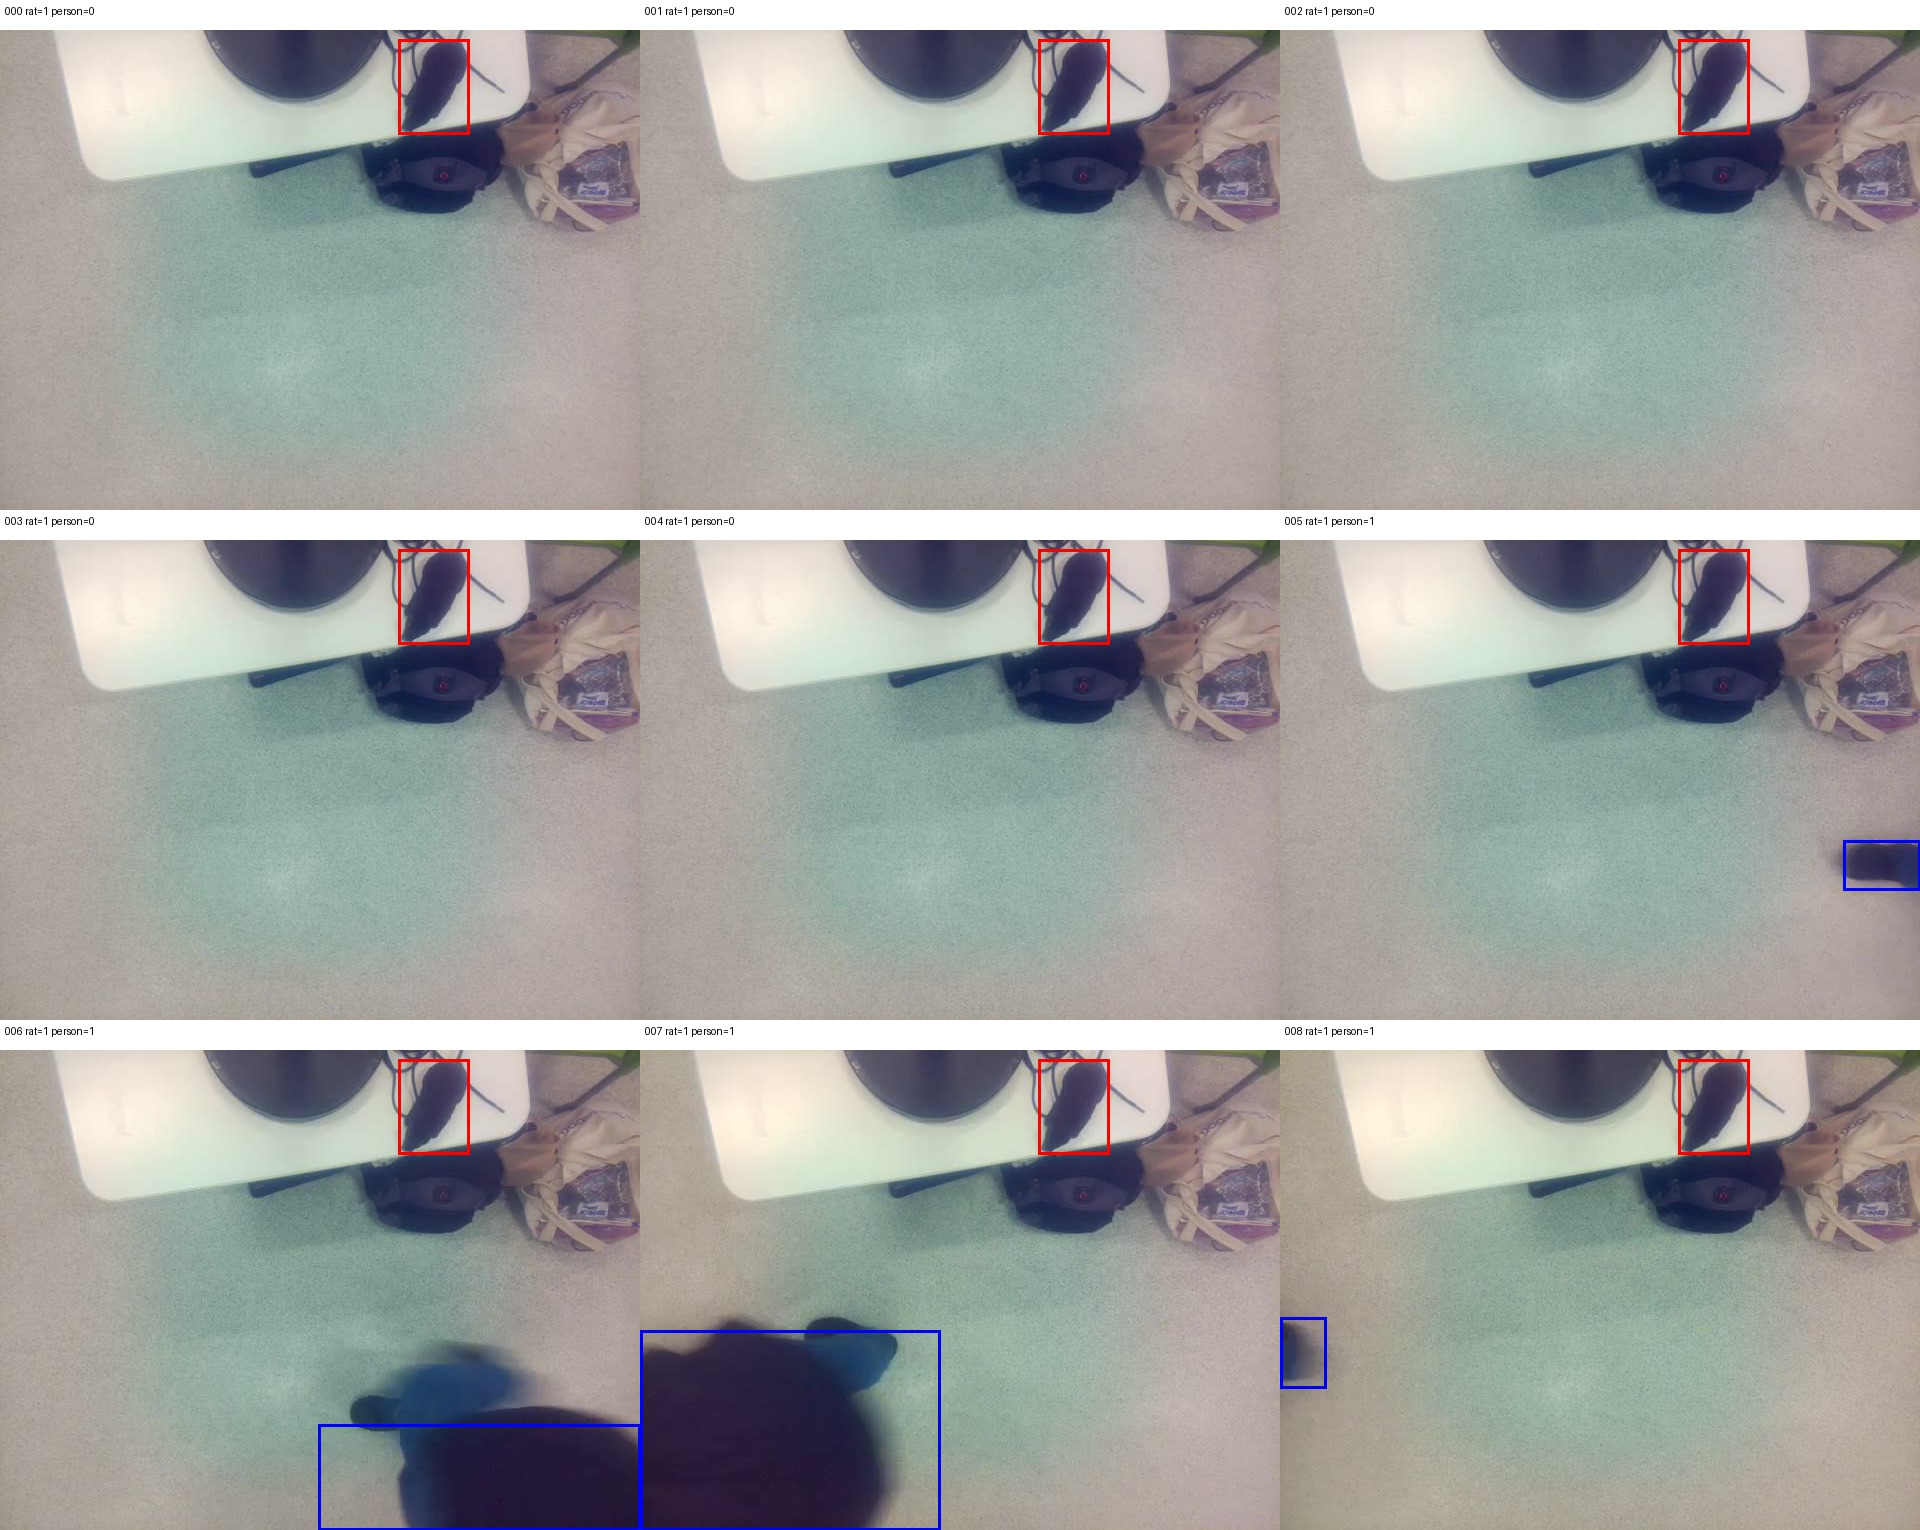
- Detector. We built the rat recognition dataset ourselves. We recorded 19 phone clips across roughly 19 scenes (bedrooms, corridors, stairwells, cluttered floors), extracted 3,186 frames at 3 fps, then recorded additional sessions on the actual Pi camera rig. Frames were labeled by hand, converted to grayscale to match the NoIR sensor, and split by whole clip so no scene appears in both training and validation. We added hard negatives (hands, shoes, caps, bags, people) after early models fired on them, and fine-tuned YOLO11n over six iterations, exporting to a 416-pixel ONNX model that runs at about 60 ms per frame on the Pi. Every recording, frame count, and dataset fingerprint is logged in the admin database.
- Grok integration. The map copilot uses Grok 4.7 through the xAI chat completions API with streaming and tool calling, up to six tool rounds per question, with reasoning set low because it answers as well and about twice as fast on this data. Server tools read model exports through the same store that serves the map, so the live posterior overlay applies. Browser tools run in the page and post their results back, so the model can act on what only the page knows: the camera pose, the placed owls, a screenshot. The dashboard builder uses the xAI Responses API with two tools, one to query data and one to publish a dashboard. Every query is validated against a typed catalog of fields, dimensions, and allowed aggregations, filtered and capped before returning rows, and the model never executes code or SQL. It is told to use a tool for every number and never to invent one, and each chart carries its source month and data limits. Keys stay on the server and never reach the frontend or an exported file.
- Cost basis. A Health Department sanitarian earns $25 to $40 an hour. An Owl costs about one inspector-hour and provides roughly 1,008 hours of continuous coverage.
- Stack. Python, DuckDB, H3, LightGBM, a FastAPI server, a React and three.js 3D map, Grok 4.7 over the xAI API for the copilot and dashboards, Photon Spectrum for iMessage, and a YOLO11n detector running on the Pi.
Sponsor tech
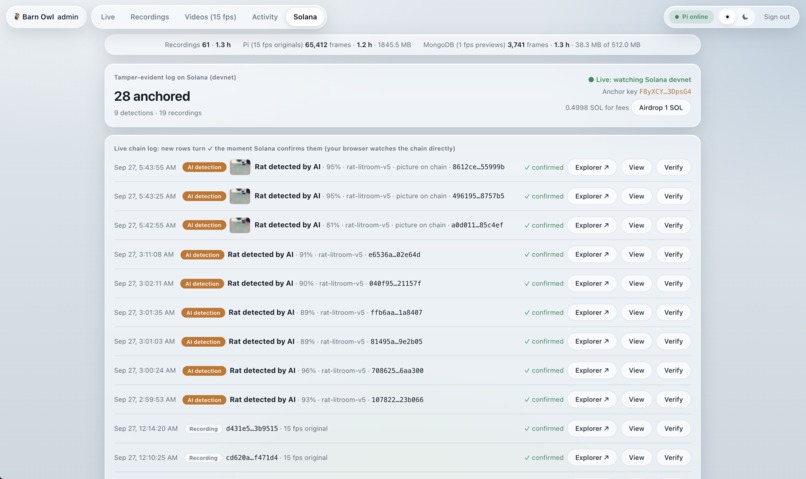
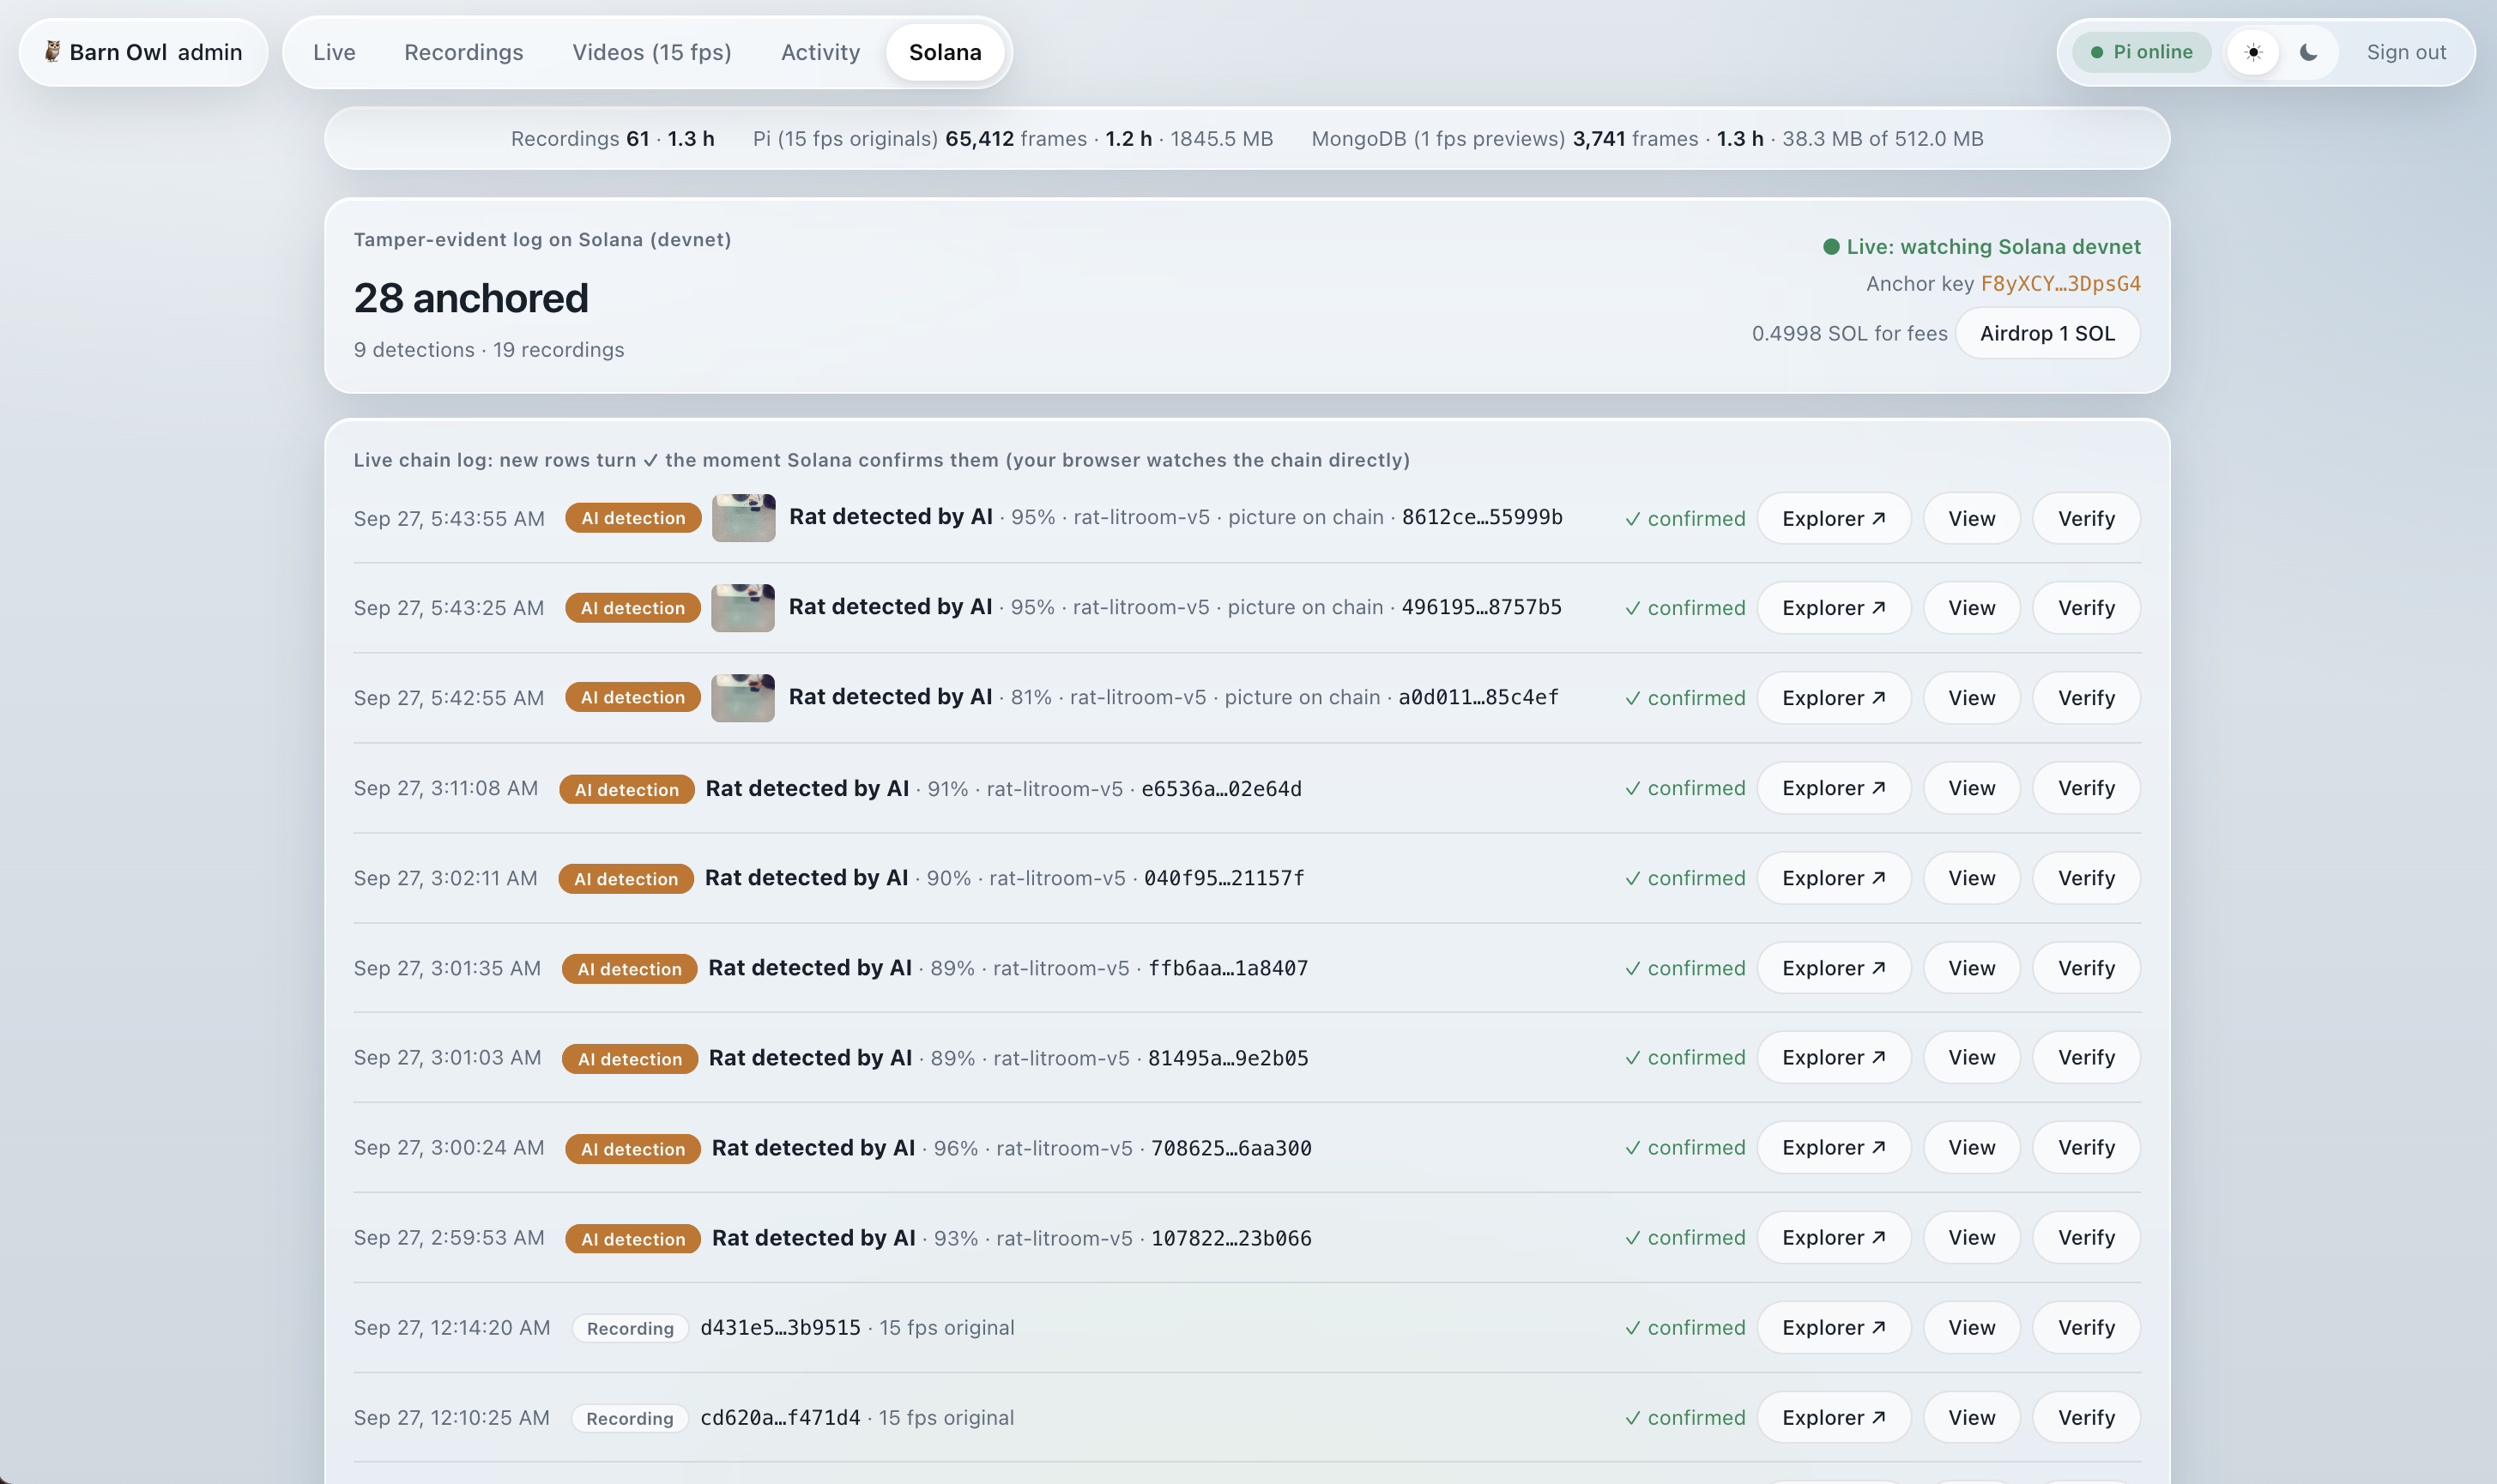
- Solana: Every rat detection (with its boxed frame) and every finished recording is SHA-256 hashed and written to Solana devnet as a Memo transaction, so anyone can check that footage wasn't altered. The dashboard's Solana tab shows a live chain log.
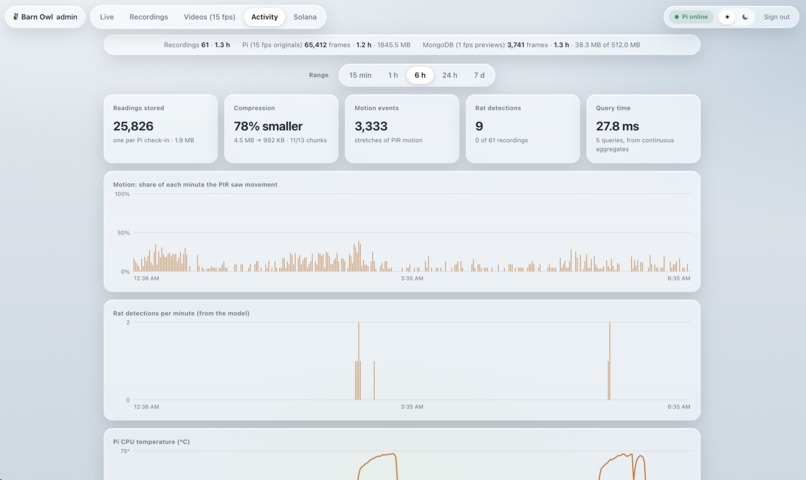
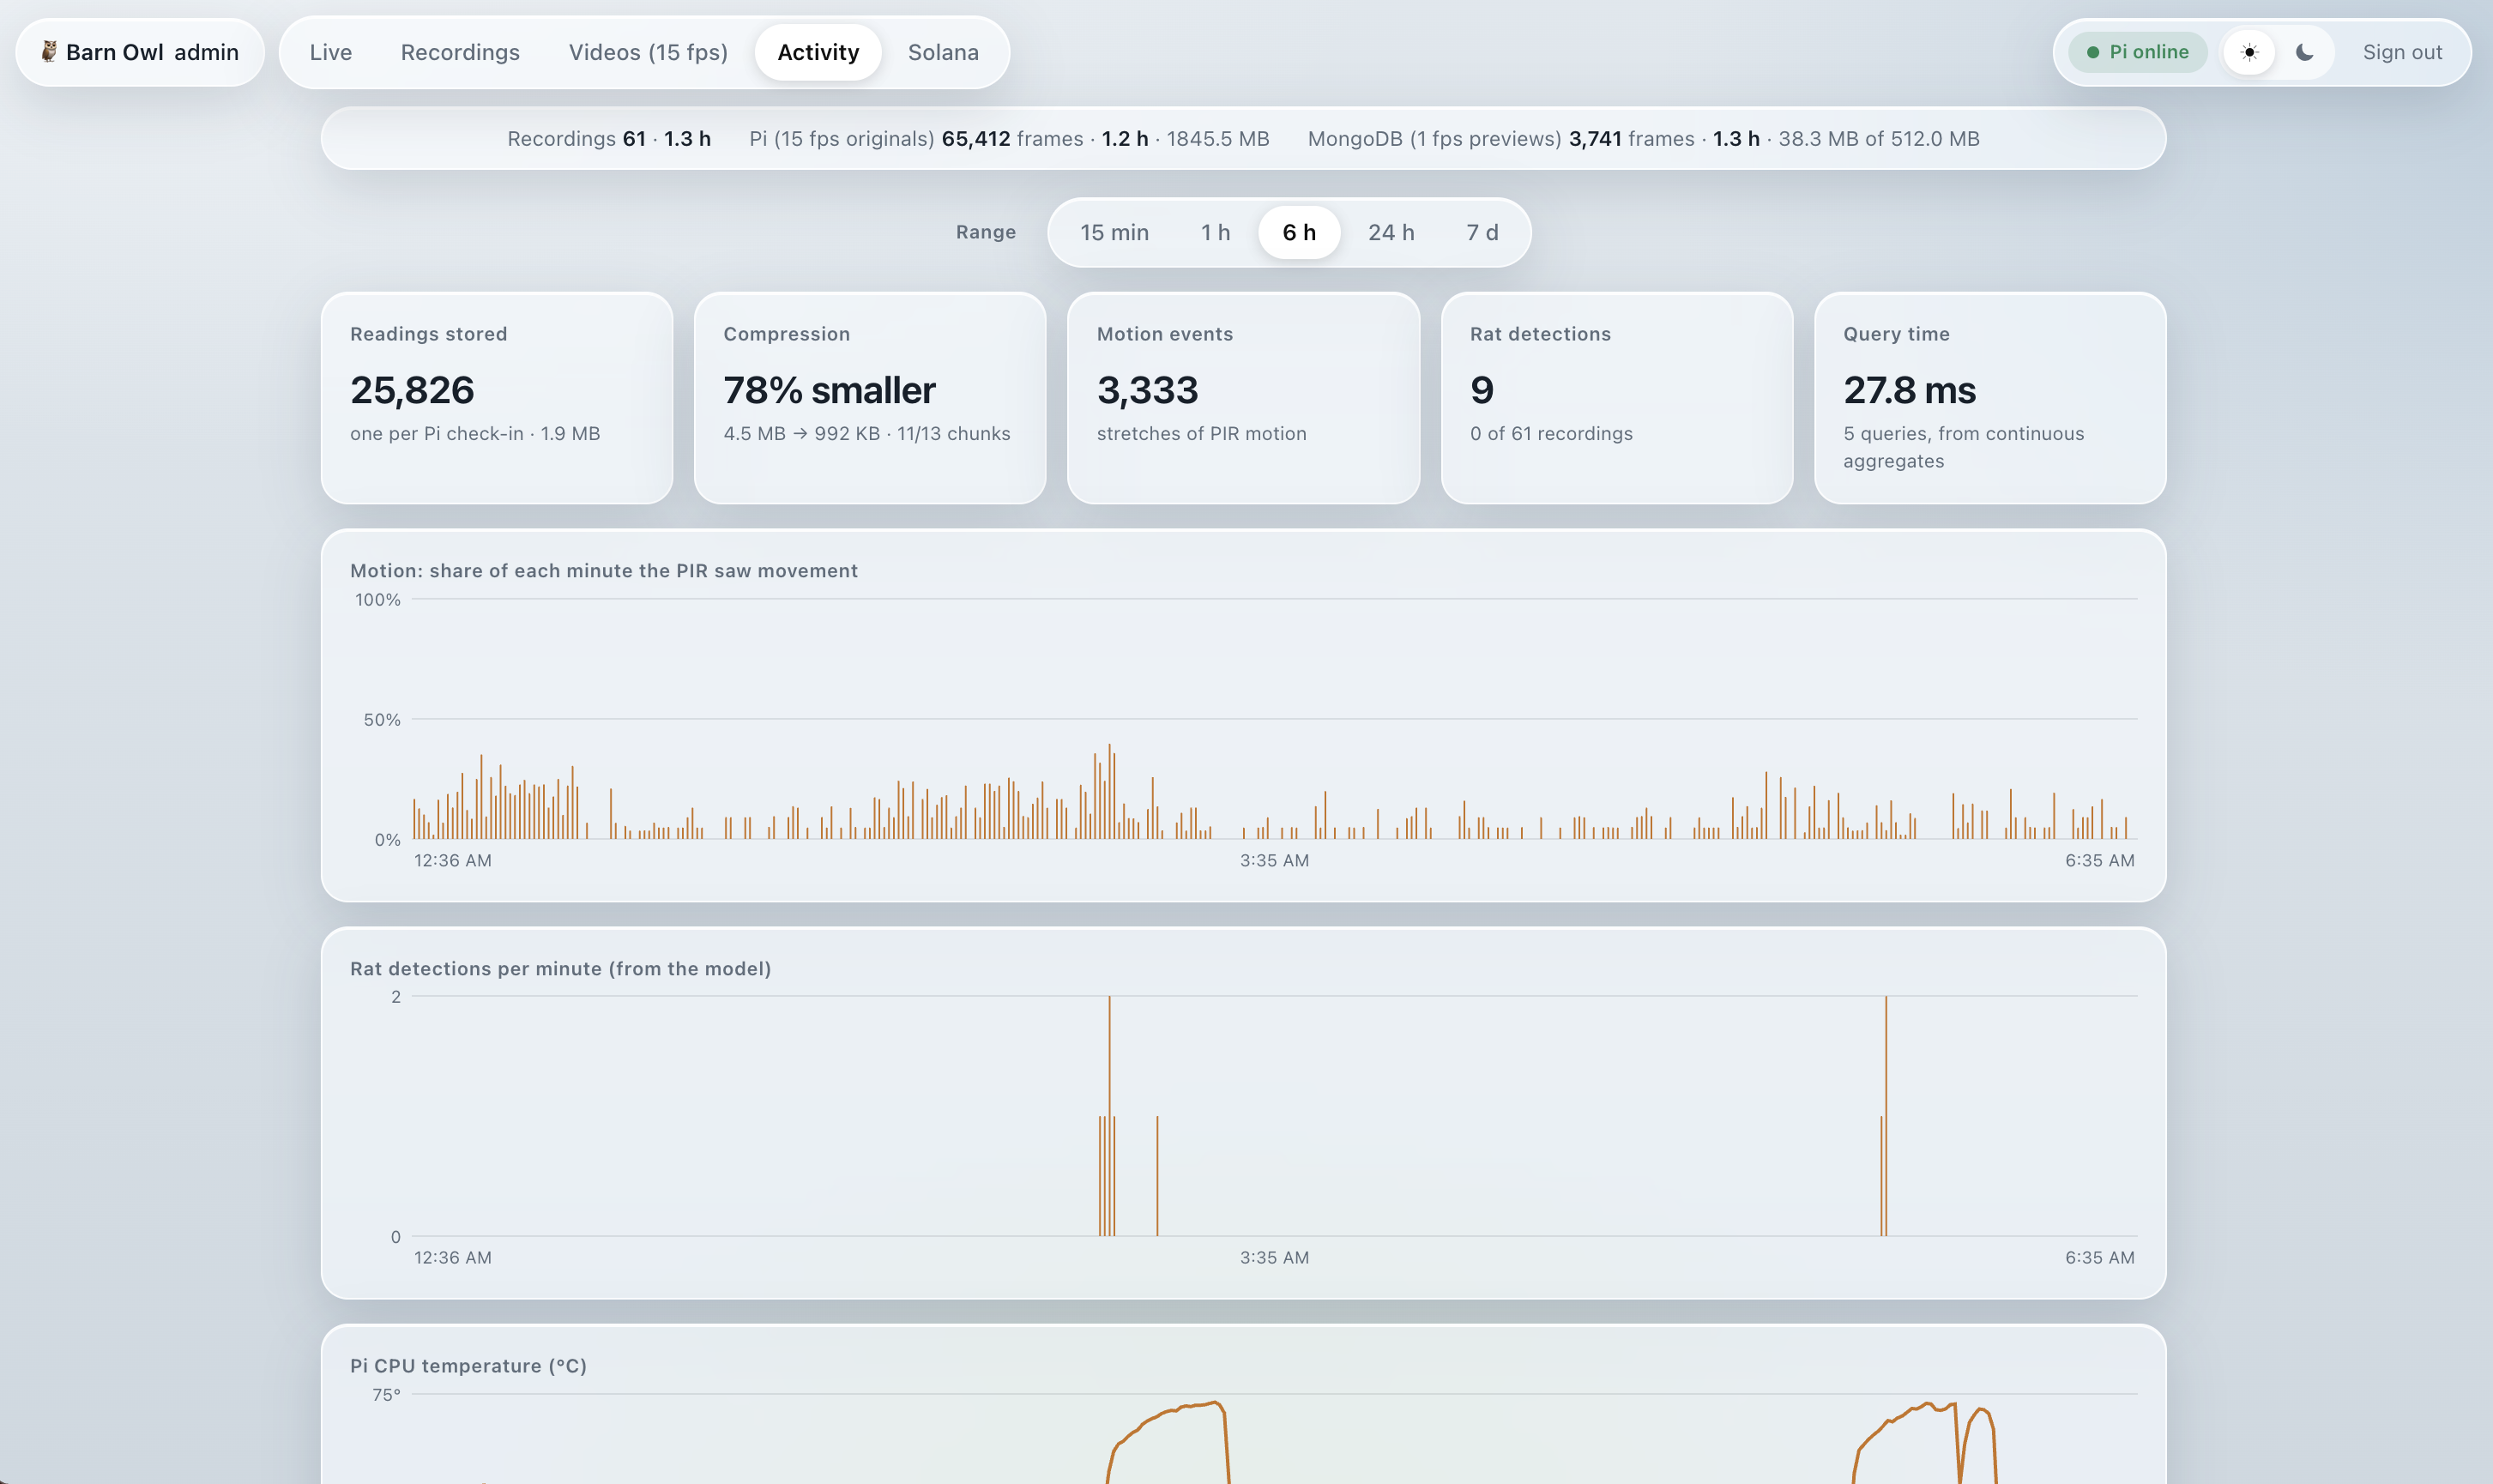
- Tiger Data (TimescaleDB): The Pi's check-ins (PIR, IR, CPU temperature, Wi-Fi signal), motion events and detections go into compressed hypertables. Continuous aggregates by the minute and hour drive the Activity tab.
- MongoDB Atlas: Stores the node's live state, recordings, about one preview frame per second, sighting images and the Solana anchor records.
- DigitalOcean: One droplet behind Caddy serves the map, the FastAPI model API, the node dashboard and the iMessage bot. DNS is also on DigitalOcean.
- .tech: barn-owl.tech is the live site.
- Cursor + Grok: We built the Grok dashboard builder in Cursor. It uses agentic database querying, so Grok can run relational queries across all of our trend data. The dashboard builder runs on Grok 4.7 through the xAI Responses API.
Challenges we ran into
- Scoring the model fairly. Our first backtest scored against all inspections and made our method look 24× worse than complaint-driven targeting. Silent blocks are rarely inspected, so they could not score even when rats were present. We rebuilt the evaluation to grade only the blocks inspectors actually swept.
- A single super-reporter. One app user in East Harlem filed 5,339 complaints from the same GPS point, up to 36 in a day. Complaint counts can measure one person rather than a neighborhood. We now count at most one complaint per location per day.
- Normalization. Raw complaint counts made empty, low-density areas look "silent." Complaints per resident corrected this, and we publish the alternative normalizations alongside it.
- Stating limits. We attempted to validate never-inspected areas against restaurant rodent violations and found no clear signal, so we make no claim there. That gap is the reason the Owls exist.
- The detector. Pretrained models classified our test rat as a teddy bear, and no public dataset covers a rat under infrared at ground level. We had to record the footage ourselves, label thousands of frames, and hold out whole clips to catch the model memorizing a scene. Consecutive frames are near-duplicates, so a random train/validation split gave inflated scores until we split by recording.
- Keeping the agent honest. A model that talks about rat risk in a specific neighborhood can do real harm if it makes numbers up. We gave Grok no free-form data access at all: every figure comes from a tool result, dashboard queries are validated against a fixed catalog and capped, and the model is told which counts are complaints, which are inspections, and that none of them are rat counts. Streaming tool loops also had to survive a user closing the tab mid-answer without leaking a half-built dashboard into their next session.
Accomplishments that we're proud of
- A 10-year backtest (119 months). Our picks found rats at 19.5% vs 15.2% for complaint-based picks, a 28% improvement, and beat that approach in 108 of 119 months.
- On quiet blocks, 1.8× more rats than chance, in 117 of 119 months.
- In never-inspected buildings, where complaint history barely outperforms random selection, our building model finds rats at 2.2× the random rate.
- Silent blocks are real and inequitable: median income $62k vs $92k, and 17% vs 9% limited-English households.
- A working end-to-end loop: a detection on recorded footage moved a block's score and re-ranked the sensor plan live on the map.
- Grok runs the whole thing from one sentence. Asking for the most under-reported block near an address flies the map there, switches to the silence layer, lists the model's reasons and the riskiest buildings, and can pull a live frame from the Pi, all from tools over real model output. The same question over iMessage gets the same answer.
What we learned
- Silence is not the same as clean. Complaints measure who reports, not where rats are.
- Validation design outweighs model choice. How we scored the backtest changed the conclusion more than any feature did.
- Rats stay local. Field studies from Fordham in NYC and from Vancouver show rats rarely range beyond about one block, which set our grid scale and justified a building-level layer.
- State the limits. Every claim we kept, we tested. The ones we could not test, we labeled.
What's next for Night Owl
- A supervised 50-node pilot in one community district, evaluated against the next season of city sweeps.
- Feeding real Owl detections back into Model B's training set.
- Learning the spot-scoring weights from data instead of setting them by hand.
- Adding Rat Mitigation Zone boundaries and measuring the effect of September 2026 bin-rule enforcement once data exists.
- A public, district-level view of the service gap, framed as where the city under-serves rather than as "dirty neighborhoods."
- Letting Grok propose the next wave of owl placements as a dashboard the crew can edit, rather than a fixed ranked list.
Built With
- .tech
- arducam
- digitalocean
- duckdb
- fastapi
- grok
- h3
- imessage
- infrared
- lightgbm
- mongodb
- photon
- python
- raspberry-pi
- react
- scikit-learn
- solana
- spectrum
- three.js
- tiger-data
- timescaledb
- typescript
- xai
- yolo


Log in or sign up for Devpost to join the conversation.