-
-
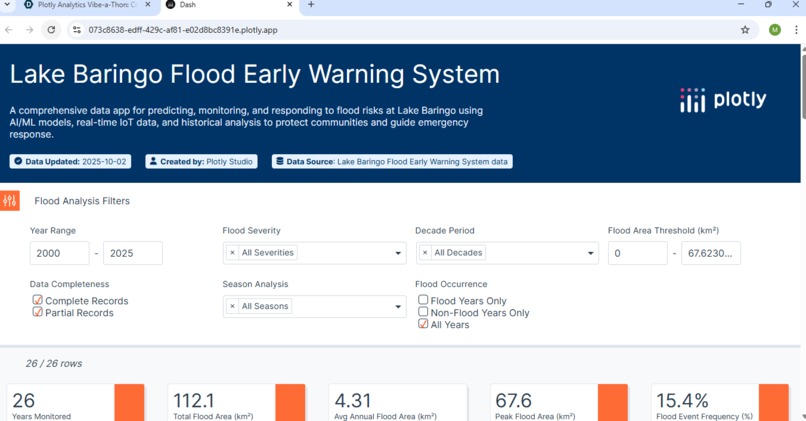
A data app that provides an early warning system for flooding in lake Baringo by using past data to evaluate trends.

🌊 Lake Baringo FloodWatch: Smart Solutions,Brighter Futures
🧭 Inspiration
Lake Baringo, one of Kenya’s most iconic lakes, was once a thriving destination for education, tourism, and fishing, but a news report changed everything: The lake had burst its banks, unleashing a relentless tide that brought hippopotamuses and crocodiles into human settlements. Schools were submerged, families rendered homeless and thousands of learners were forced out of classrooms.
This moment sparked a question in me:
What if technology could warn, protect, and empower these communities before disaster strikes?
📚 What I Learned
- Flooding is not just a natural event it’s a social emergency.
- Real-time data and predictive analytics can save lives.
- Accessibility is critical: Many affected users rely on basic phones and need offline solutions.
- Inclusion must be intentional designing for persons without internet connectivity, low literacy, and remote areas.
🛠️ How I Built It
- Data Source:Compiled water level data for Lake Baringo from 2000 to 2025 using Google Earth Engine Code Editor and exported the output in form of CSV files.
- Visualization: Used Plotly Studio to create interactive charts showing historical trends and real-time monitoring.
- AI/ML Integration: Trained a machine learning model to forecast future water levels and trigger alerts using past data.
⚠️ Challenges Faced
- Integrating multiple features (AI, USSD, SOS, real-time data) into a seamless user experience.
- Ensuring accessibility for users with basic phones and disabilities.
- Crafting a brand and story that communicates urgency, empathy, and innovation.
🌍 Vision
Lake Baringo FloodWatch is more than a dashboard it’s a lifeline.
It’s a promise that data can serve humanity, that no one should be left behind, and that technology can be a force for resilience.
This app is built for the people of Baringo with empathy, precision, and purpose.
Built With
- google-earth-engine
- javascript
- plotly-studio


Log in or sign up for Devpost to join the conversation.