-
-
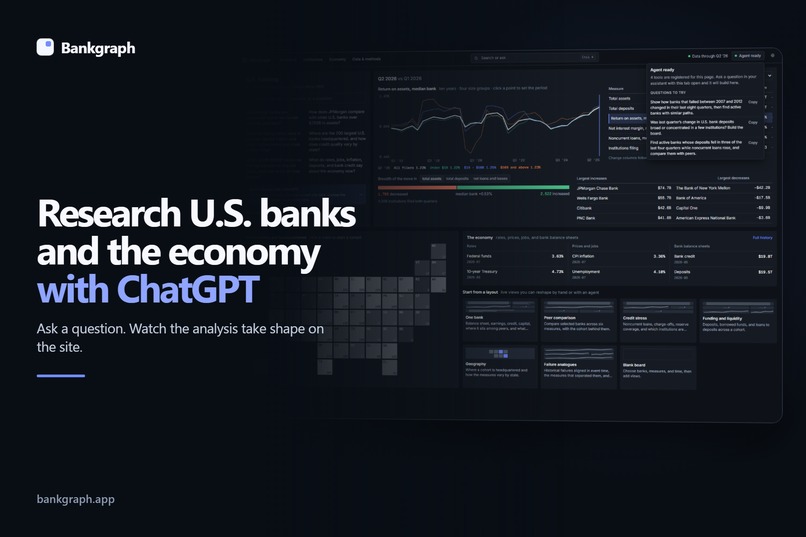
Bankgraph turns a question about a bank, the banking system, or the economy into a live research board that ChatGPT can build with you.
-
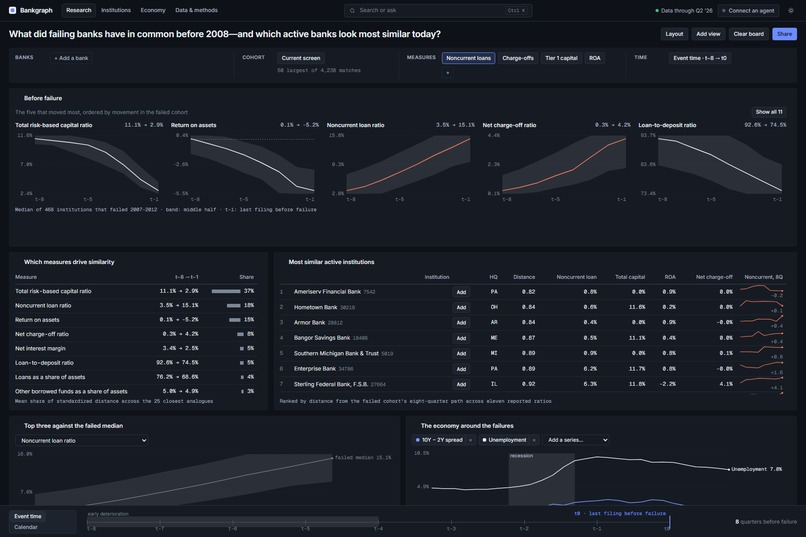
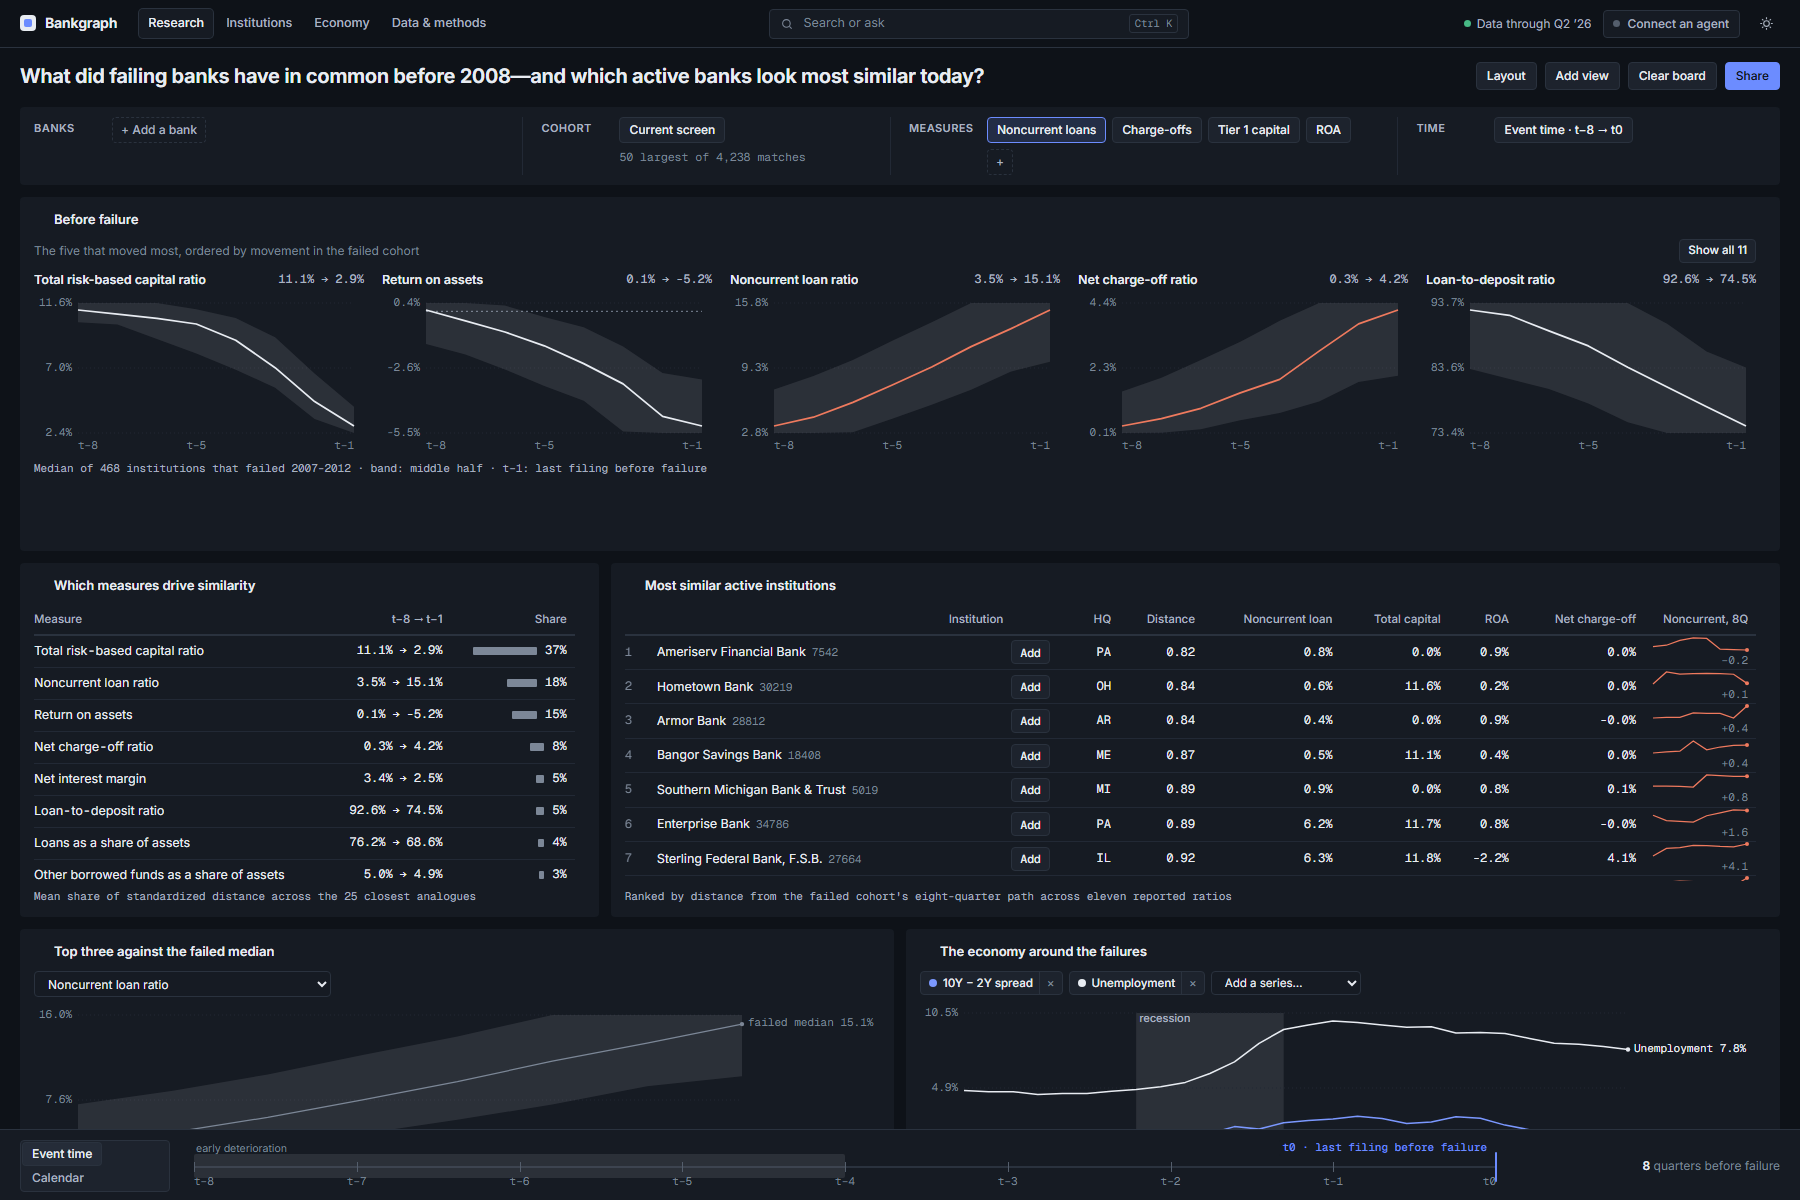
Compare the years before past failures with the reported paths of active banks today.
-
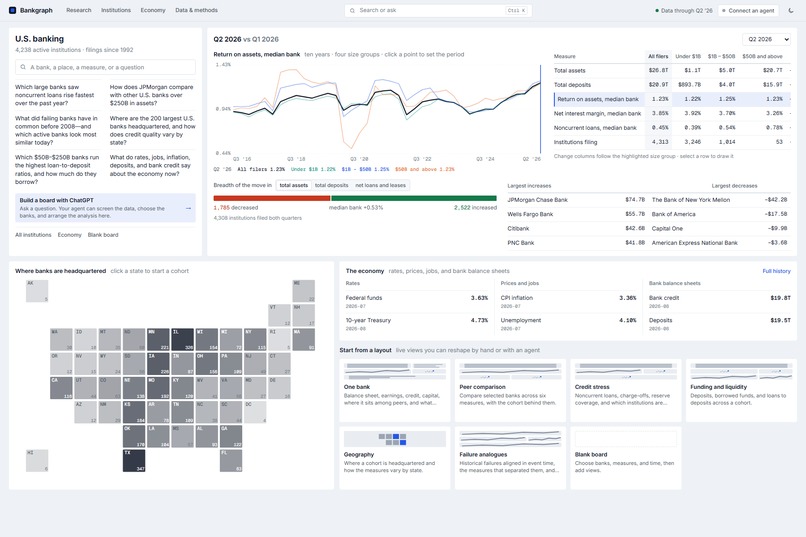
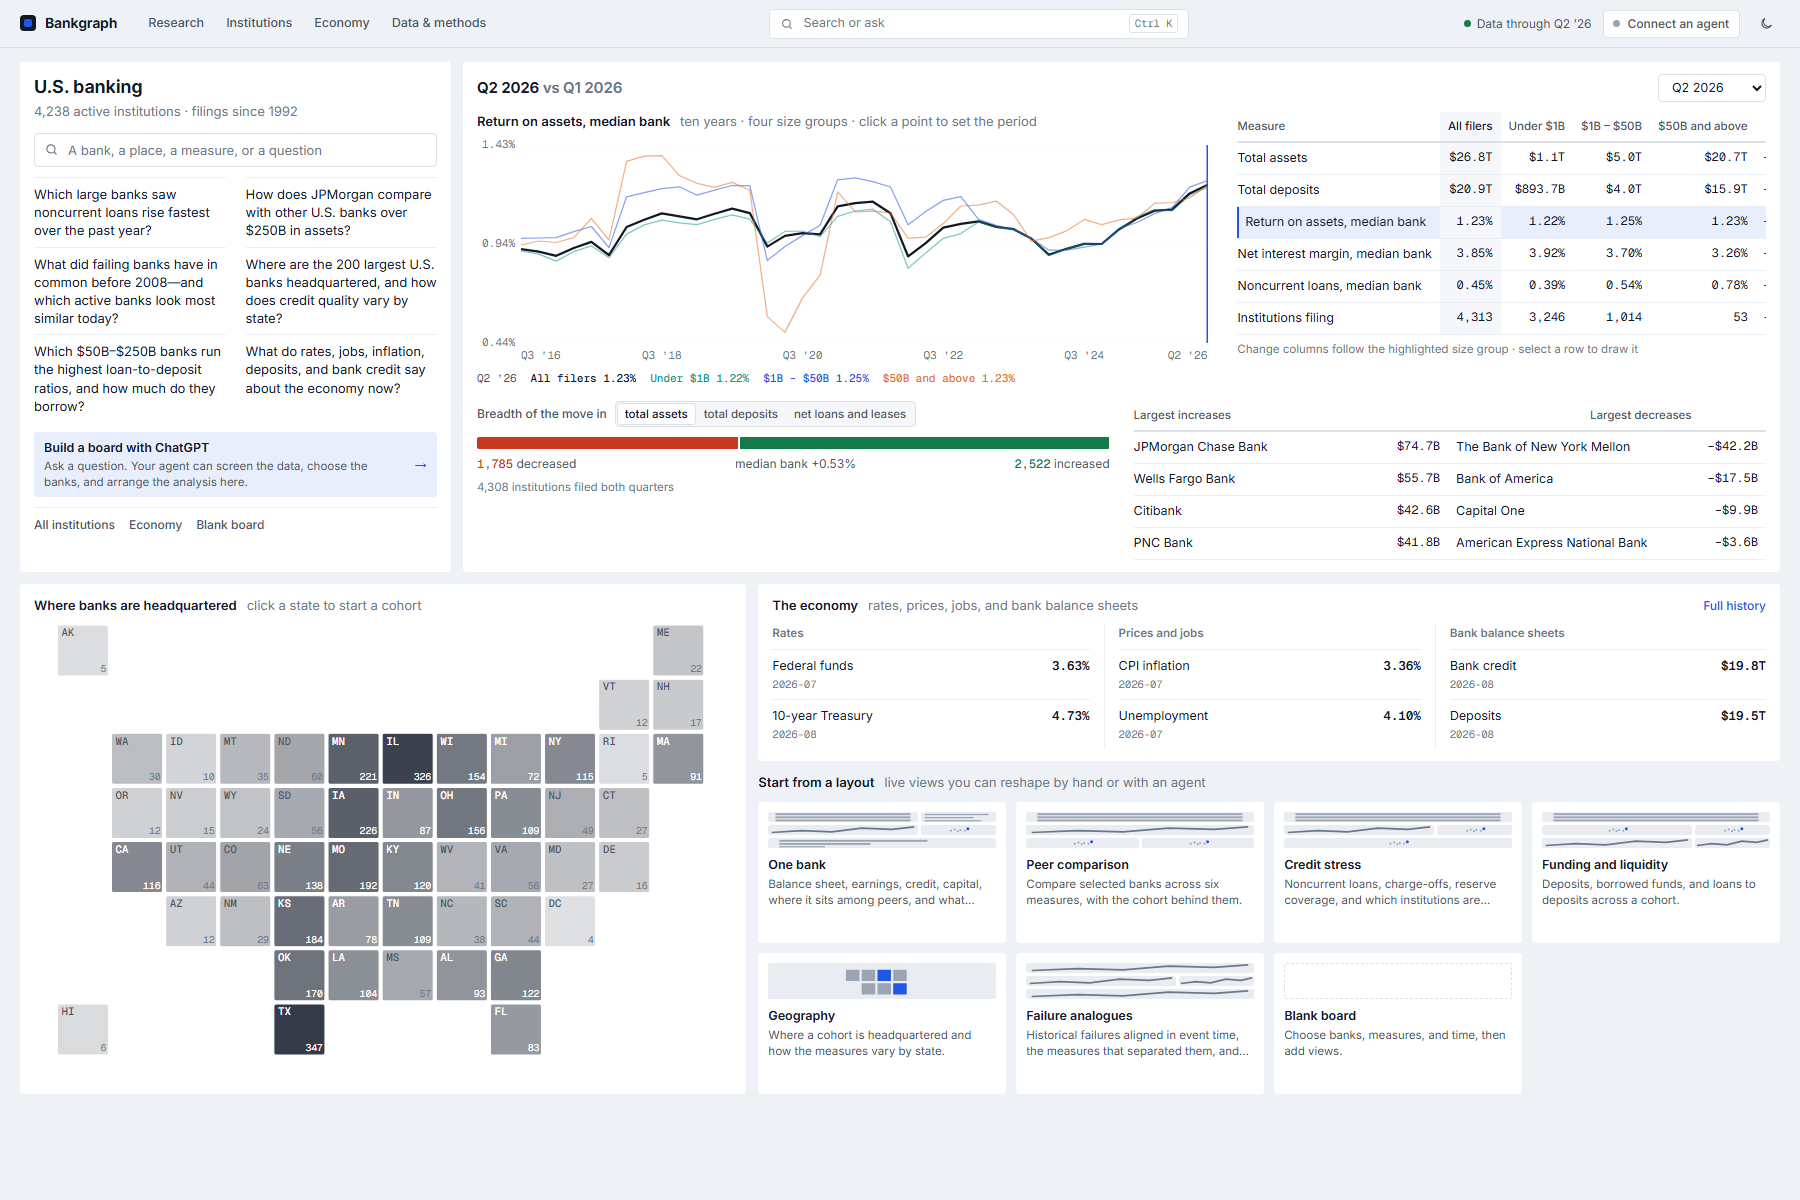
Move from one bank to the banking system and the economy without rebuilding the data first.
-
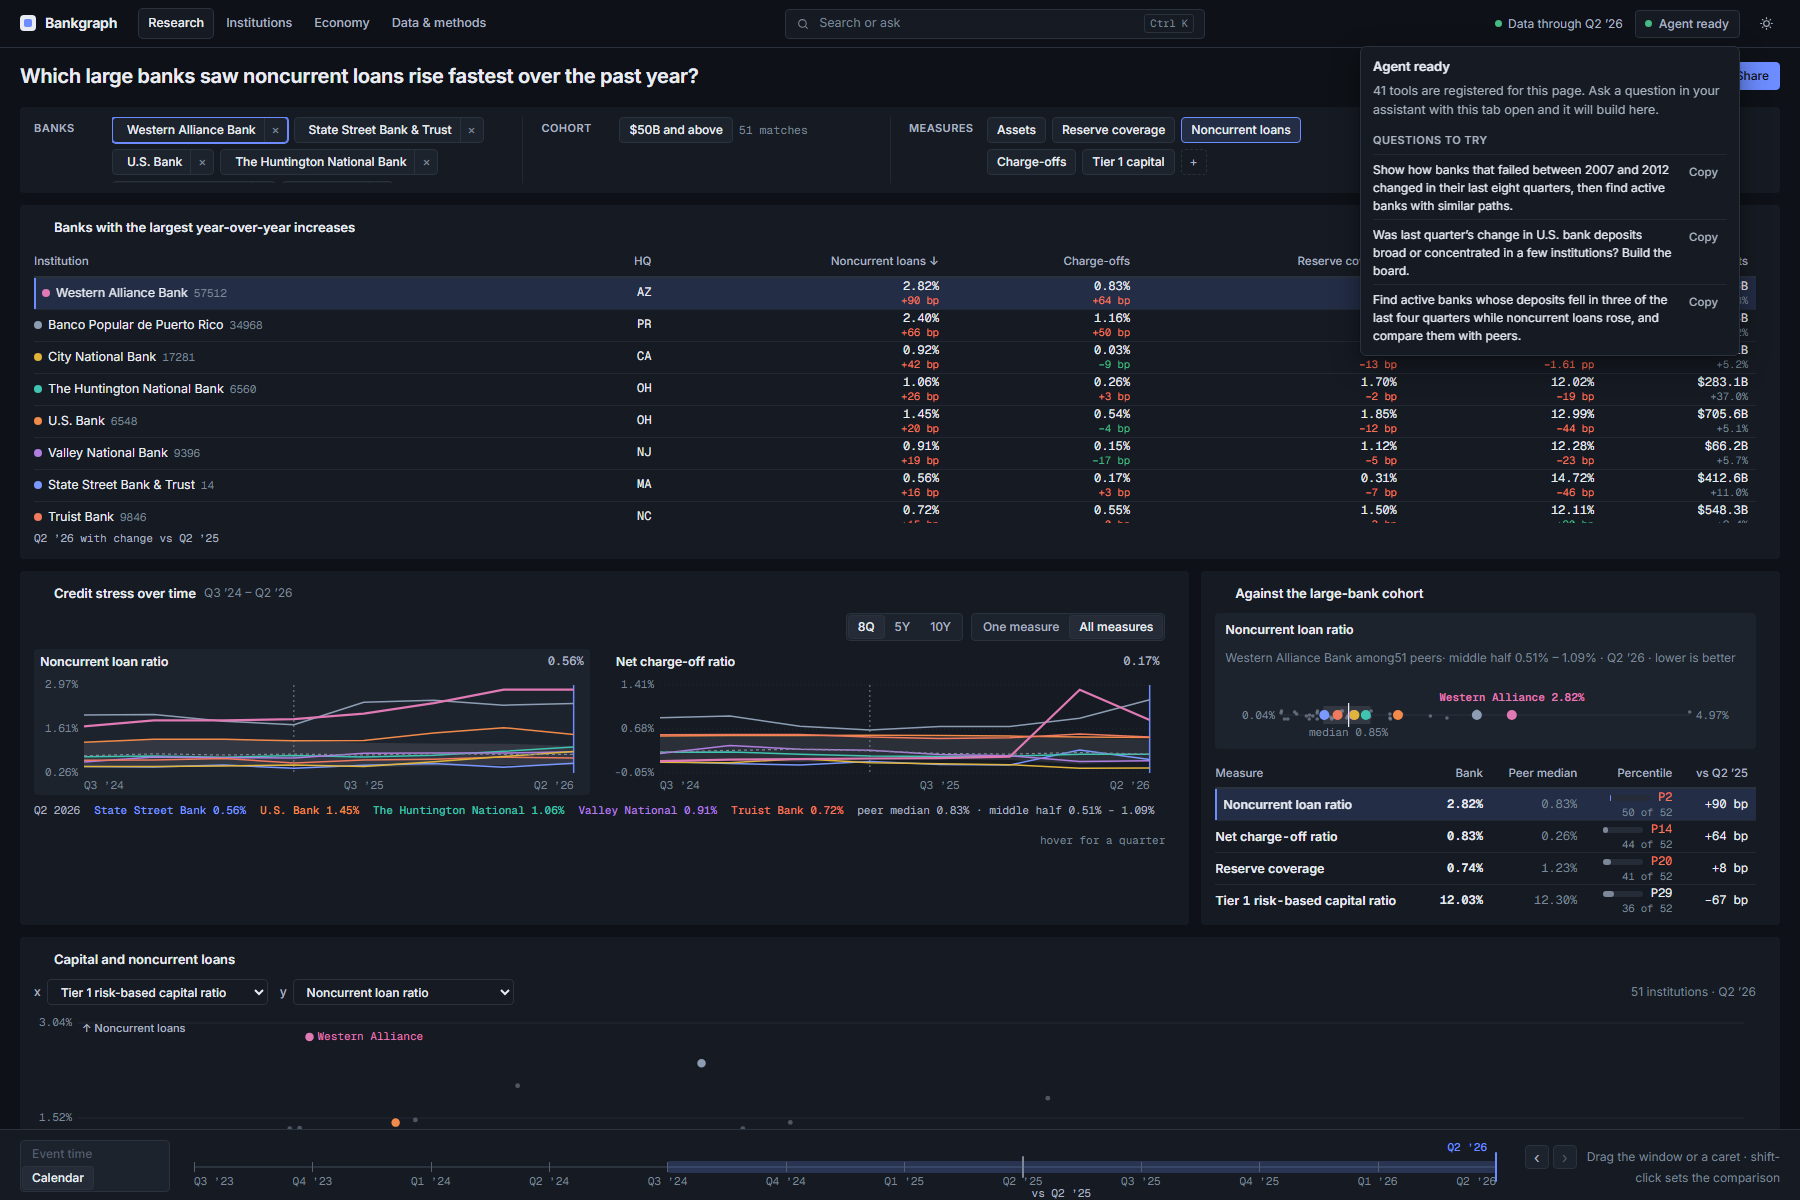
Start with the condition you care about, even when you do not know which bank to search for.
-
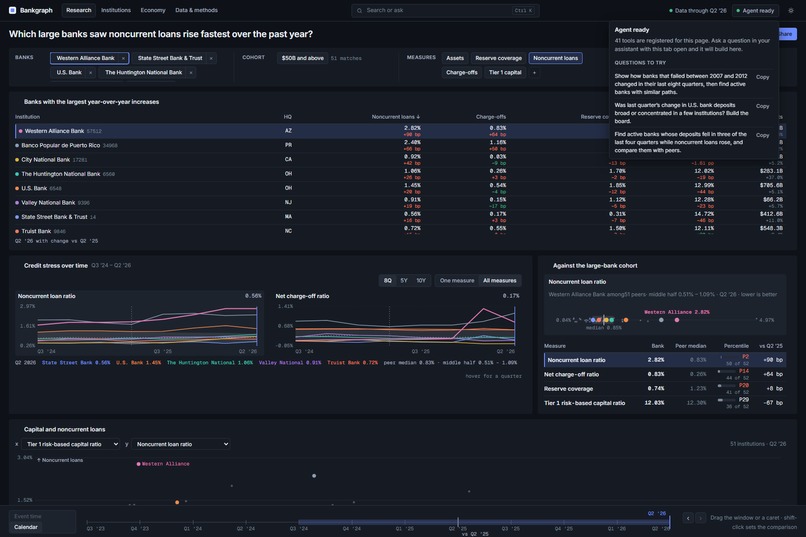
Put bank behavior and economic context on the same working surface without flattening their different time bases.
-
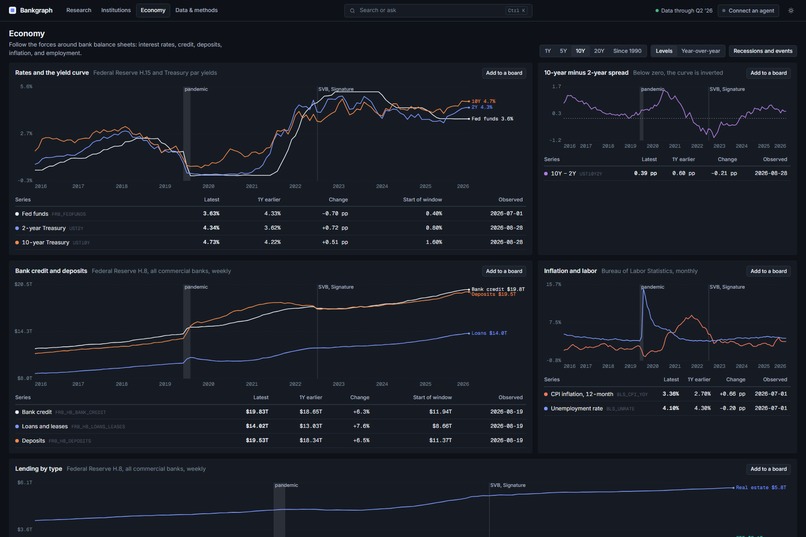
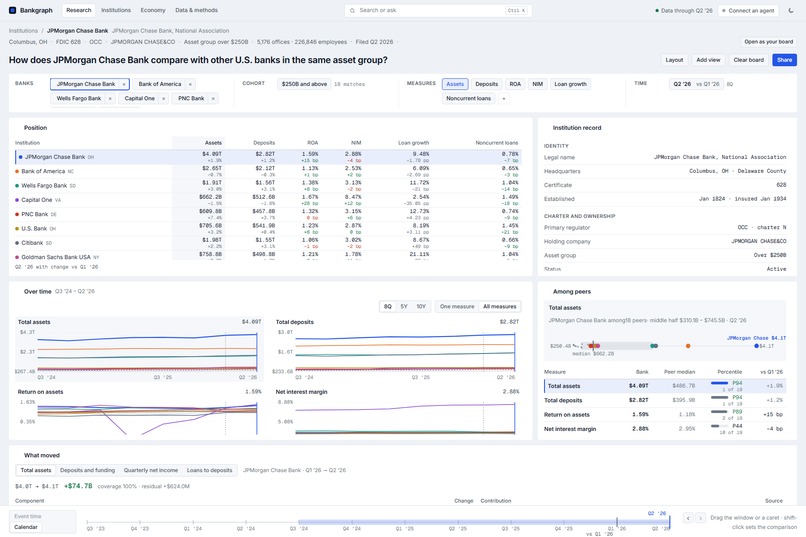
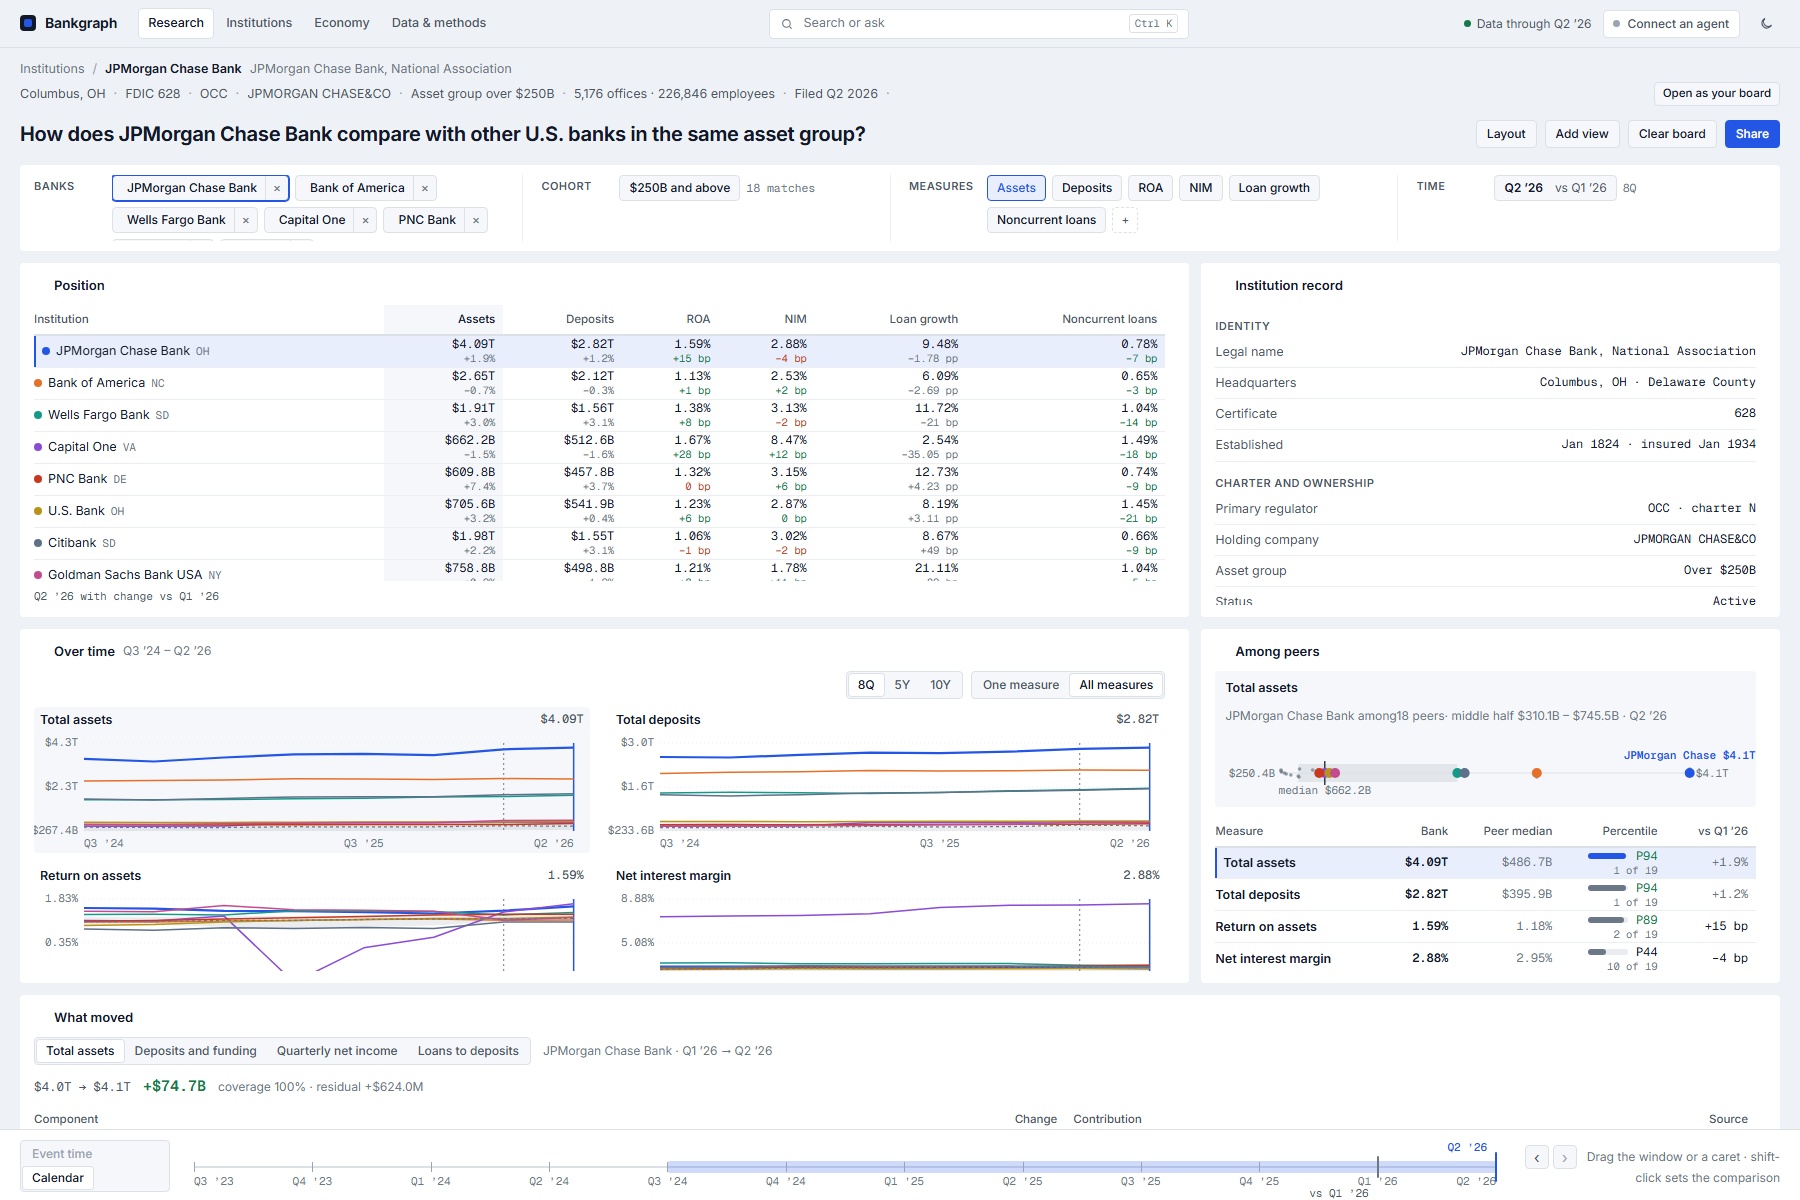
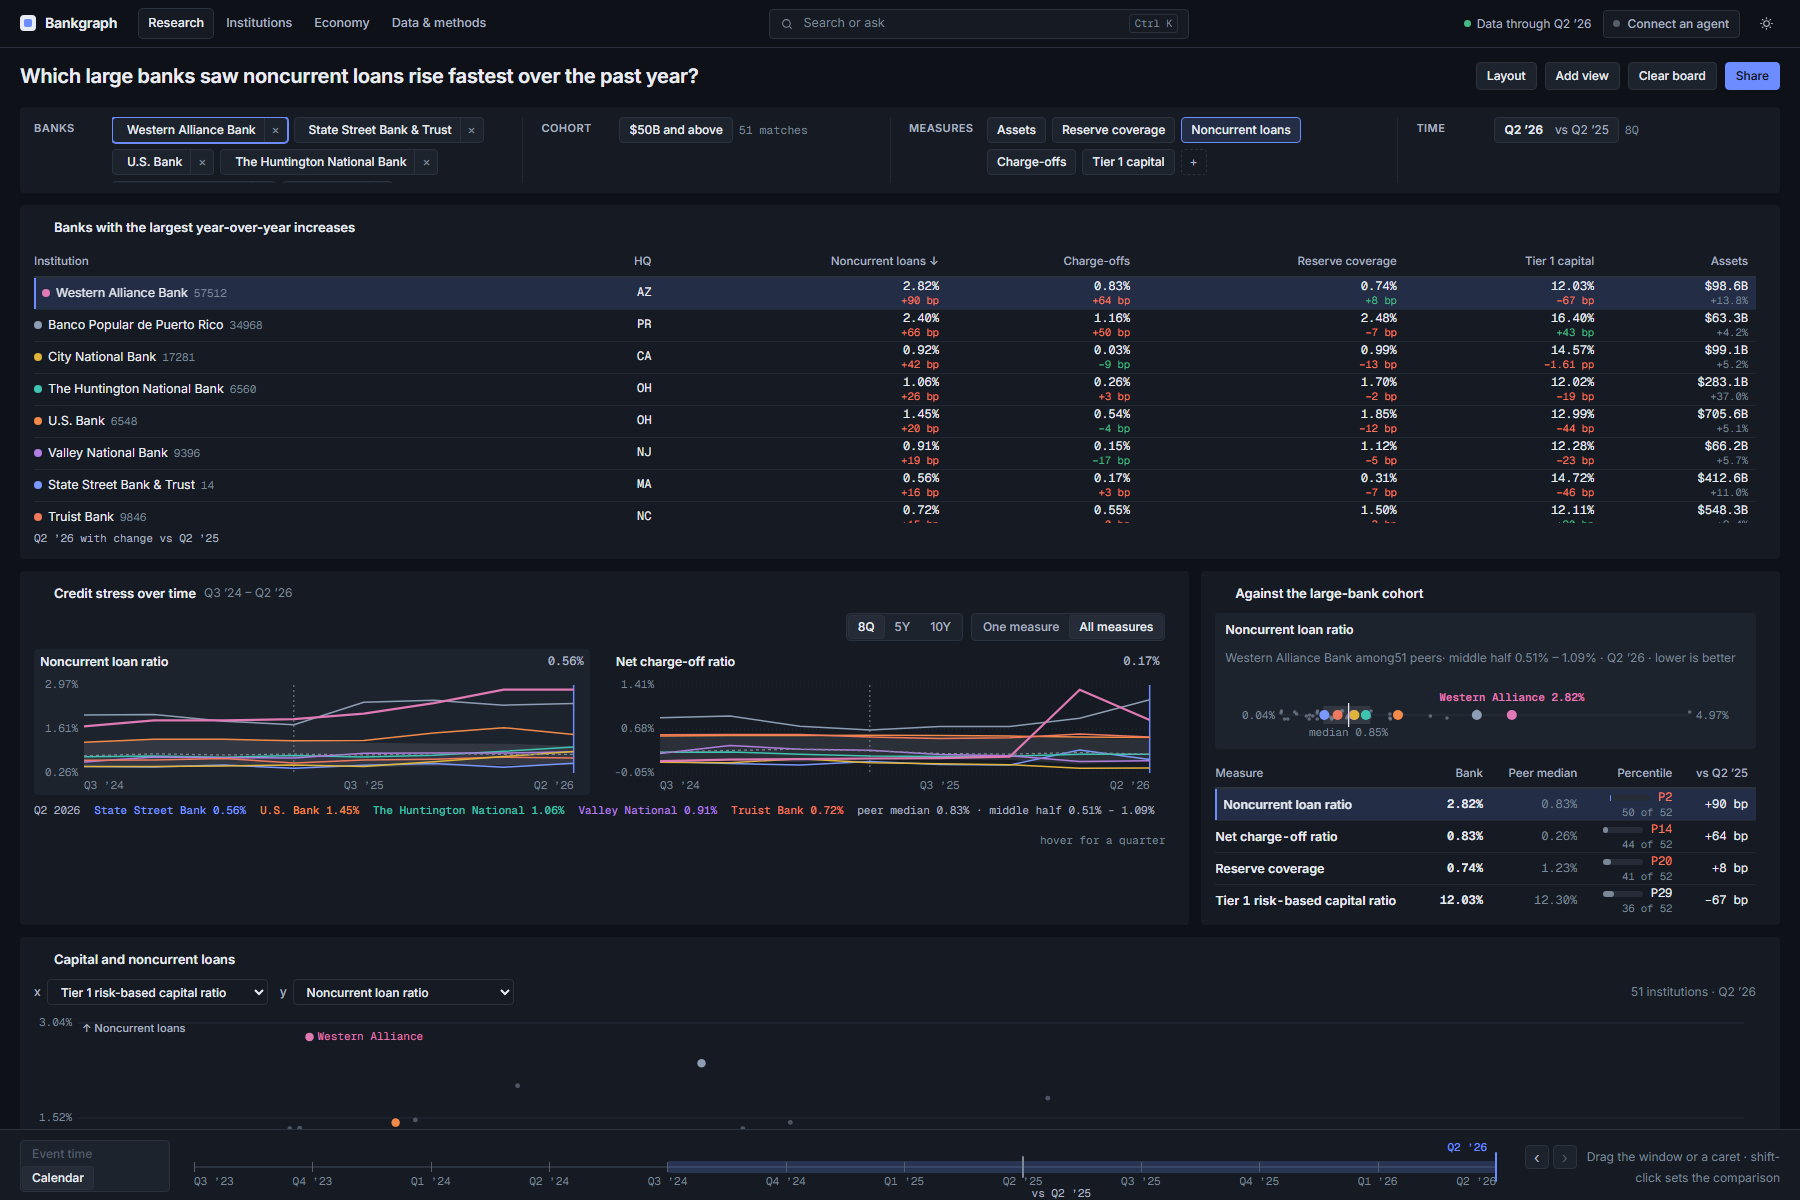
Trace what changed inside a bank, then see where it sits among comparable institutions.
-
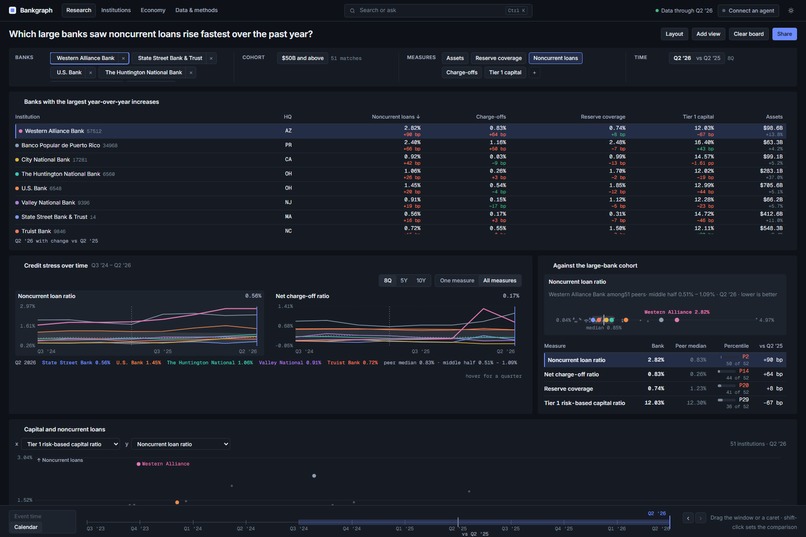
ChatGPT reads the exact data behind each view and continues from the board you change by hand.
About the project
A research surface for open data
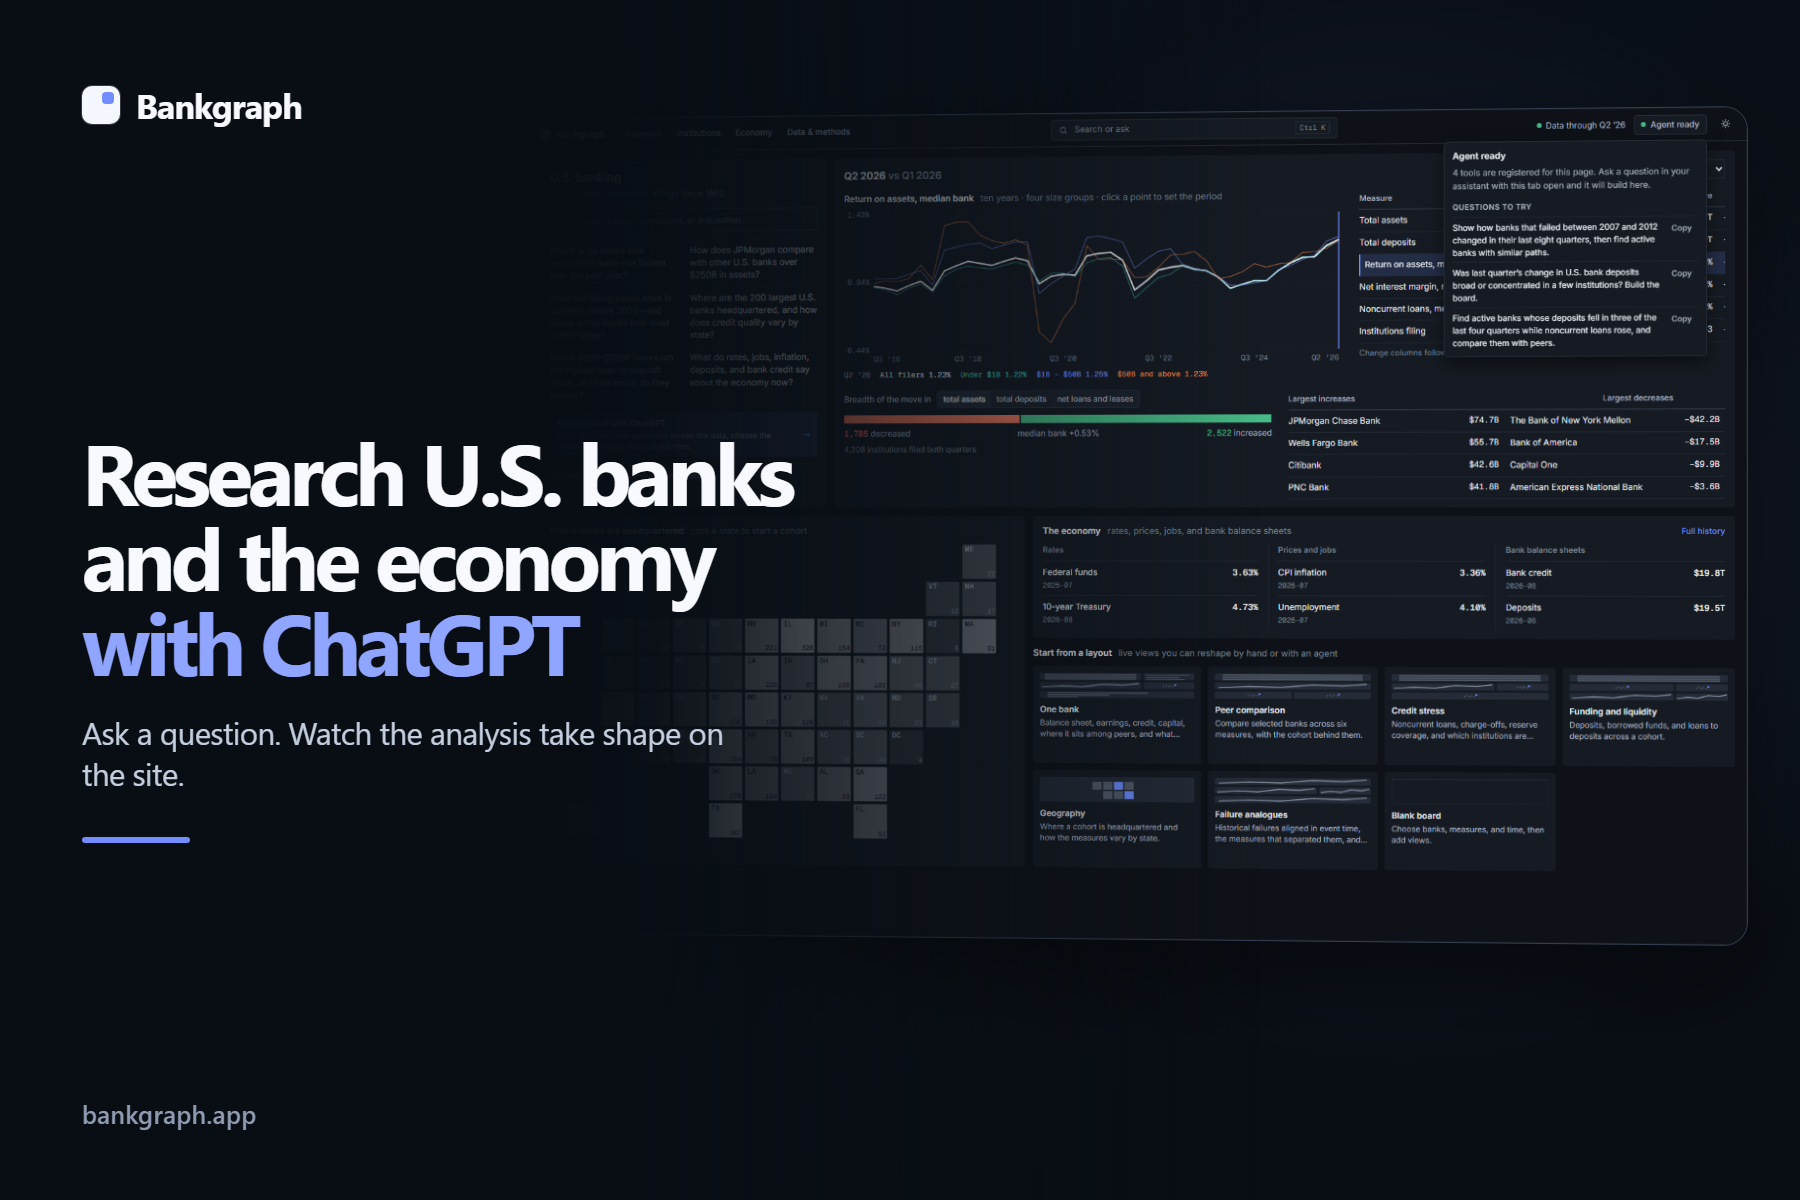
Bankgraph is my take on a Bloomberg-style research surface for public U.S. banking and economic data. Ask about an institution, the banking system, or the economy, and the work takes shape on a live board that you and ChatGPT can explore together.
The data already exists. Every U.S. bank files a detailed quarterly record, while rates, credit, inflation, employment, and banking-system series are published by public agencies. Using that record is harder than finding it. A question such as “Is this bank an outlier?”, “Was deposit growth broad or concentrated?”, or “What tended to change before banks failed?” can still require regulator APIs, quarterly archives, matched institution histories, and series that run on different calendars.
Bankgraph does that groundwork once. It brings FDIC institution records and financial filings together with official data from the U.S. Treasury, Bureau of Labor Statistics, and Federal Reserve Board. The reporting period, unit, definition, cohort, source, and coverage remain attached to the analysis.
From one bank to the economy
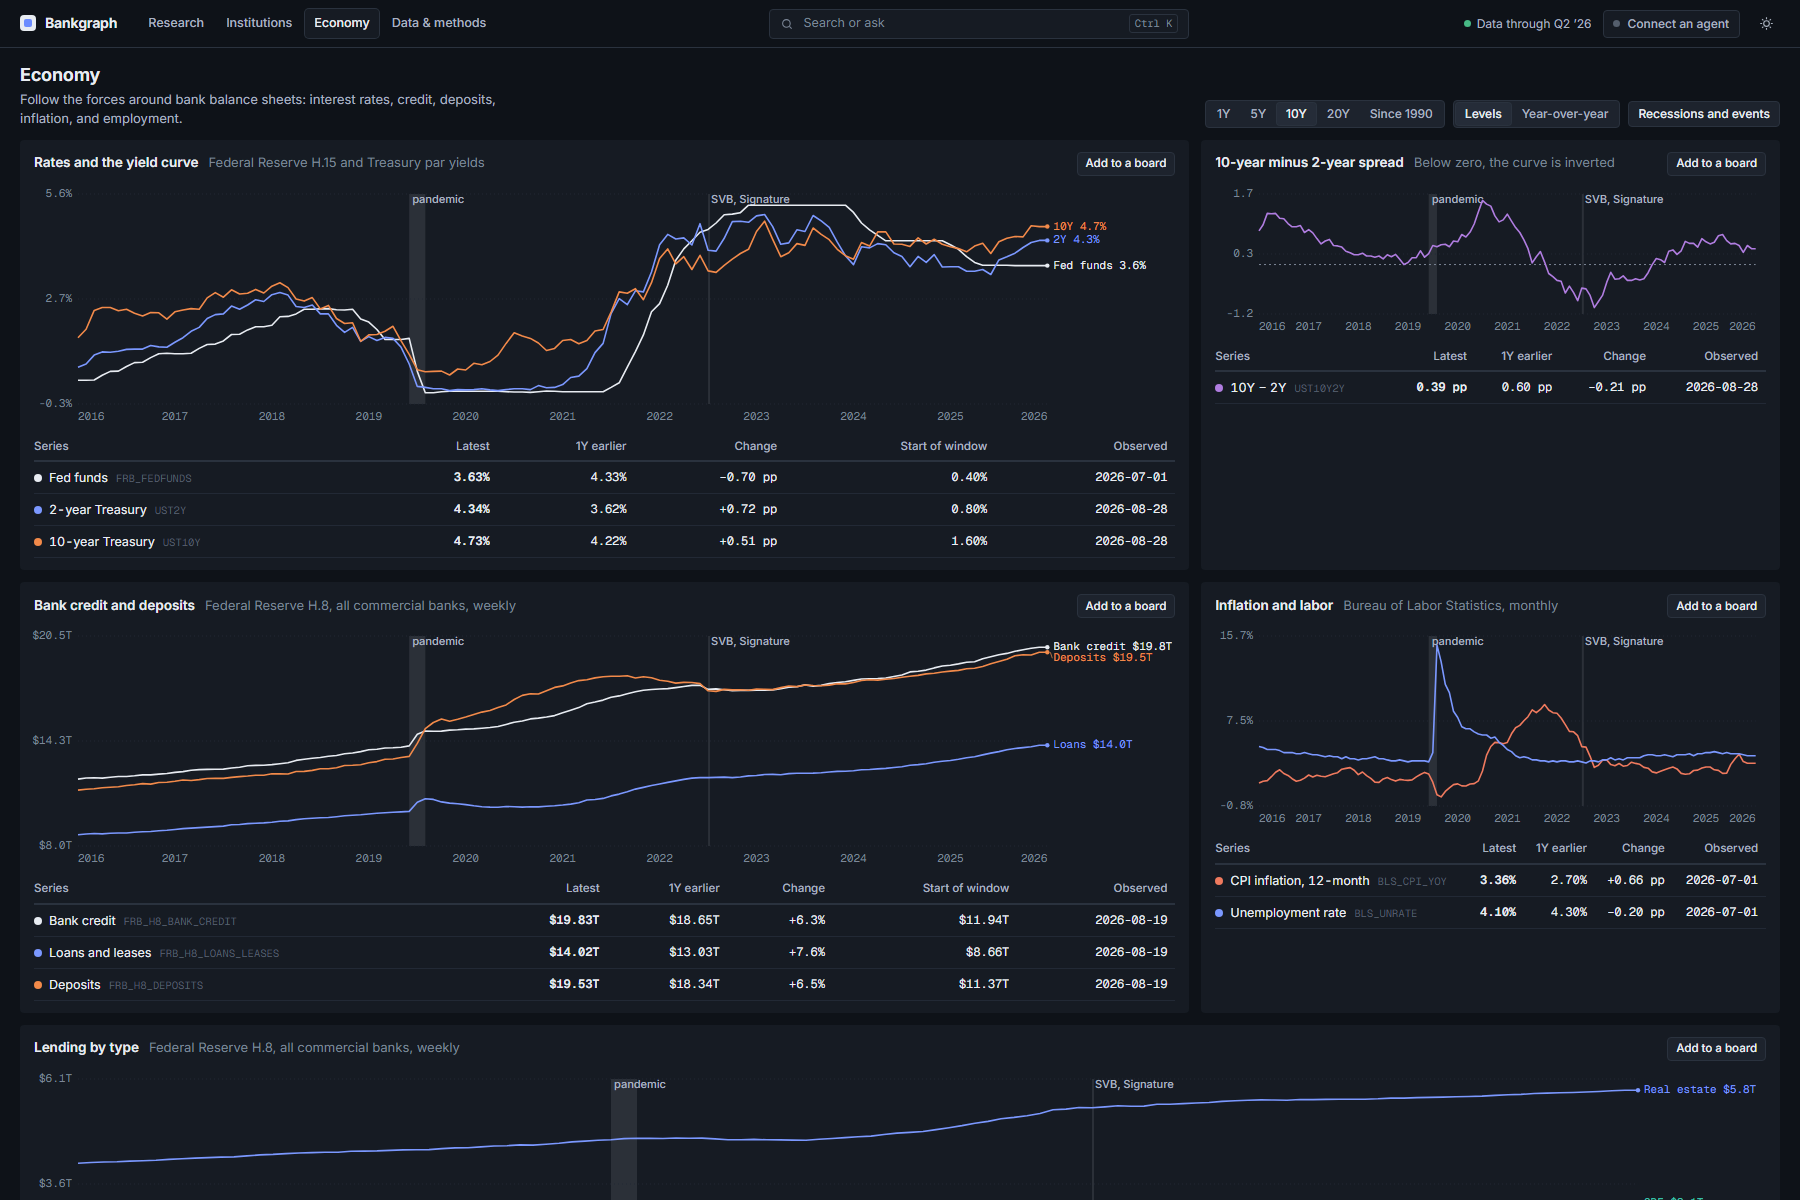
You can start with a familiar institution, compare it with a sensible peer group, and zoom out to the banking system. You can then place that behavior beside interest rates, credit, deposits, inflation, and employment. Or you can start without a bank name: describe a financial condition, screen the full population, and let the data determine which institutions belong on the board.
The board combines histories, exact tables, peer distributions, reported component changes, metric relationships, headquarters maps, economic context, and written takeaways. Its views share the same banks, measures, periods, and cohort, so a change made in one place carries through the analysis.
The same surface can help an analyst compare peers, a reporter test whether a headline trend is widespread, a researcher investigate the years before past bank failures, or someone simply understand what is happening at a familiar bank and in the economy around it.
ChatGPT works with you on the screen
Through WebMCP, ChatGPT operates Bankgraph directly. It can search institutions, define or revise a cohort, screen banks by financial measures, run multi-period and historical analyses, and arrange the results as charts, tables, maps, comparisons, and short takeaways on the site.
The workflow can begin with named banks or with an open-ended question. ChatGPT can compare JPMorgan Chase with its peers, add more banks on request, switch the interface to dark mode, and read the figures behind the updated board. It can also start from a condition such as a high loan-to-deposit ratio, find the relevant banks first, and build the comparison from those results.
The result remains a working Bankgraph board. You can change a bank, measure, period, chart treatment, or layout by hand, while ChatGPT reads and changes the same on-screen workspace. Each view provides structured data with reporting dates, definitions, units, cohort context, pagination, and source metadata, so ChatGPT can answer from the underlying values without interpreting a screenshot.
How it works
Bankgraph uses one workspace model for the visible interface and its WebMCP tools. Human and agent actions therefore operate on the same state and the same analytical vocabulary: institutions, measures, periods, cohorts, and views.
The analytical results are deterministic. Change attribution uses reported components and explicit formulas, cohort analysis reports its usable population, and historical series preserve missing values. This keeps quick answers tied to inspectable data while still allowing the board to change freely.
The application is built with SvelteKit, Svelte 5, TypeScript, and ECharts on Cloudflare Workers. D1, KV, and R2 support the application and its public-data pipeline.
What was difficult, and what I learned
The hardest part was making one workspace predictable while a person and an agent could both change it. Every analytical choice needed a visible meaning, every view needed a stable identity, and each agent action had to continue from the board as it stood.
Time was the other challenge. A quarterly balance, a year-to-date income field, a reported ratio, and a weekly banking-system series are different kinds of observations. Bankgraph carries their time basis, units, transformations, coverage, and source definitions through ingestion, analysis, display, and export instead of flattening them into one misleading timeline.
I also learned that useful WebMCP tools need to express analytical intent rather than mirror individual buttons. The tools can ask Bankgraph to construct a cohort, compare a set of institutions, or publish a result as an appropriate view. The visible interface still provides the controls needed to inspect and revise what the agent produced.
What I built during the challenge
Bankgraph’s public-data foundation predates the challenge. The product experience shown here—the shared Research board, its visual system, measure-led screens, multi-period and failure-pattern analyses, semantic board composition, structured reads behind every view, and the WebMCP system that connects them—was built during the submission period. Commit b852f9b records the pre-challenge baseline; the public history after it contains the complete extension.
Testing instructions for judges
Open bankgraph.app in ChatGPT’s in-app browser and keep the site visible beside the conversation. The live application needs no account, provider key, or local setup. Chrome with WebMCP testing enabled also works.
Start with:
“Compare JPMorgan Chase with Bank of America, Citi, and Wells Fargo.”
Once the board appears, say:
“Add Goldman Sachs, Morgan Stanley, and U.S. Bank. What’s the short version?”
Then try a question that begins with the data rather than a bank name:
“Start fresh. Which five active banks over $10 billion have the highest loan-to-deposit ratios? Build the comparison here.”
Ask ChatGPT to add loan growth or problem loans, change one view by hand, and continue the analysis. The board should reflect both the changes you make and the changes ChatGPT makes through WebMCP.
Built With
- chatgpt
- claude
- codex
- cursor
- d1
- echarts
- json
- kv
- node.js
- npm
- playwright
- r2
- svelte
- sveltekit
- typescript
- vitest
- webmcp
- workers
- wrangler


Log in or sign up for Devpost to join the conversation.