What is CineFlow?
Modern systems don't fail politely.
A production incident can begin with a single abnormal process, a memory leak, a runaway workload, or a performance bottleneck. Traditional monitoring can tell an engineer that something is wrong, but the engineer still has to investigate the logs, correlate traces, determine the root cause, decide what action to take, execute the remediation, and document what happened.
CineFlow is an autonomous SRE command center designed to close that loop.
It combines Grafana Cloud, Loki, Tempo, Grafana MCP, and Google Gemini into an automated incident response pipeline that moves from detection to diagnosis, remediation, and postmortem generation.
The Core Idea
CineFlow follows a simple operational loop:
Detect → Investigate → Reason → Remediate → Learn
When an incident occurs:
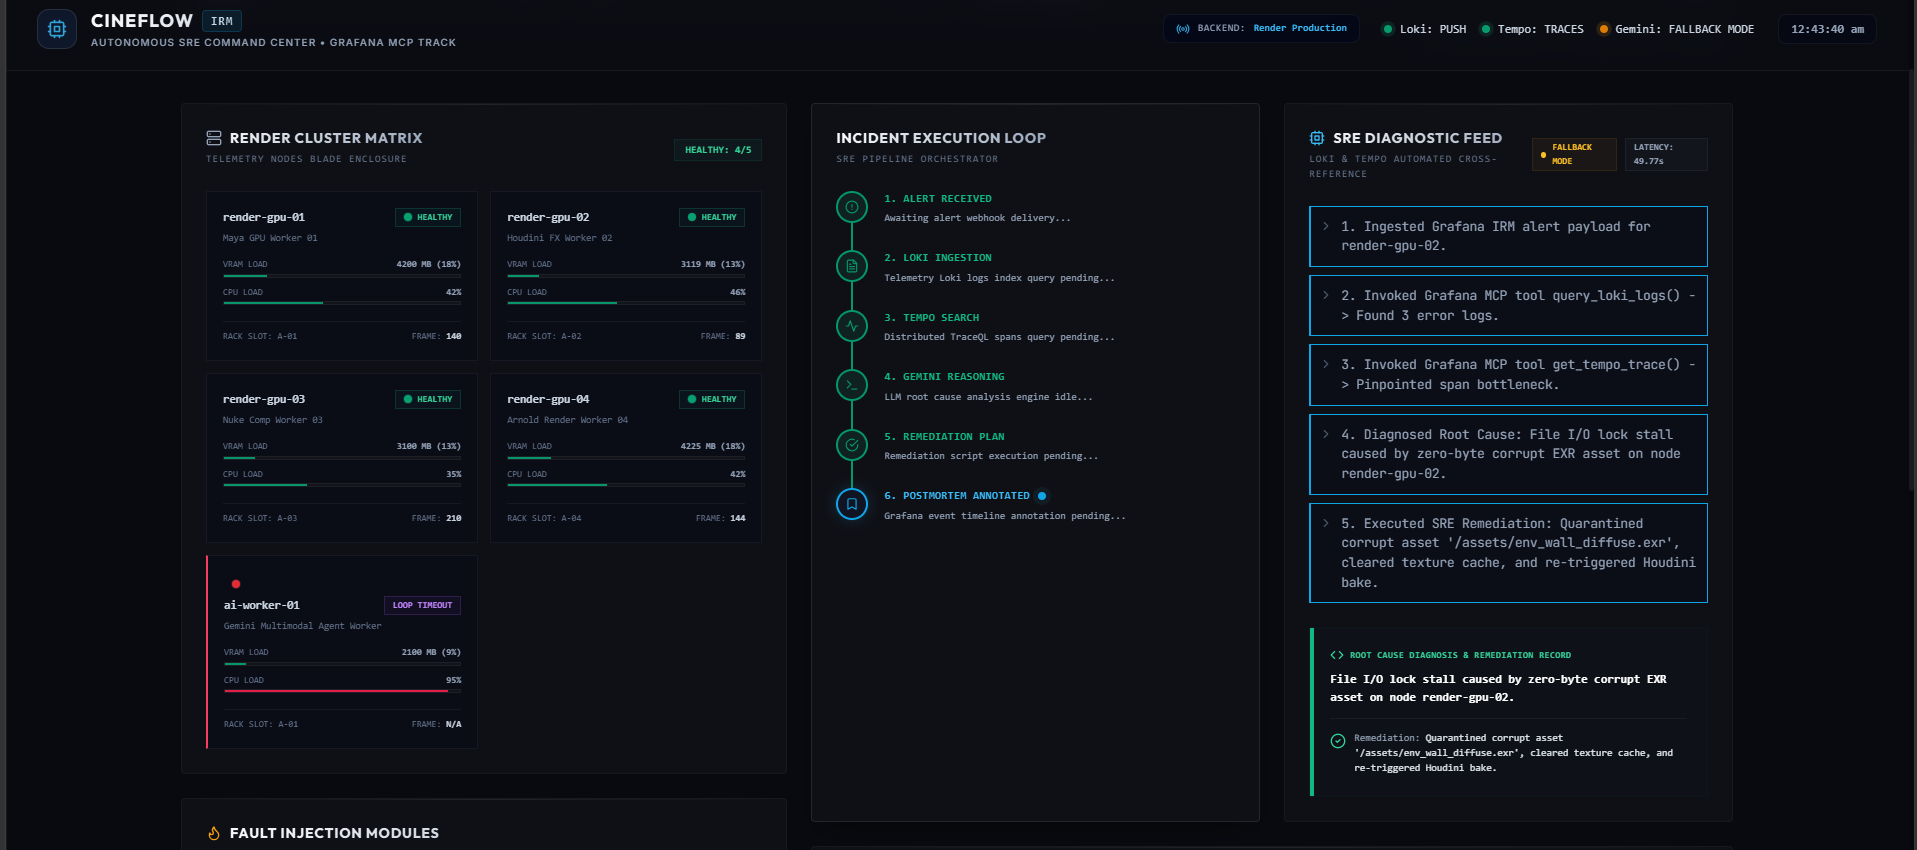
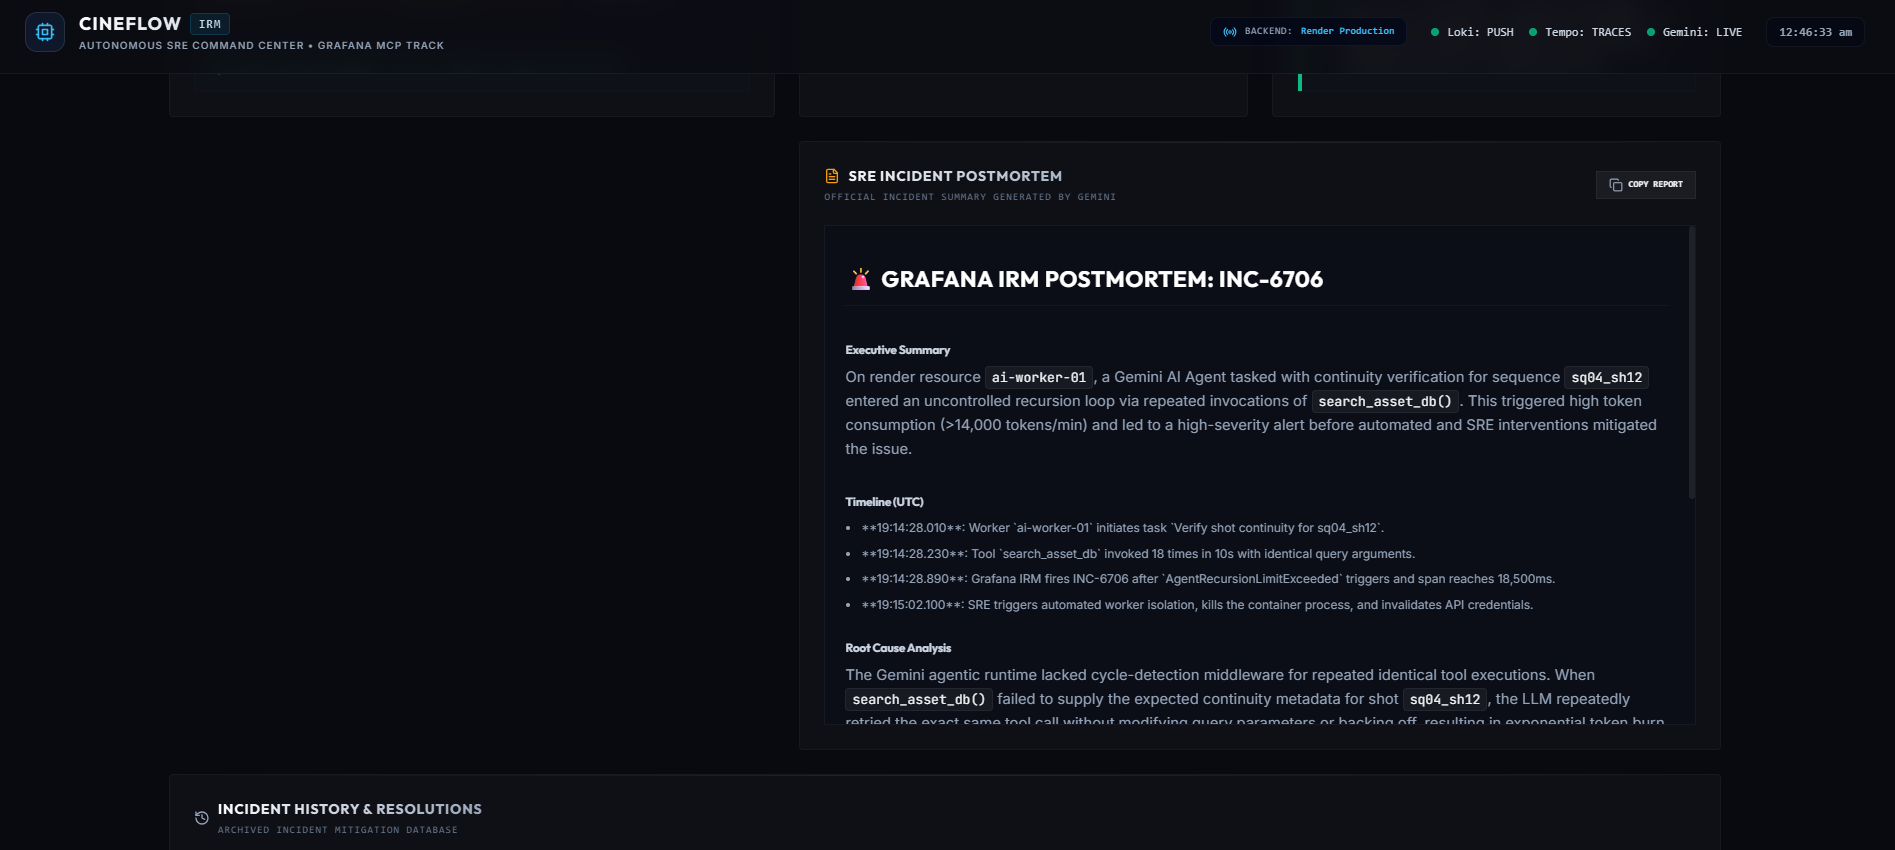
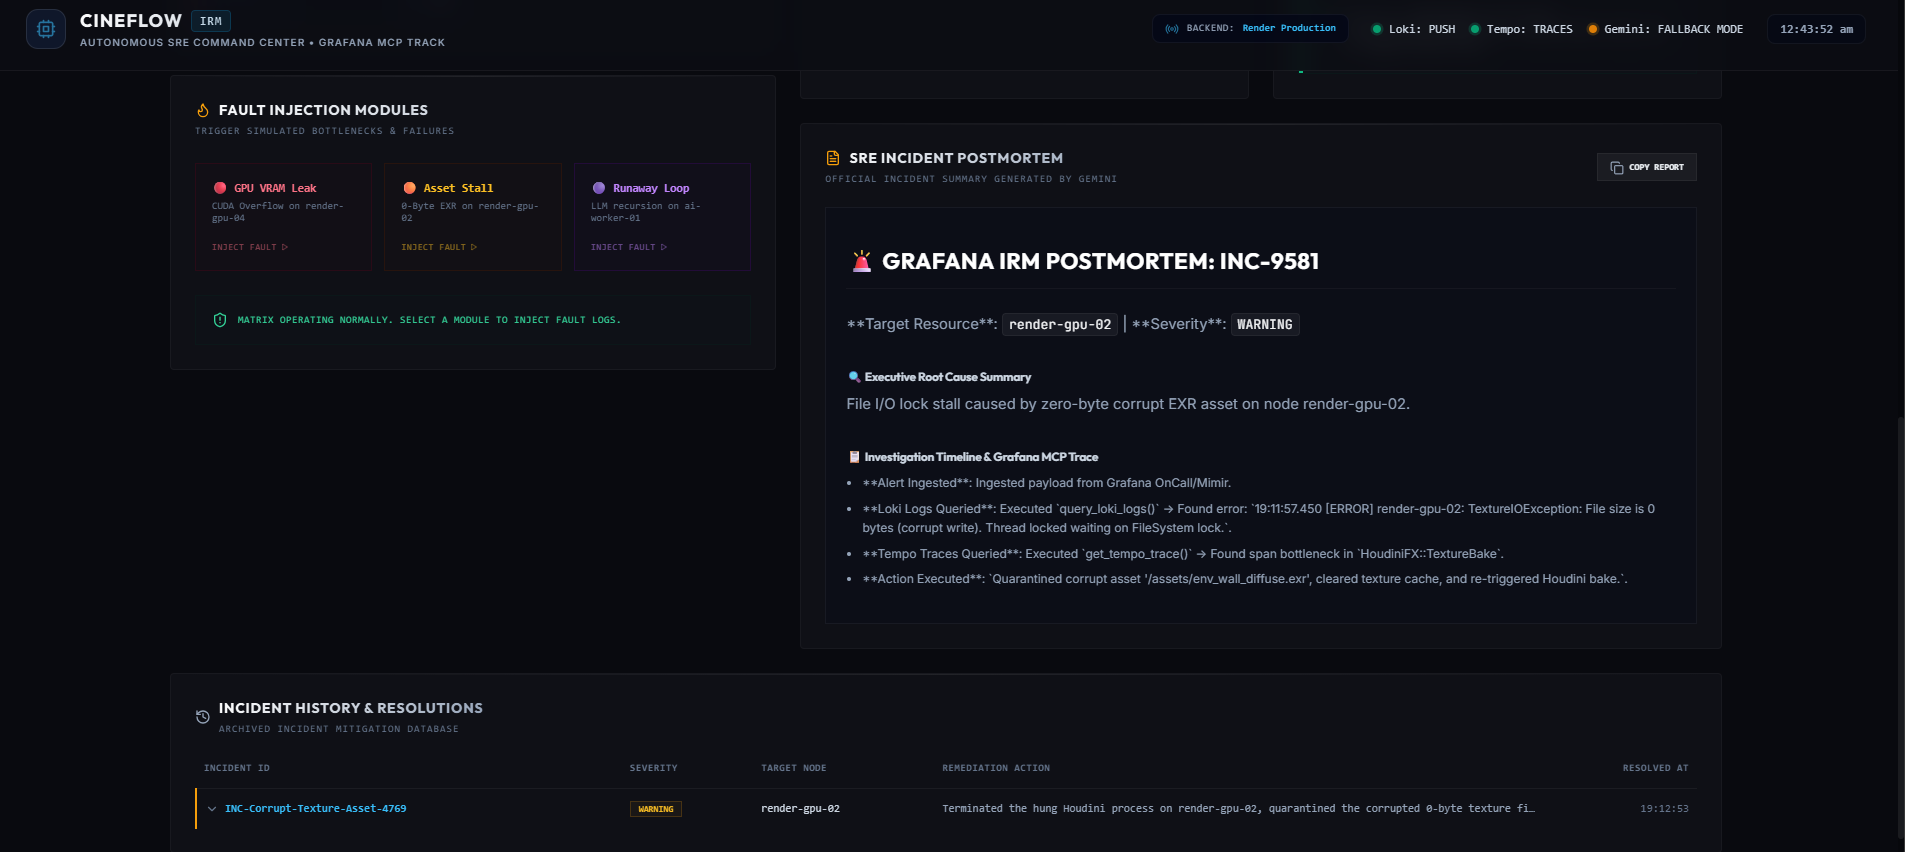
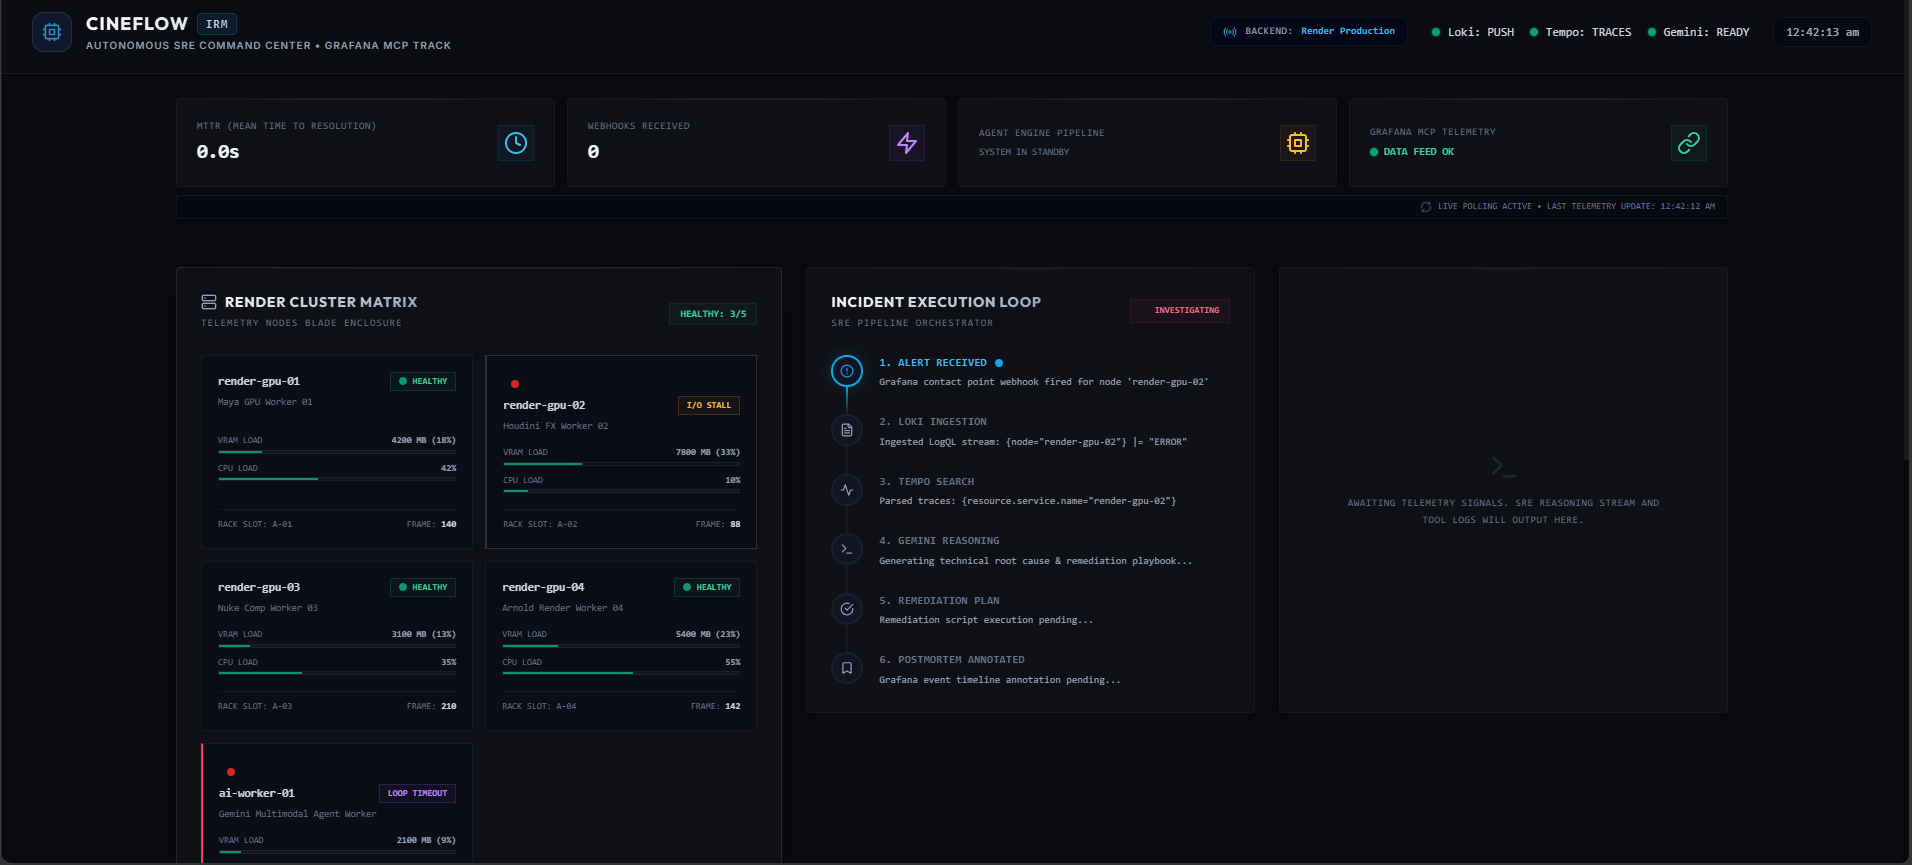
Detect Grafana alerts detect abnormal system behavior. Alerts are delivered to CineFlow through a webhook. Investigate CineFlow queries Grafana Loki to inspect relevant application and infrastructure logs. It queries Grafana Tempo to identify trace bottlenecks and understand where latency or failures originated. Grafana MCP provides the observability interface that allows the system to work with this telemetry programmatically. Reason The collected evidence is passed to the AI reasoning layer powered by Google Gemini. CineFlow correlates alert information, logs, traces, and system context to determine a likely root cause rather than simply reporting the symptom. Remediate Based on the diagnosis, CineFlow selects and executes an appropriate remediation action. The system records the action and its result as part of the incident lifecycle. Learn CineFlow automatically generates a structured incident postmortem containing the root cause, impact, investigation evidence, and remediation. This creates a persistent operational record that can be used for future incidents. What We Built
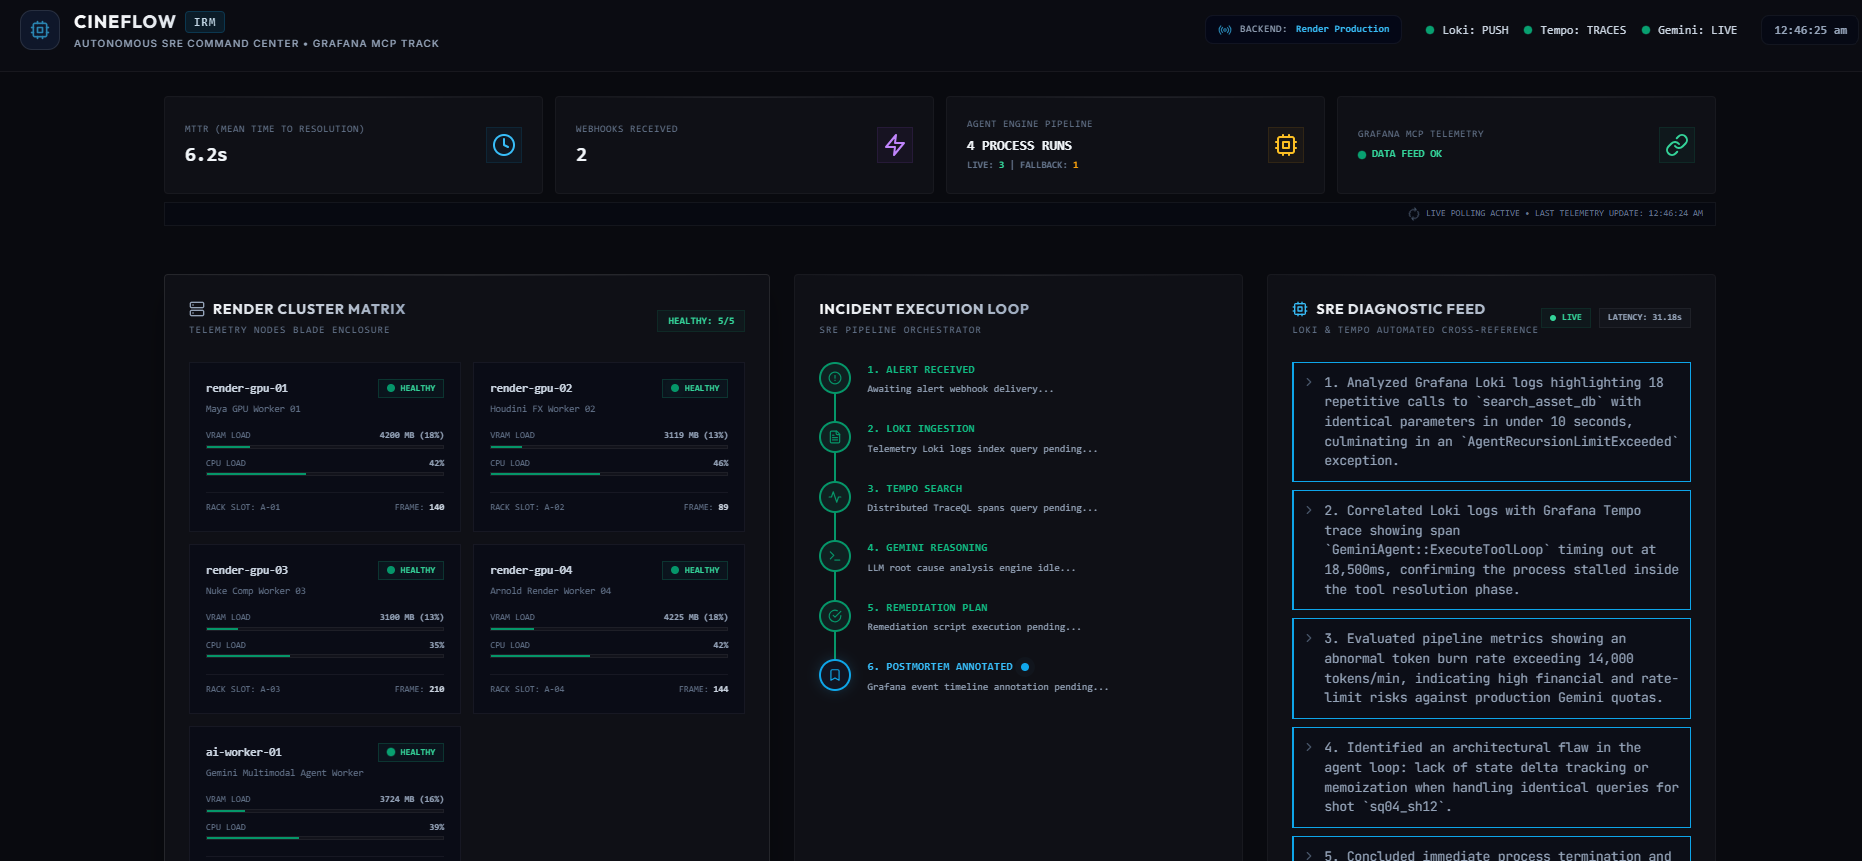
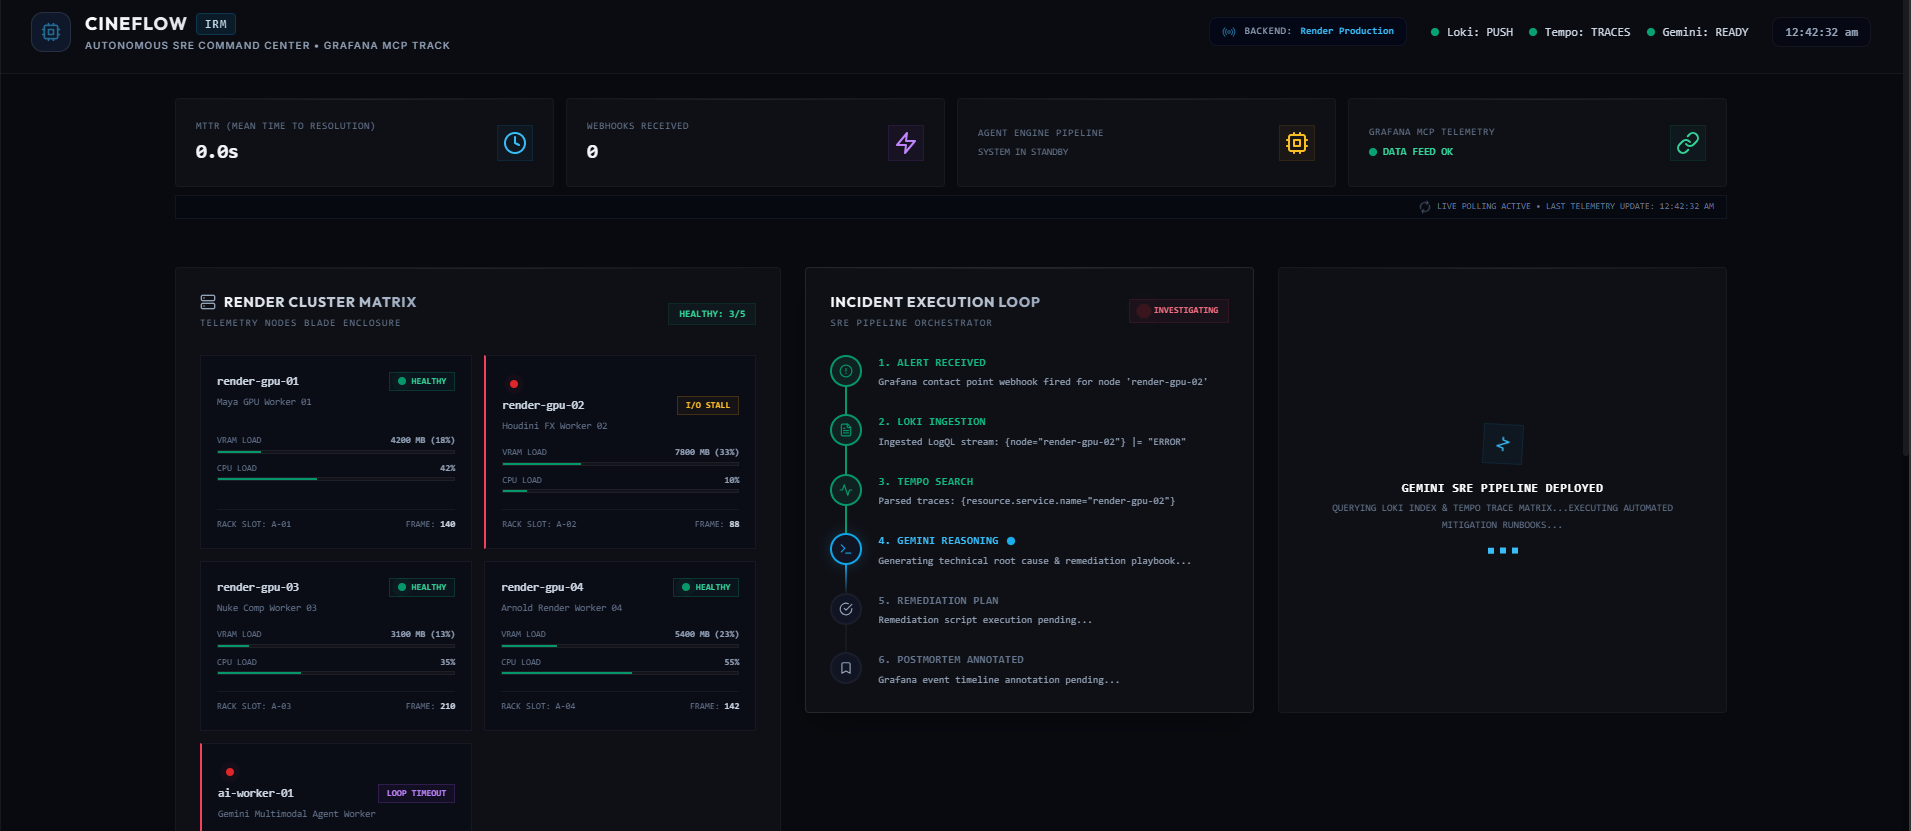
The project consists of a production-style web dashboard backed by a FastAPI incident response engine.
Autonomous Incident Response
CineFlow can receive Grafana alerts and initiate an incident execution pipeline automatically rather than requiring an engineer to manually start an investigation.
The system tracks incident state, execution progress, diagnostic findings, remediation, and postmortem generation in one interface.
Grafana-Powered Observability
Grafana is not just being used as a visualization layer.
CineFlow actively uses:
Grafana Cloud for observability infrastructure Grafana Loki for log investigation Grafana Tempo for distributed trace analysis Grafana MCP to connect the autonomous agent with observability data
This allows the agent to investigate an incident using actual telemetry instead of relying only on predefined assumptions.
AI Root-Cause Analysis
Gemini is used to reason over the evidence collected from the observability stack.
For example, during a simulated runaway AI-worker incident, CineFlow was able to identify excessive multi-agent tool execution as the root cause and produce a remediation plan involving process termination, recursion-depth adjustment, and queue recovery.
Automated Remediation
CineFlow goes beyond recommending what an engineer should do.
The remediation stage can execute predefined recovery actions against simulated infrastructure and record the result as part of the incident.
This creates a complete closed-loop workflow:
Alert → Evidence → Diagnosis → Action → Verification → Postmortem
Incident Deduplication
Production alert systems can repeatedly deliver the same firing alert.
CineFlow therefore tracks Grafana alert identity using alert fingerprints and prevents the same alert instance from creating multiple incident executions.
This helps keep the incident history clean and prevents repeated remediation for the same underlying event.
Example Incident
One of the simulated incidents is a GPU VRAM leak affecting a rendering node.
The workflow is:
GPU fault injected → Grafana alert → CineFlow webhook → Loki investigation → Tempo investigation → AI root-cause analysis → automated remediation → postmortem
The dashboard exposes the complete execution flow so the incident can be followed from the initial alert through recovery.
Why We Built It
We wanted to explore what happens when observability systems become part of an autonomous operational agent rather than remaining passive dashboards.
An engineer should not have to manually jump between an alerting system, log explorer, tracing system, terminal, incident document, and postmortem template every time a predictable failure occurs.
CineFlow brings those steps into a single automated loop while keeping the investigation evidence and remediation history visible.
Challenges
The hardest part was not generating an AI response. It was making the entire system behave reliably as an operational workflow.
We had to handle:
Real-time Grafana webhook ingestion Log and trace correlation Long-running incident processing without blocking webhook responses Fault simulation and remediation Duplicate alert protection Incident state management AI reasoning and fallback behavior Communication between the frontend, backend, Grafana Cloud, and deployed infrastructure Reliable production deployment across Vercel and Render
A particularly important lesson was that an autonomous SRE system needs to be fault-tolerant itself. A webhook should return quickly, repeated alerts should not trigger repeated actions, and every stage of the incident pipeline needs to have a predictable state.
What We Learned
Building CineFlow taught us that autonomous operations is fundamentally an integration problem.
The value does not come from any single component. Grafana provides the telemetry, Loki provides logs, Tempo provides traces, Gemini provides reasoning, and the incident engine provides orchestration and action.
Together, they create something much more useful than any individual component:
an operational feedback loop that can detect, understand, act, and document.
What's Next
Future versions of CineFlow could expand the remediation layer with additional infrastructure actions, stronger approval and safety controls for high-impact operations, richer historical incident analysis, and adaptive remediation policies based on previous incidents.
Our goal is to move toward an SRE system where engineers spend less time performing repetitive incident-response procedures and more time solving the problems that actually require human judgment.
Built With
- fastapi
- google-gemini
- grafana
- grafana-loki
- grafana-mcp
- grafana-tempo
- javascript
- ngrok
- observability
- opentelemetry
- prometheus
- python
- react
- rest-api
- sre
- tailwindcss
- vite


Log in or sign up for Devpost to join the conversation.