-
-
This is our user experience designed to look familiar since many people use Google.
-
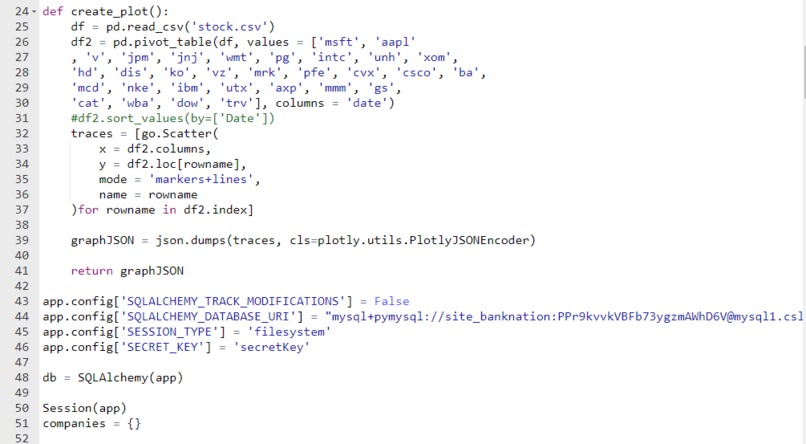
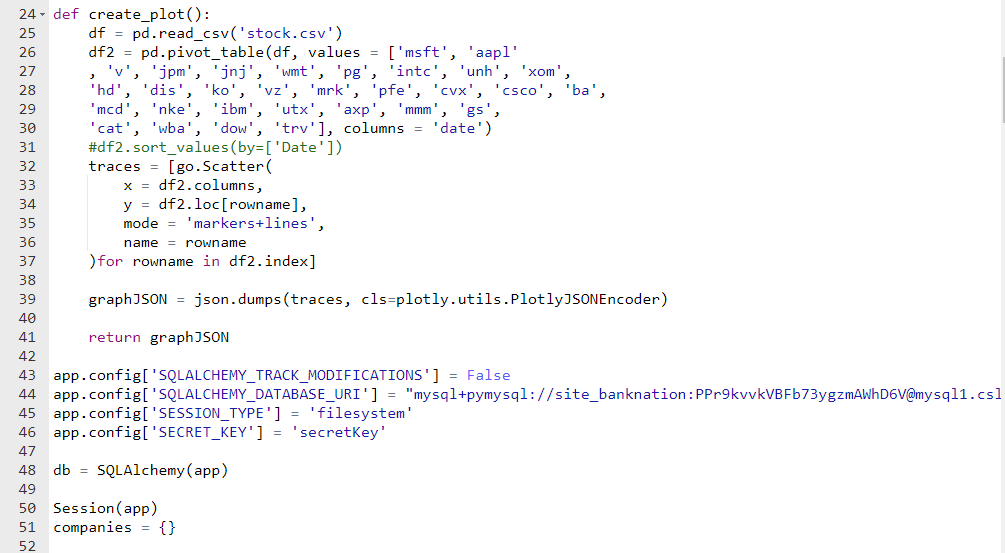
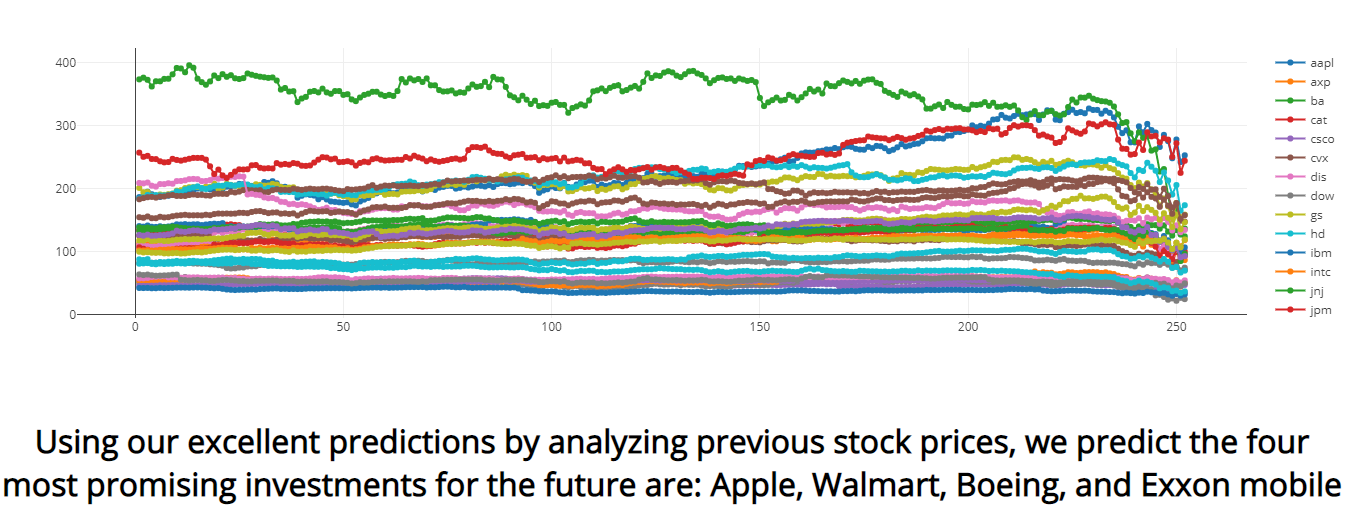
Creating the graphics for each of the stock prices.
-
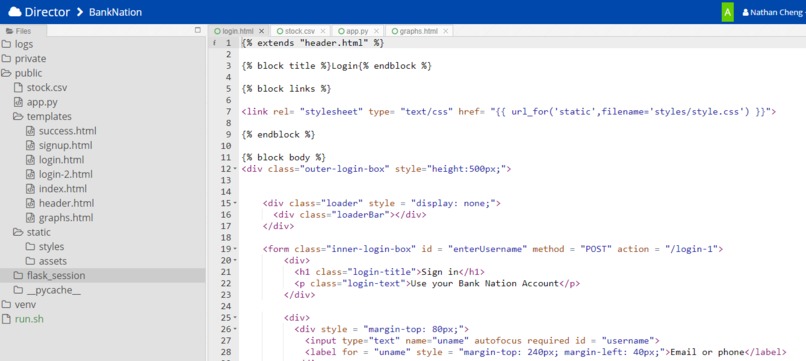
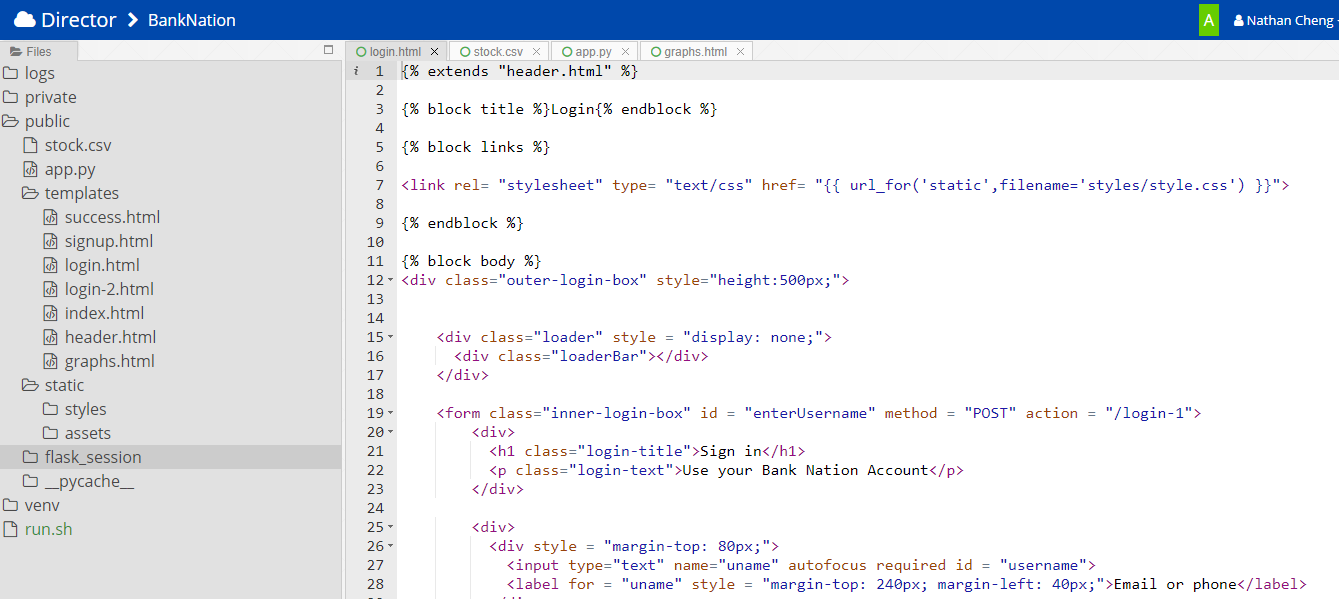
Great user design experience
-
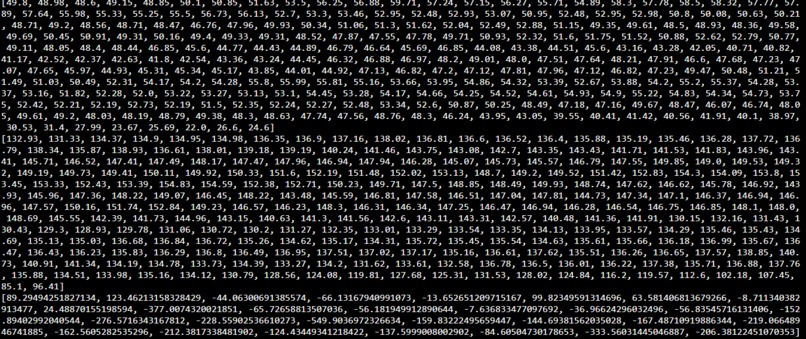
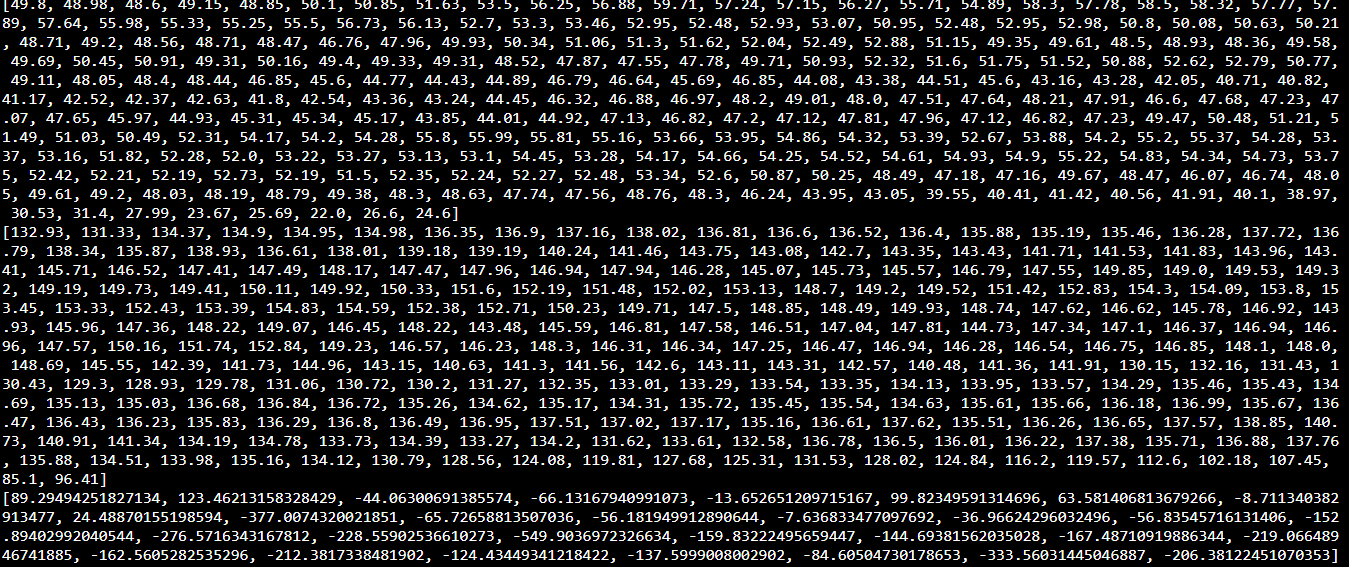
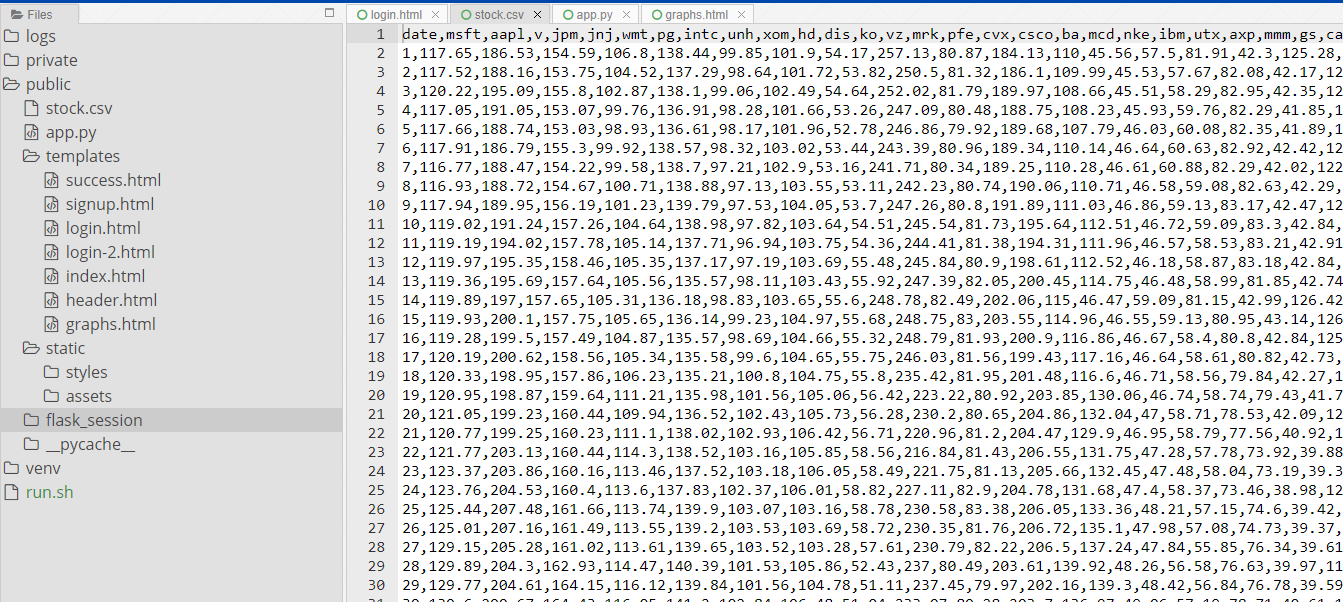
The data we used for machine learning and predictions
-
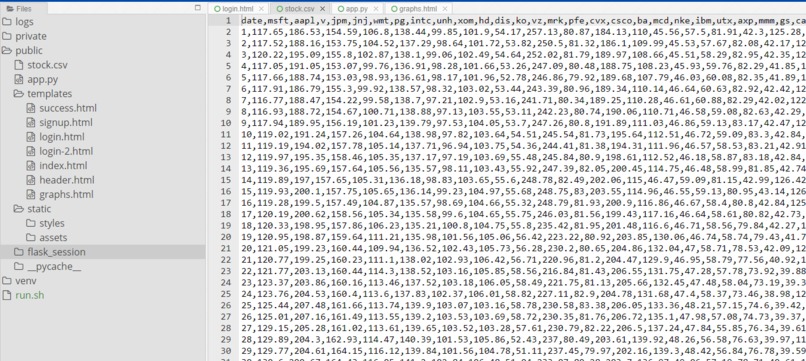
The original data generated.
-
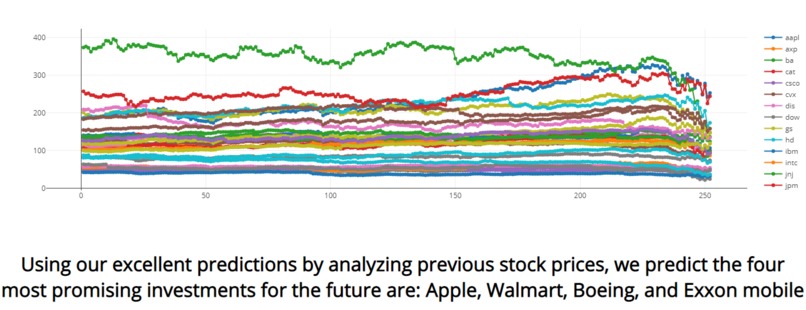
The actual graphs using plotly.
-

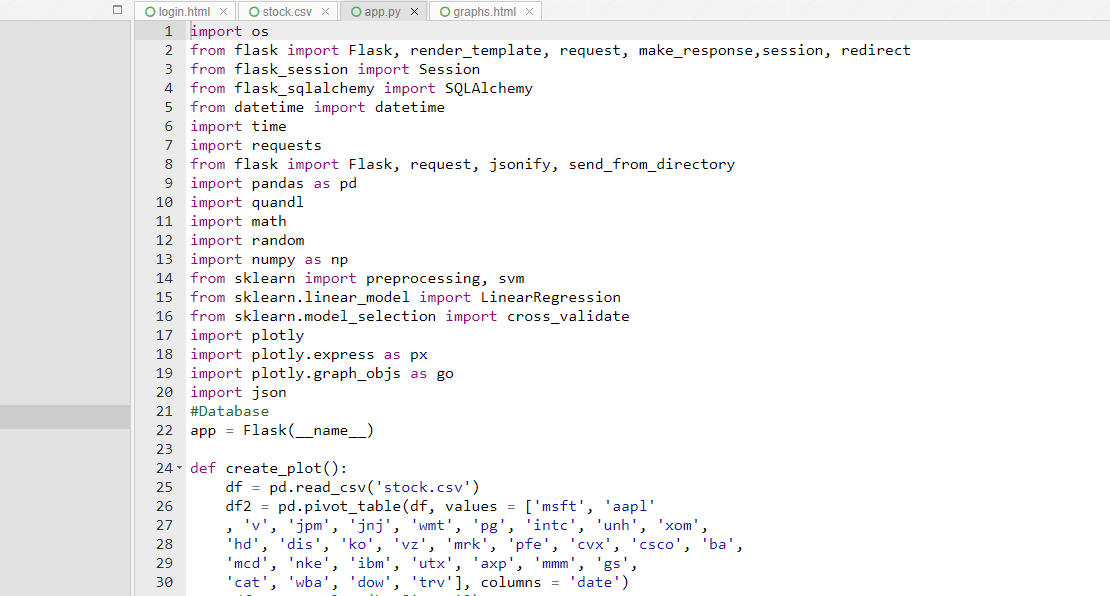
All the libraries we used.
-
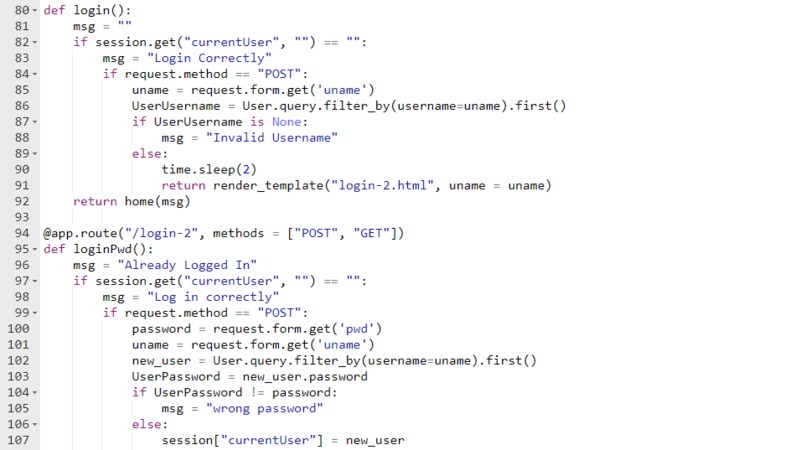
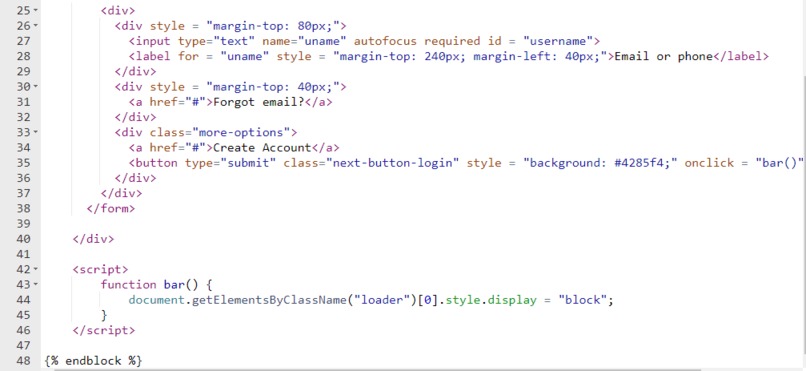
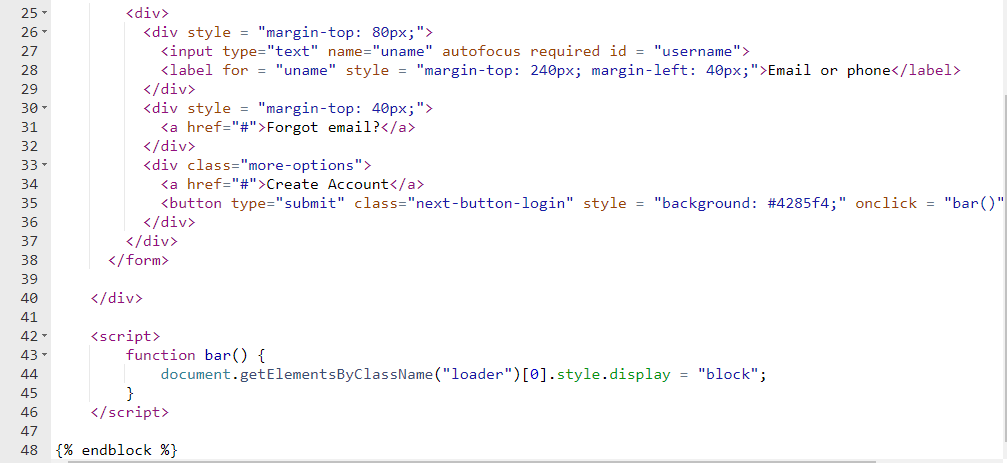
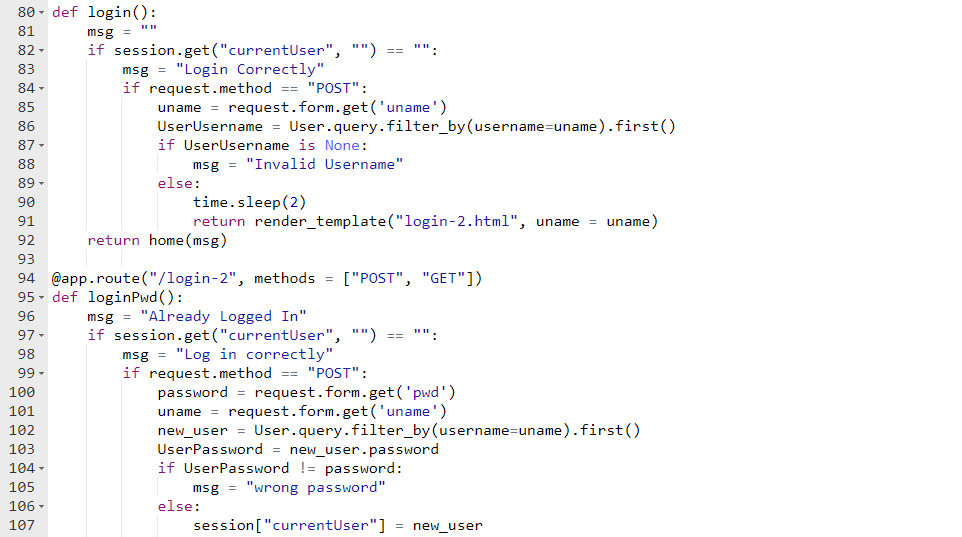
Our complex login system.
-
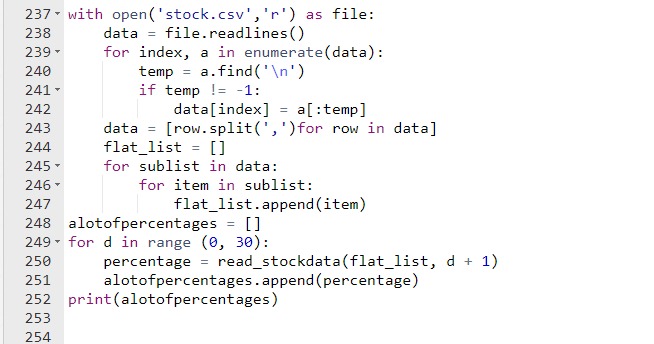
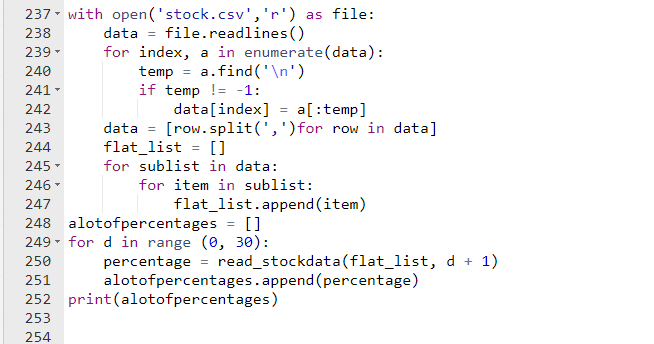
Reading the data.
Inspiration
I asked my teammate what he wanted to do, and he said something about the stock market. This was also inspired by our previous conversation during this quarantine time about him trading his parents wealth.
What it does
There is a simple login system complete with logout and account creation. We created graphs to visualize the data, and we also used a bit of machine learning to figure out and find out the most promising future stocks.
How We built it
We used Thomas Jefferson High School's Director application to code and execute our application.
Challenges we ran into
We realized that director was not real time collaboration, and so all the work I did, was lost when my partner forgot to reload the page before editing. In addition, we are both Freshman at TJHSST and have lost half of our CS experience.
Accomplishments that we are proud of
This is the first hackathon both of us have competed in.
What I learned
We gained experience in coding and utilizing the various libraries Python has to offer. We also found a few promising stocks to invest in for the future.
IF YOU DONT WANT TO MAKE ACCOUNT, USE andrei FOR BOTH EMAIL AND PASSWORD

Log in or sign up for Devpost to join the conversation.