-
-
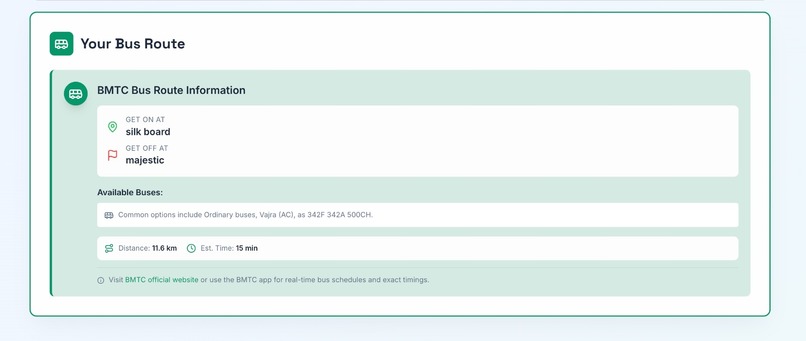
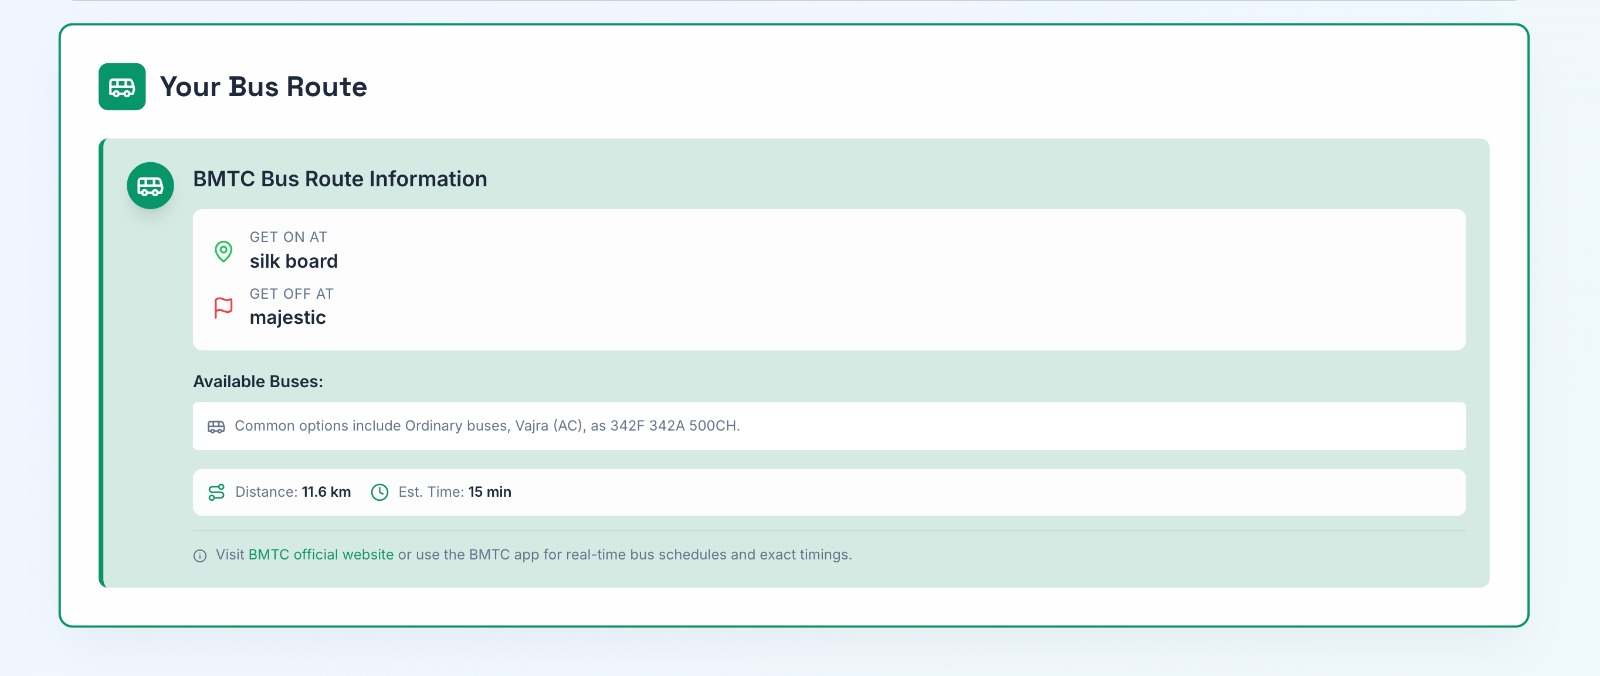
way to reach destination
-
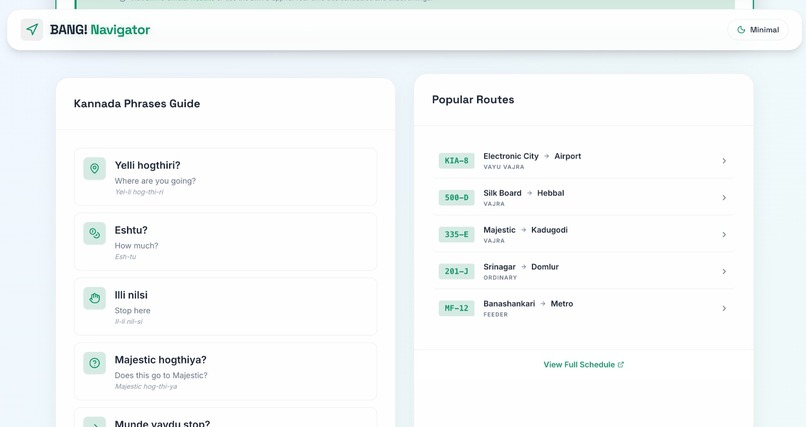
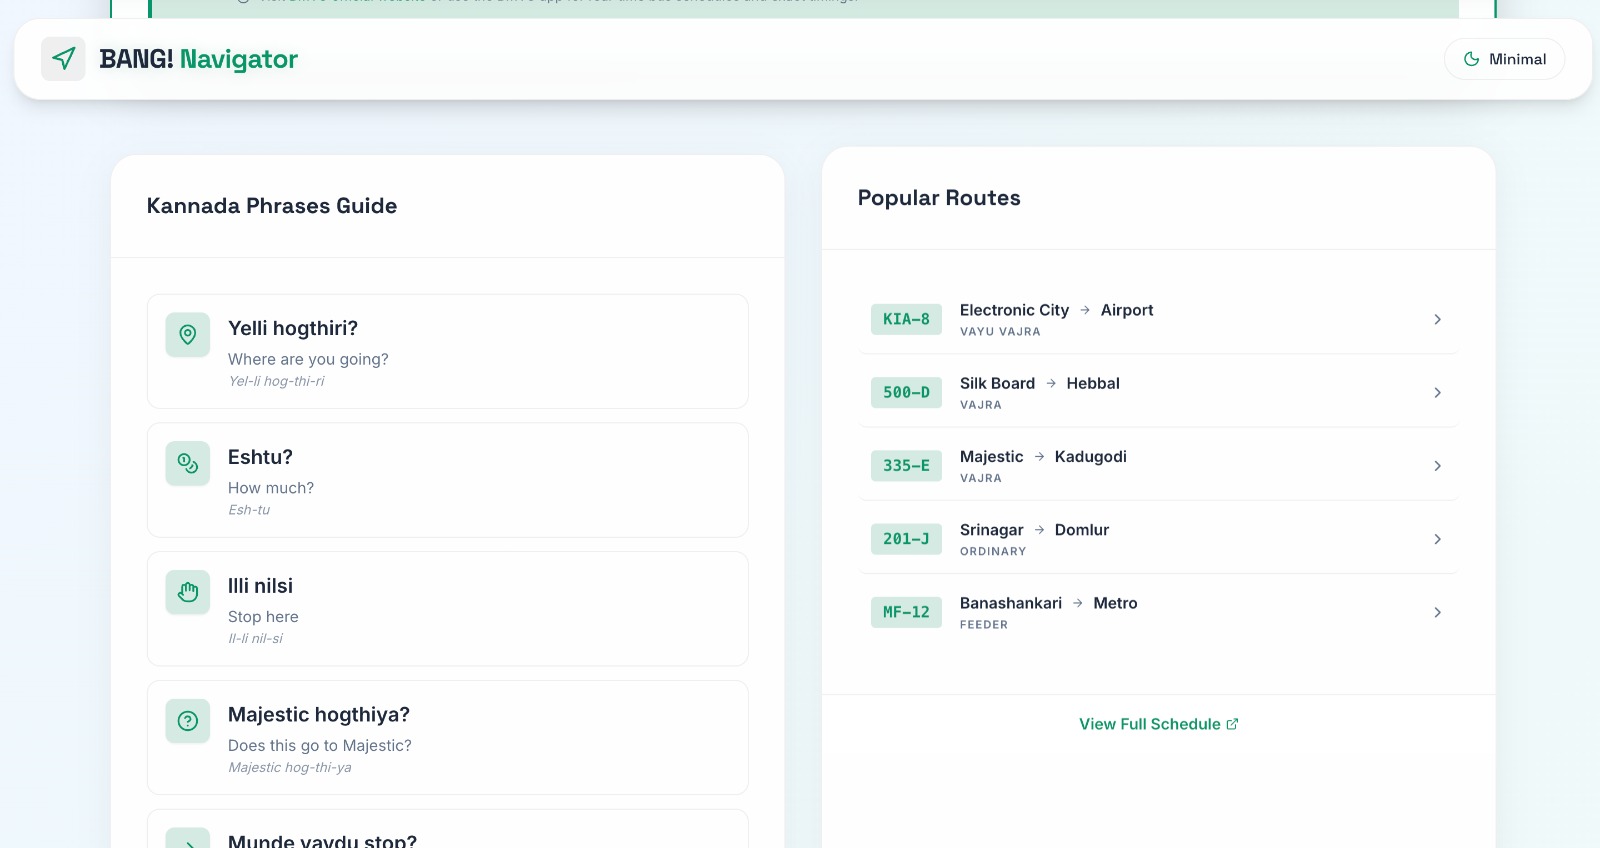
common phrases and popular routes
-
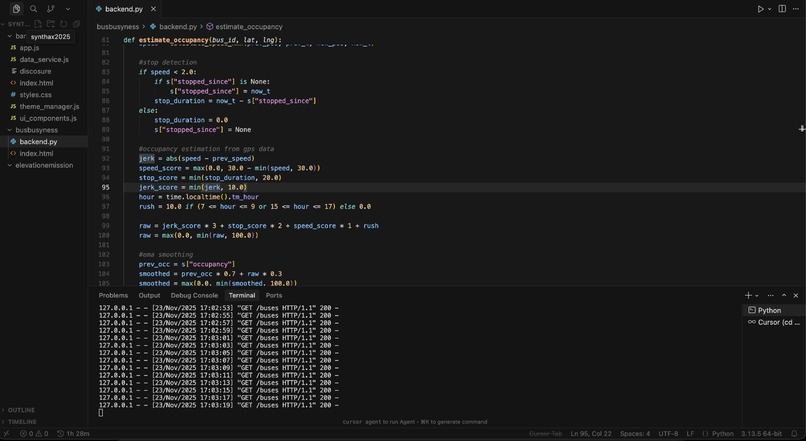
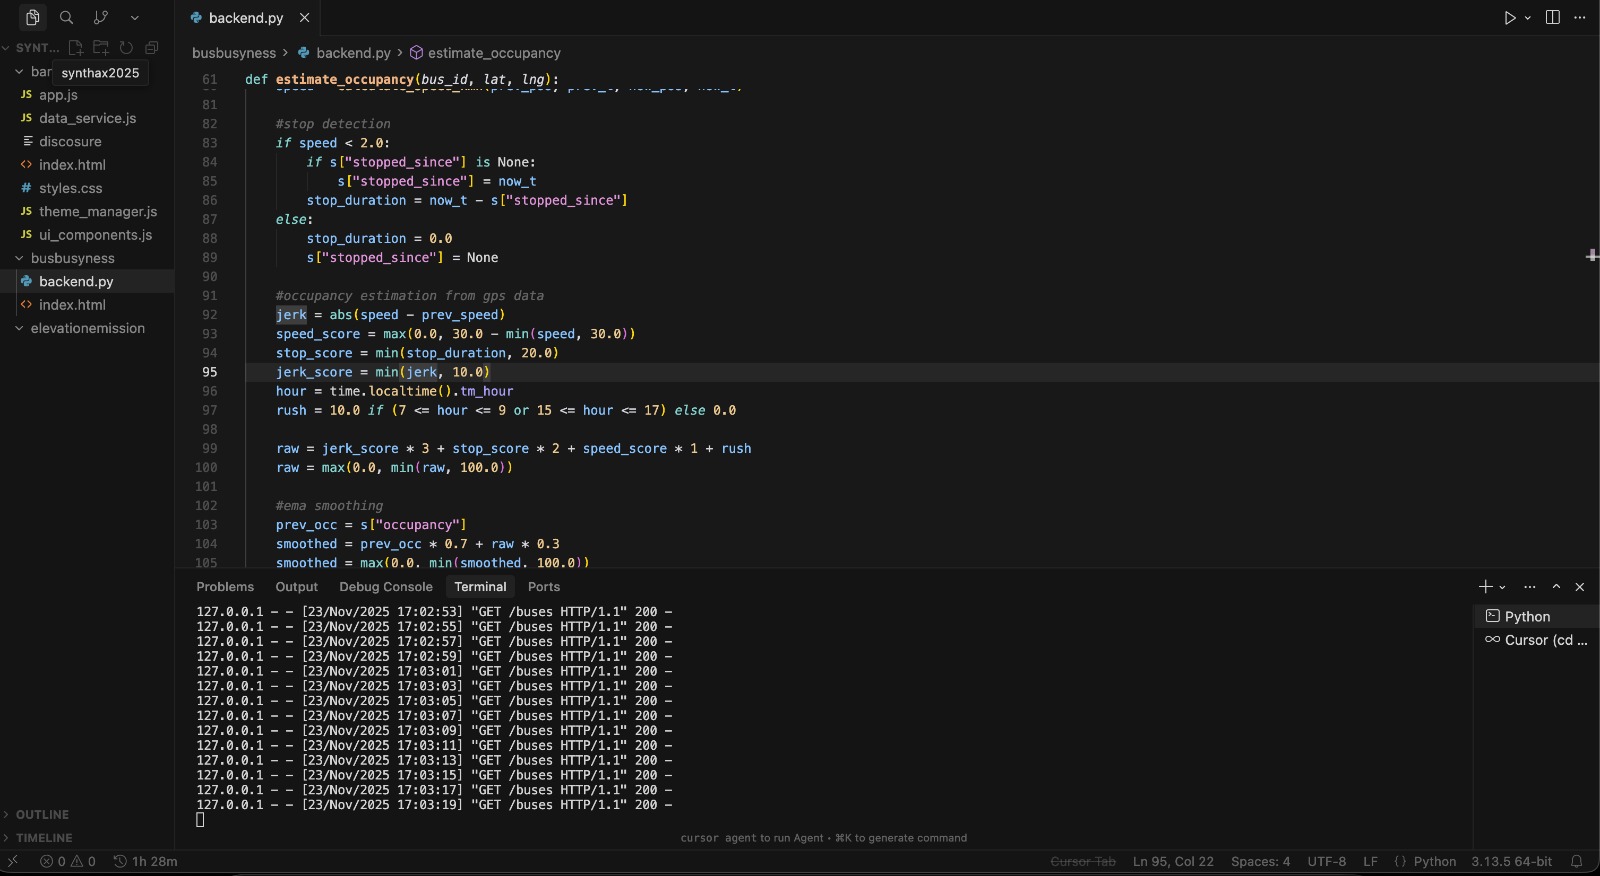
python backend
-
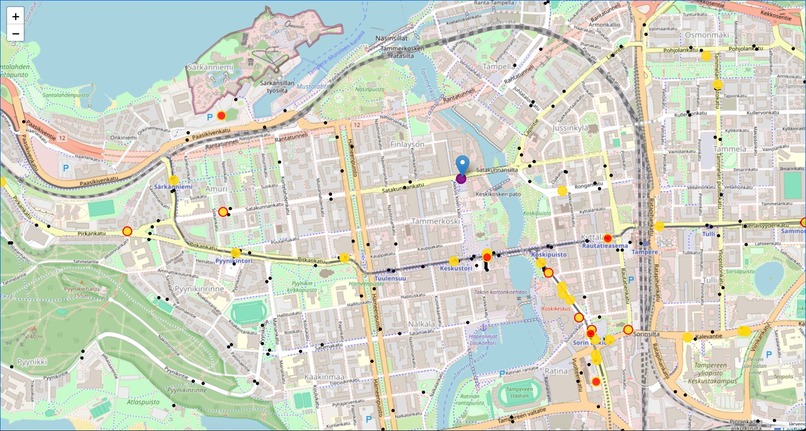
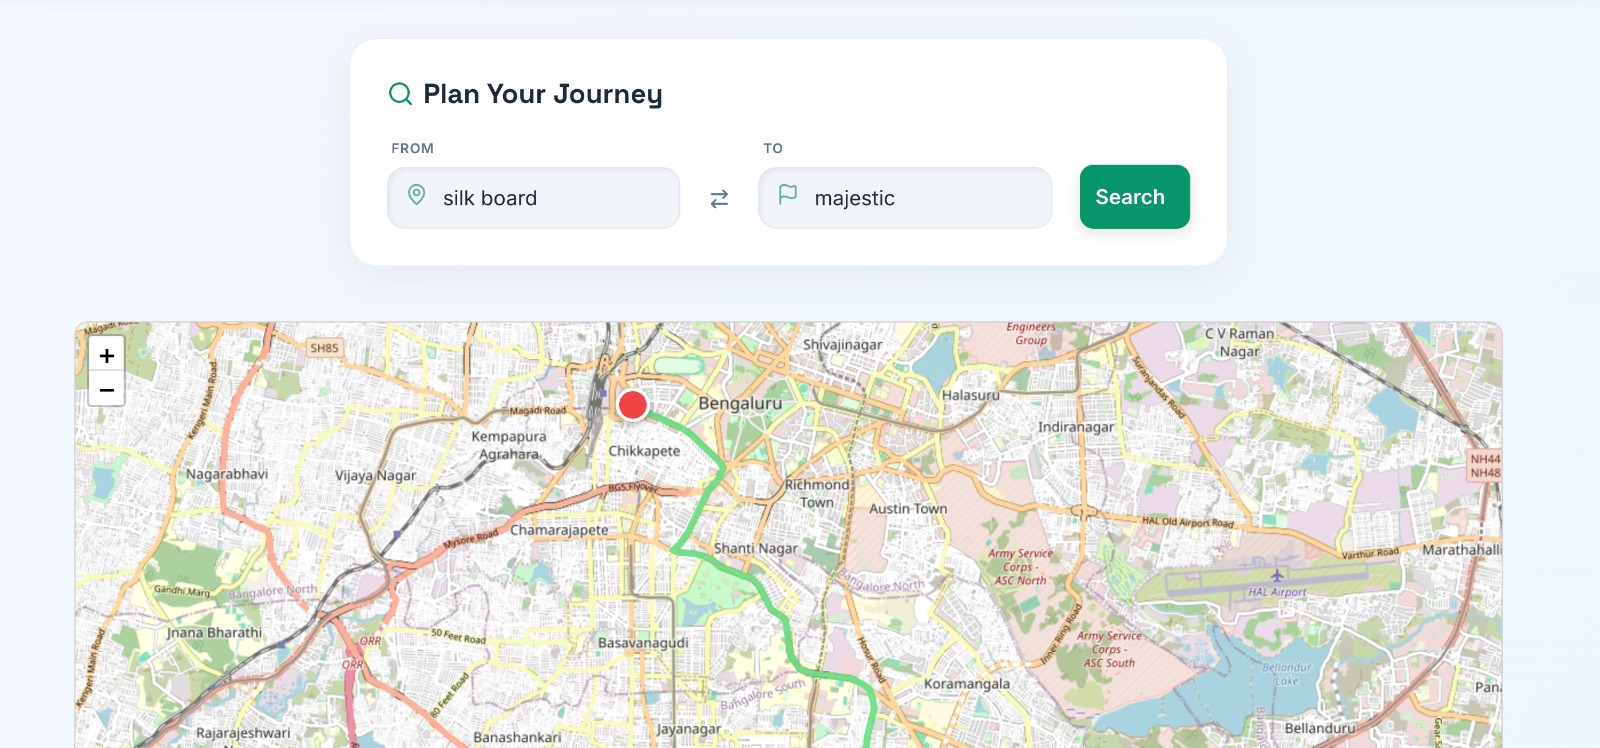
mapping service
-

routing service

BANG! Bus
Problem Statement
Although public transport is one of the most efficient, eco-friendly ways to travel, to those new to the public transit system, it can feel intimidating. This can be due to a variety of reasons, including -
- overcrowing
- language barriers
- lack of awareness of the connectivity
Current mapping services such as Google Maps are really inaccurate in terms of time estimates as well as types of buses that are available.
We want to solve this by making it easier for users to navigate around the transit system, by providing data buses, time taken, congestion in buses, as well as simplifying language barriers.
Overview
BANG! Bus is an integrated solution that helps users travel smarter in Bangalore using the public transit system (BMTC). Our tool includes a routing system that provides accurate estimates and travel methods using the BMTC system. It also provides common phrases in Kannada for easy communication, as well as commonly taken journeys. In addition to this, our tool includes a mapping system that shows all the buses and stations in the city. Using the buses' GPS data, we estimate the congestion in each individual bus, so the user can take a smart decision on what bus to take, instead of waiting for an empty bus that may never come.
To calculate time estimates of a journey, Google Maps' API was used to estimate the time of journey. Translation was provided by Google Translate, and data about most popular routes was taken from Open Bangalore.
The routing was done by adding an OpenStreetMap overlay and taking values from the input fields (for the origin and destination). Nominatim Geocoding converts text into Latitude and Longitude Coordinates, from which waypoints are created using Leaflet Routing Control. The route then appears on the Leaflet map, which also ensure clean overlay on the OpenStreetMap tiles. When a route is found, Leaflet emits the RoutesFound event. Before adding a new route, the old one is removed.
To estimate the congestion of buses, we use the GPS data of the buses instead of actual passenger and capacity counts. To do this, we maintain an object with the last known GPS location, speed, time since last stop, and previous occupancy estimate. We then calculate the following parameters: speed, stop duration, jerk (acceleration changes), and rush hour adjustment. These are based on the assumptions that slower buses are more crowded, longer stops contribute to more occupancy, jerks may point to potential boarding activity, and rush during peak hours is higher. By taking the weighted sums of all these factors, we estimate an occupancy score out of 100. To reduce erratic changes caused by GPS randomness/noise, we apply an EMA filter to ensure smoother transitions of occupancy over time.
Tech Stack
Backend -
- Language - Python
- Framework - Flask
- Libraries - Requests, PyProj, Threading Frontend -
- Languages - HTML, CSS, JS
- Mapping - Leaflet, Google Maps
- Styling - Custom CSS, Tailwind
- Icons/Animation - Lucide, GSAP
Setup Instructions
Mapping - 1) Install Python and all dependencies using pip 2) Run the server (backend script) 3) Access the mapping by opening the path of the frontend.html in your browser
Routing - 1) Install Leaflet.js 2) Install Leaflet routing Machine 3) Install Leaflet Conrtol Geocoder 4) Install Lucide Icons 5) Install Nominatim Geocoding 6) Upload to Netlify or alternatives to view the website
Video Demo
https://www.youtube.com/watch?v=kddTCIUBgKE
Mapping Website Demo
https://shimmering-basbousa-19789e.netlify.app/
Disclaimer
AI was used to assist in the creation of this project. For the routing system, AI was used in Styles CSS (almost 60% ai beacuse its very time consuming to type in colour codes and manually enter the values), theme manager to create scripts to allow for seamless theme changing, app JS to create the hover effect and hightlighting. AI was used in the mapping system to assist in the creation of the CORS headers, EMA smoothing of parameters, as well as fixing issues related to API access. It was also used to assist in the creation of smooth scrolling of buses, clarify syntax errors related to the Leaflet mapping platform, and general debugging/formatting.
The main LLMS used were ChatGPT.
The third-party assets, libraries, and tools used include -
- Leaflet and its associated libraries (for mapping, routing, geoencoding)
- Lucide Icons (for some icons in the website)
- GSAP (for some general animations)
- Flask
- Pyproj (for converting Finnish coordinates)
- Requests (for taking data from external APIs)
- ITS Factory GTFS-RT API (real-time bus location data)
- Tampere Geoserver WFS API (data about bus stops)
- Nominatim Geocoder (used by Leaflet for converting location names into coordinates)
Credits
Pranav - created the mapping system and created the algorithm for estimating congestion inside the bus
Neil - created the website, routing integration, and the translation features
Built With
- css3
- flask
- google-maps
- gsap
- html5
- javascript
- leaflet.js
- lucide
- pyproj
- python
- requests
- tailwind
- threading


Log in or sign up for Devpost to join the conversation.