Inspiration
As a Burundian, I have a deep, personal understanding of the challenges and opportunities in my country. A significant portion of Burundi's economy is "informal" – it's a vibrant and resilient engine of commerce that is often invisible in official statistics. This invisibility means that policymakers and development organizations lack the data they need to make effective, timely decisions that can support and uplift these communities.
My inspiration was to build a tool that could make this invisible economy visible. I wanted to use the power of AI to create a solution that could provide real-time insights into the economic health of my country, not just based on traditional metrics, but on the digital footprints of everyday life. This project is my way of contributing to a more data-driven and prosperous future for Burundi.
What it does
This project is an AI-powered platform that provides a real-time estimation of Burundi's informal economy GDP. It works by:
- Fusing Multiple Data Sources: It ingests and analyzes data from five different sources that are proxies for economic activity: mobile money transactions, electricity consumption, internet usage, satellite imagery of market activity, and commercial chatter on social media.
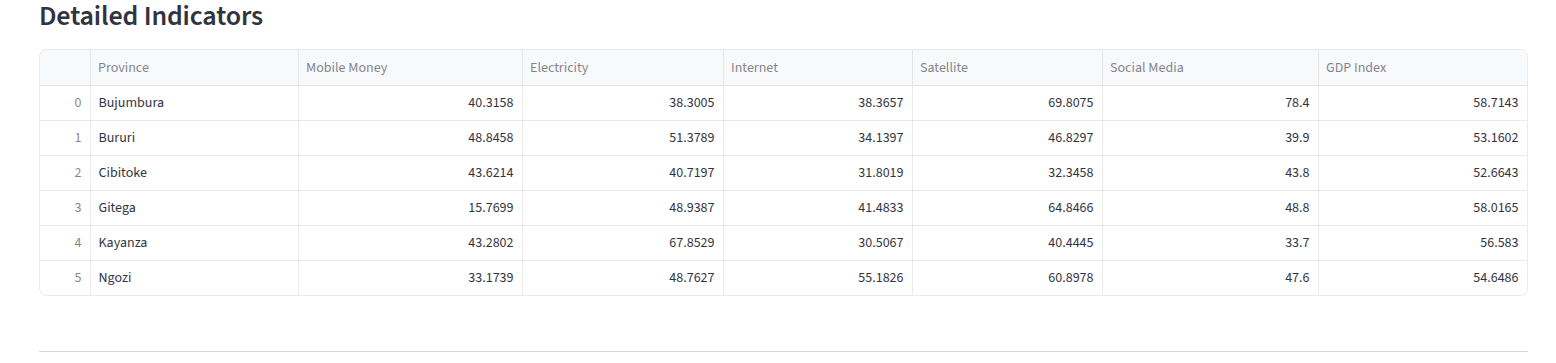
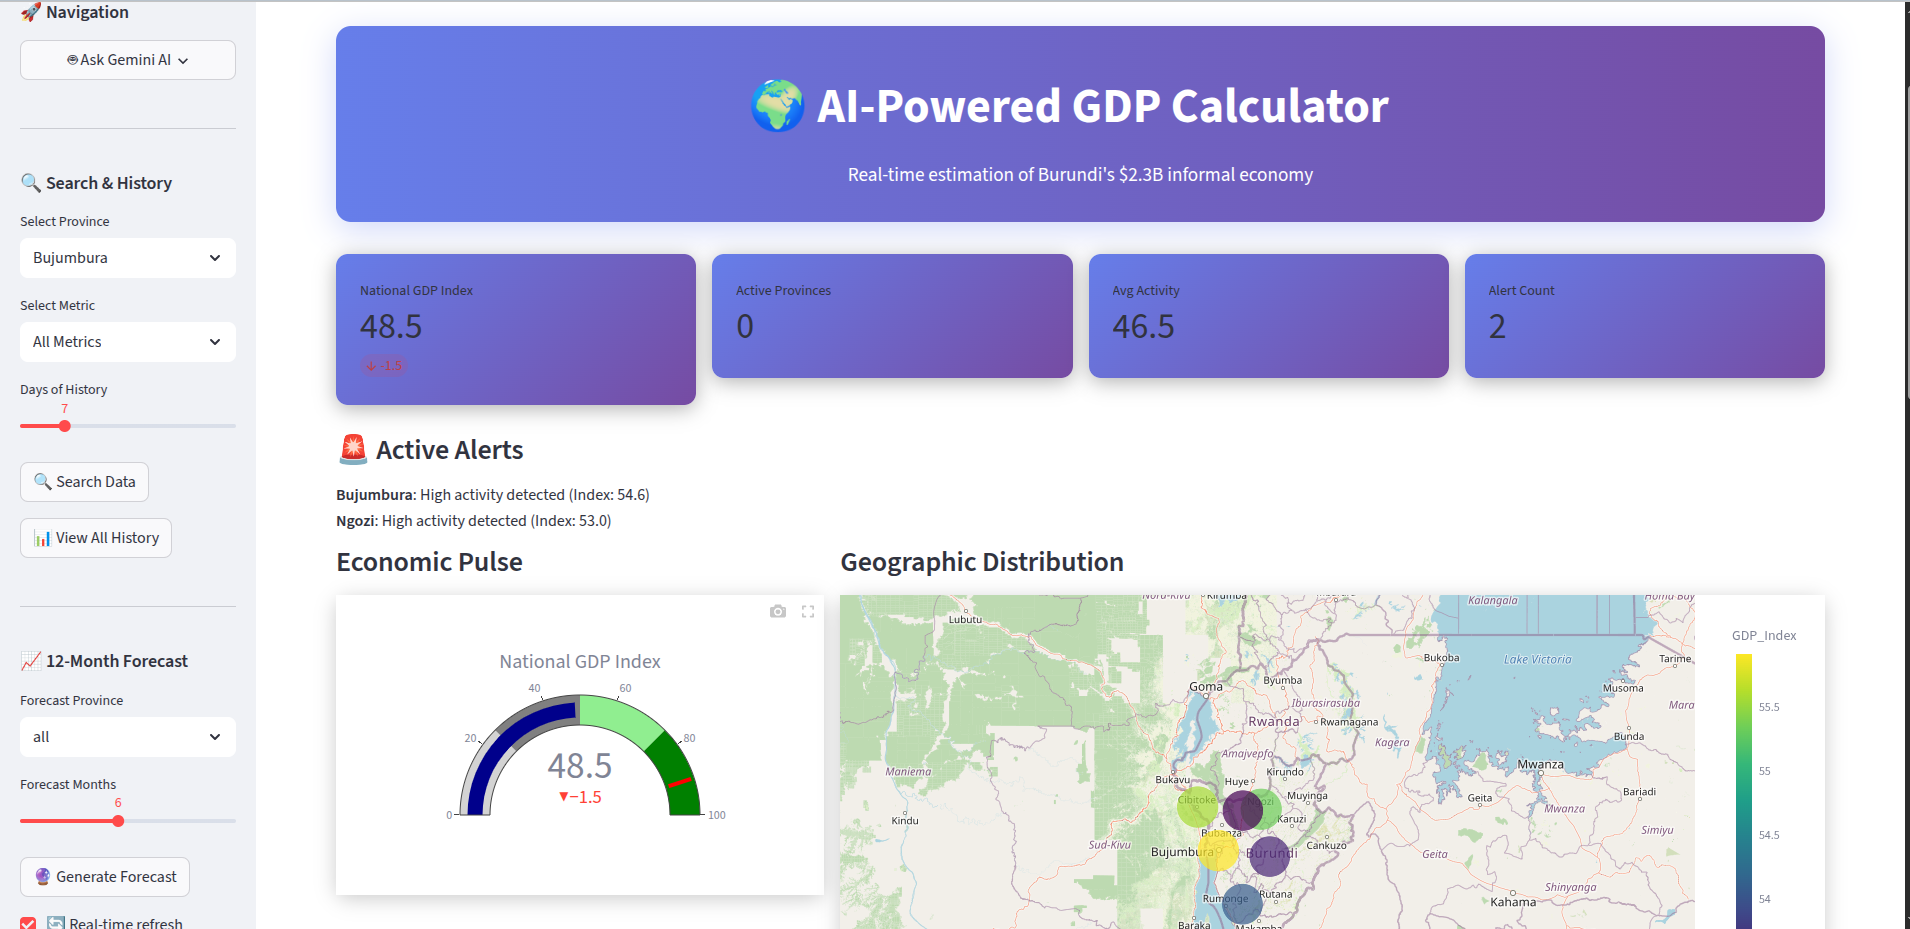
- Calculating a Real-Time GDP Index: Using a data fusion engine and a machine learning model, the platform calculates a real-time "Informal GDP Index" for each province in Burundi, as well as a national average.
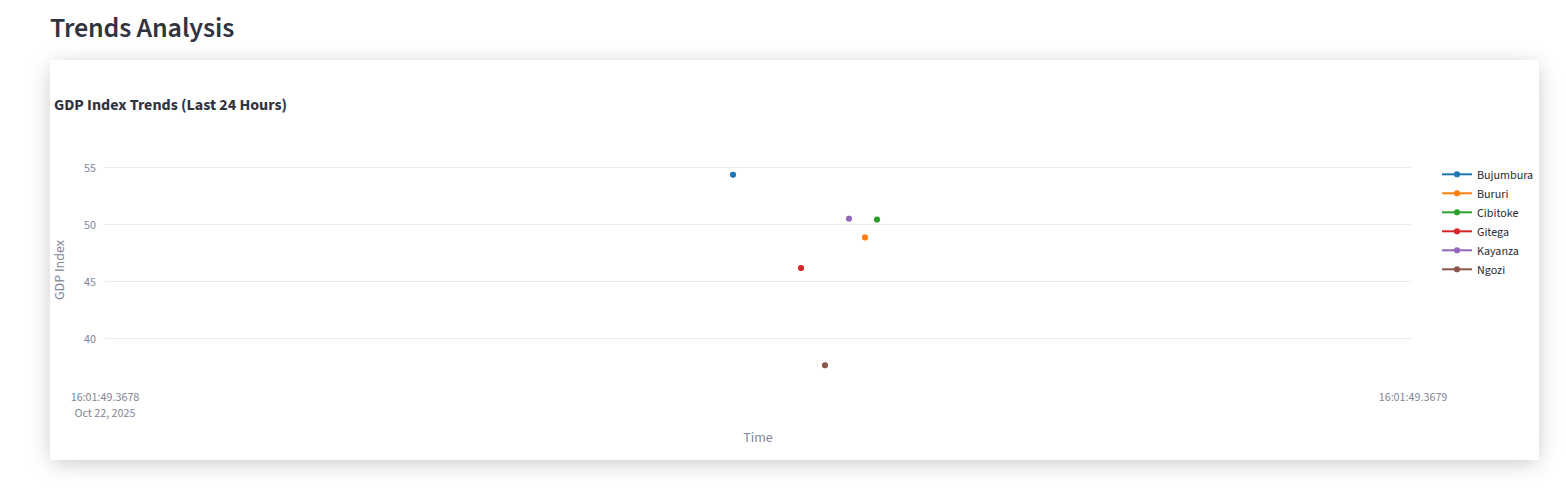
- Providing an Interactive Dashboard: A web-based dashboard visualizes this data through an interactive map, charts, and rankings, allowing users to easily explore and understand the economic trends.
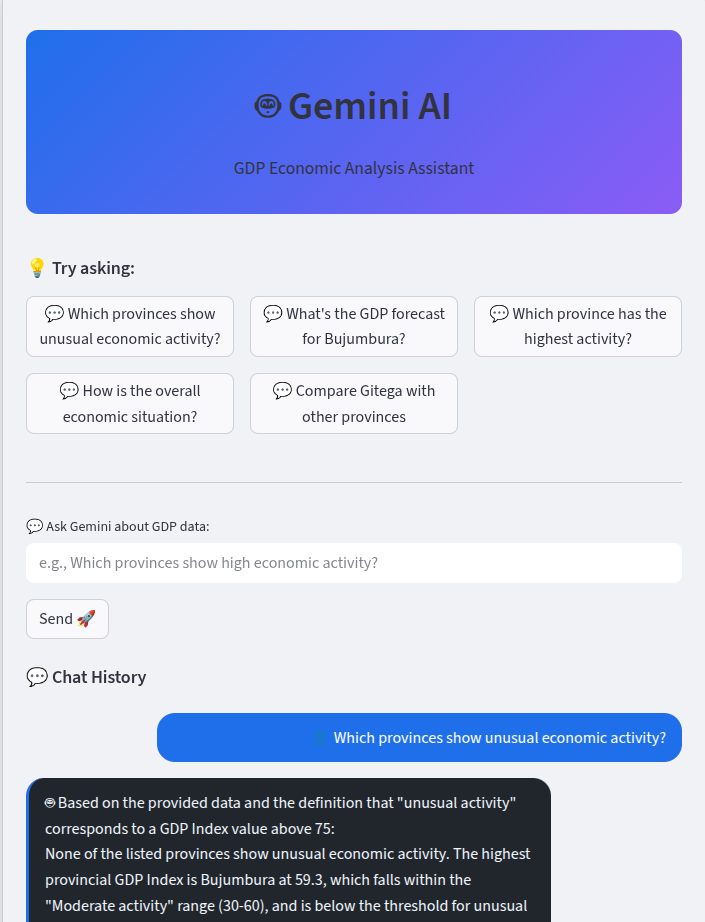
- Answering Questions with AI: The platform includes a chatbot, powered by Google's Gemini AI, that allows users to ask questions about the data in natural language and get immediate, insightful answers.
How we built it
The project is built on a modern, Python-based technology stack:
- Backend: A Flask API serves as the heart of the application, providing endpoints for data ingestion, prediction, and analysis.
- Database: We used Elasticsearch as our primary data store, leveraging its powerful search and aggregation capabilities to handle the time-series data.
- AI & Machine Learning:
- A Scikit-learn (Random Forest) model is used to make the core GDP predictions.
- Google Cloud's Gemini AI is used for the chatbot, allowing for natural language queries of the economic data.
- Frontend: The interactive dashboard is built with Streamlit, providing a user-friendly and responsive interface.
- Data Simulation: Due to the difficulty of obtaining real-time data from Burundi, we built a sophisticated data simulation engine using Pandas and NumPy to generate realistic data for the five data sources.
The architecture is designed to be modular and scalable, with a clear separation between the data, backend, and frontend components.
Challenges we ran into
This project was ambitious, and we ran into several technical challenges along the way:
Elasticsearch Integration: Integrating with Elasticsearch was a core requirement, but it was not a trivial task. We had to learn the intricacies of the Python client, design an optimal index mapping for our time-series data, and write complex aggregation queries to power the analytics on our dashboard. Setting up and managing the Elasticsearch container within our docker-compose environment also took some time to get right.
Realistic Data Simulation: Our biggest challenge was the scarcity of real-time economic data. To overcome this, we had to build a sophisticated data simulation engine. It was a significant undertaking to generate five different time-series datasets that were not only realistic but also included seasonality, noise, and inter-dependencies that would mimic real-world economic patterns.
User Interface and Experience: We initially struggled with Streamlit's multi-page navigation, which was not working as expected in our environment. After several attempts to debug the issue, we pivoted to a more elegant solution: re-architecting the chatbot feature into a pop-up dialog using st.popover. This not only solved the technical problem but also resulted in a much better and more seamless user experience.
Orchestrating Multiple Services: The application consists of multiple services that need to work together seamlessly: the Flask backend, the Streamlit frontend, and the Elasticsearch database. Orchestrating these services, managing their dependencies, and ensuring they could communicate with each other effectively was a complex task that required careful planning and execution.
Without a credit card, it was impossible to upload to Google, so we used Hugging Face.
Overcoming these challenges was a significant part of our journey and we are proud of the robust and well-engineered solution that we have built.
Accomplishments that we're proud of
- Successful Data Fusion: We successfully combined five disparate data sources into a single, meaningful GDP index.
- Innovative Use of AI: The Gemini-powered chatbot is a feature we are particularly proud of. It makes complex data accessible to everyone, not just data scientists.
- Polished User Interface: We created a dashboard that is not only functional but also beautiful and intuitive to use. The pop-up chatbot is a great example of this.
- Real-World Relevance: Most of all, we are proud of creating a project that has the potential to make a real difference in our home country.
What we learned
This hackathon has been an incredible learning experience. We learned a great deal about:
- The complexities of economic data: We gained a deeper appreciation for the challenges of measuring economic activity, especially in the informal sector.
- The power of data fusion: We learned how to combine different data sources to create a more accurate and holistic picture of the world.
- Practical application of LLMs: We learned how to integrate a large language model (Gemini AI) into a real-world application to create a more natural and intuitive user experience.
- Rapid Prototyping: We learned how to quickly build and iterate on a complex application using modern tools like Streamlit and Flask.
What's next for Mwanga AI
This hackathon is just the beginning. We have a clear vision for the future of this project:
- Integrate Real Data Sources: Our top priority is to partner with local companies and government agencies to replace our simulated data with real data feeds, starting with our home country.
- Expand to Other Regions: We plan to expand the platform to cover other countries in the East African Community and beyond.
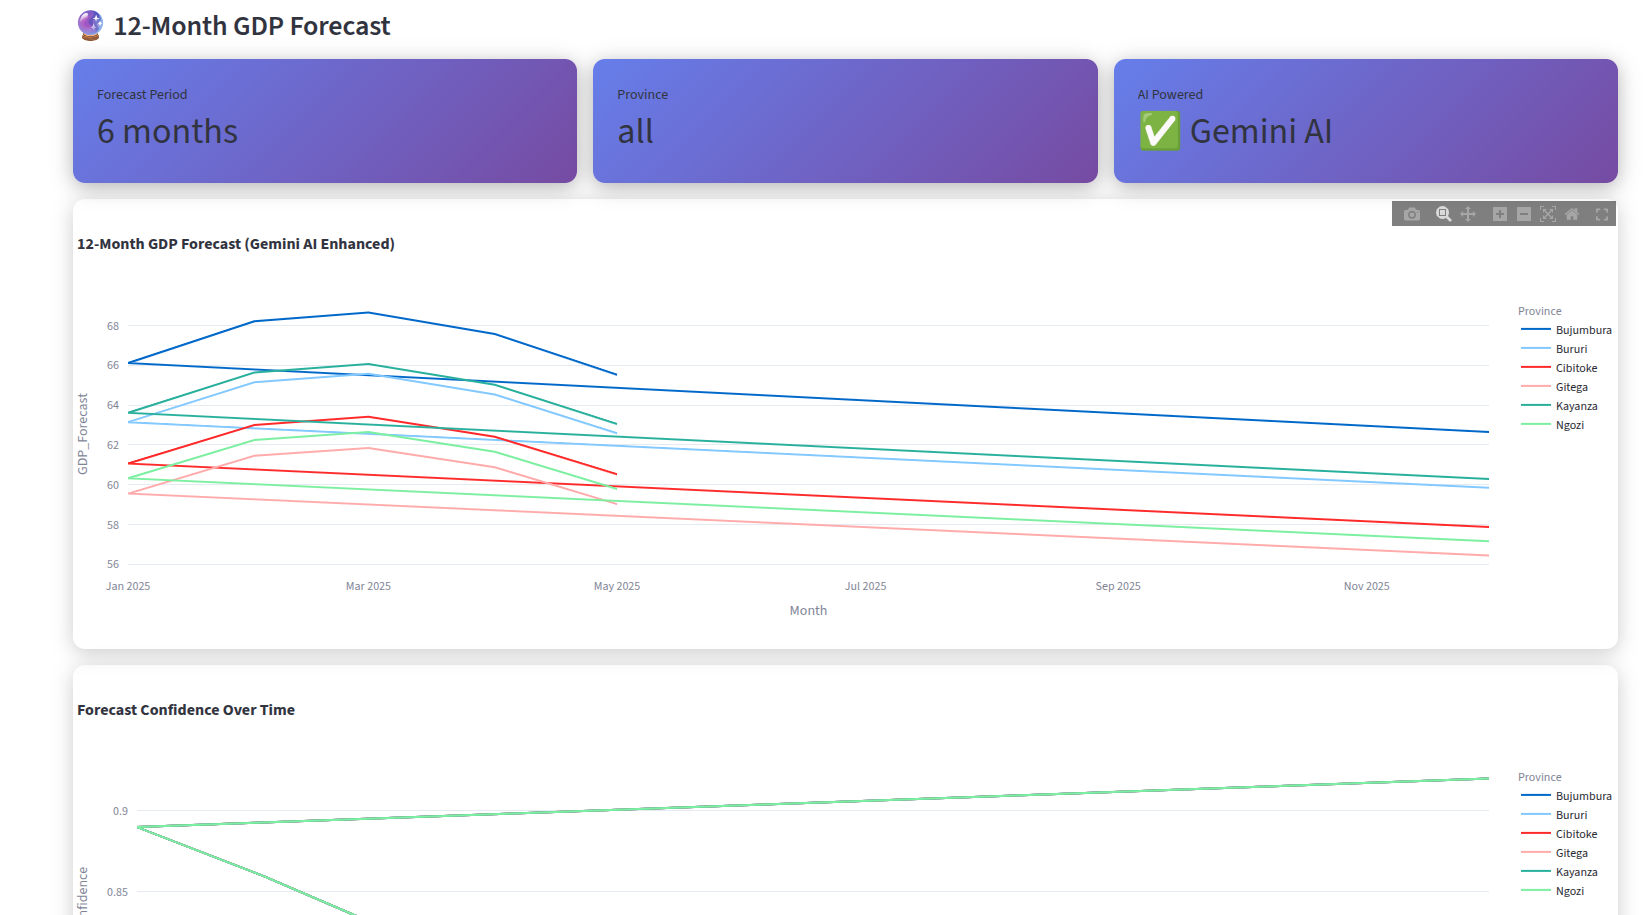
- Advanced AI Features: We want to use more advanced AI and machine learning models to provide even more granular insights, such as forecasting, anomaly detection, and causal inference.
- Mobile Application: We plan to build a mobile version of the application to make it even more accessible to users on the ground.
We are confident that with further development, this project can become an invaluable tool for economic development in the region and across the African continent.
Built With
- elasticsearch
- joblib
- numpy
- pandas
- python
- scikit-learn
- streamlit

Log in or sign up for Devpost to join the conversation.