-
Dash/Board
Inspiration
We were inspired to make this project because we realized that there was a wide gap between our needs for different types of restaurants & clothing stores around campus. It's a problem across Baltimore, where the goods & services people need aren't easily accessible due to distance. But, business don't know where this demand is.
What it does
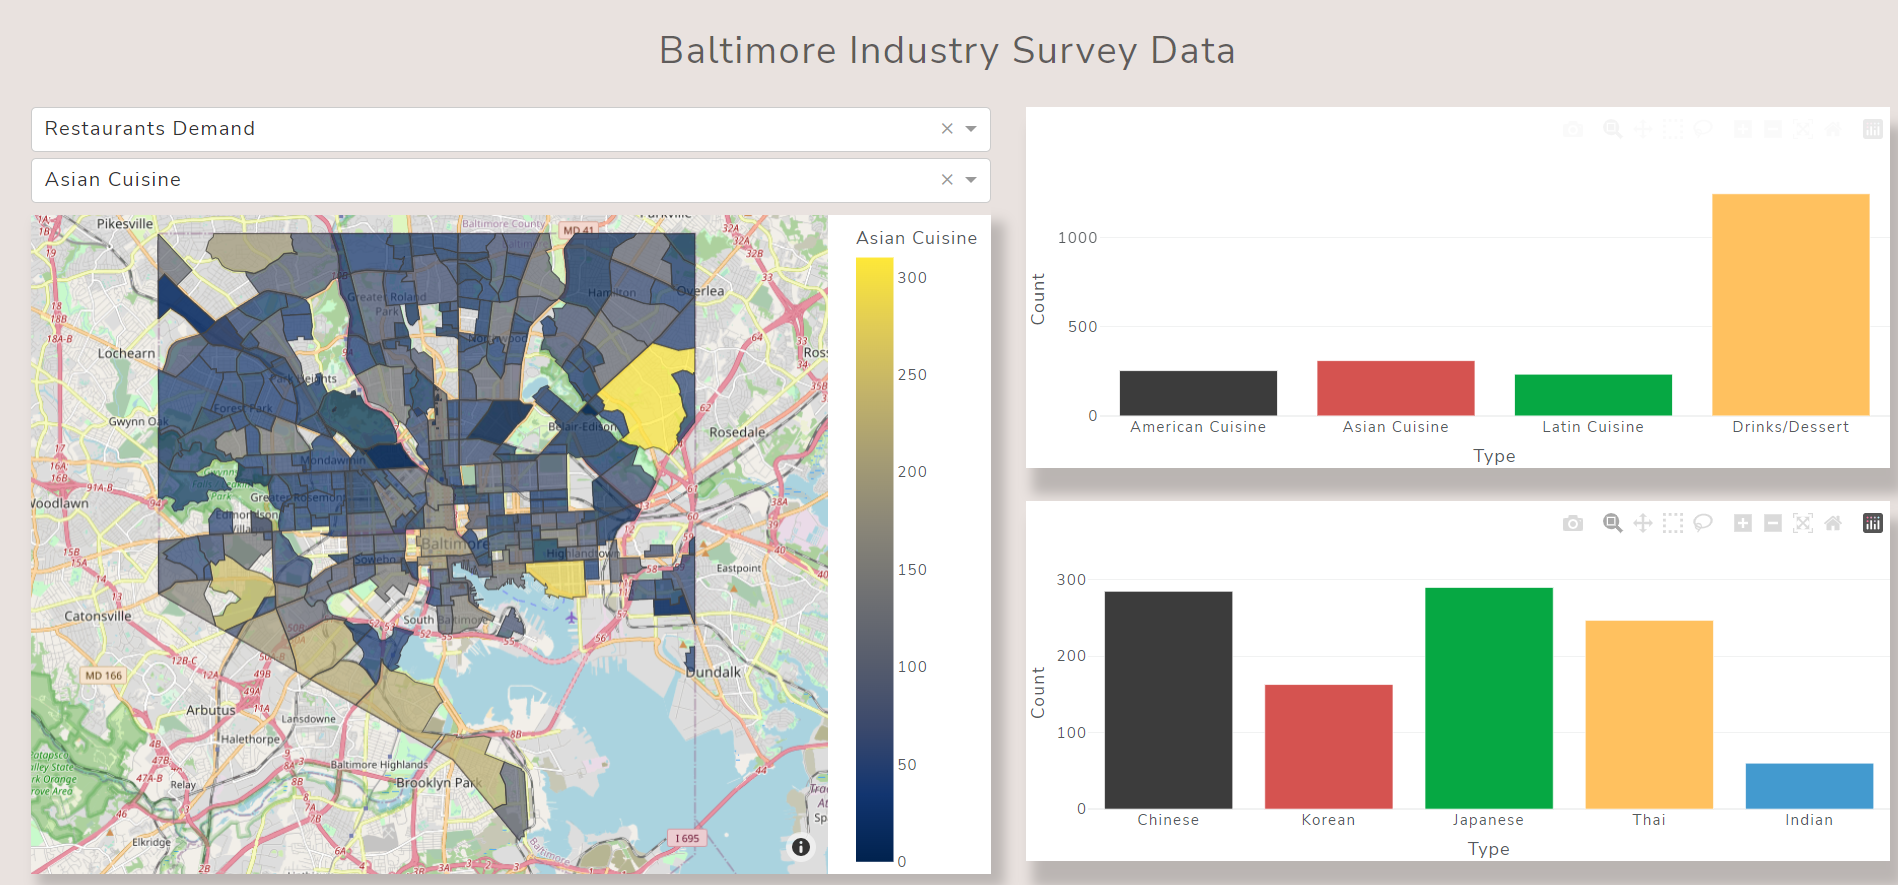
We aim to branch the information disparity between businesses and the broader Baltimore community. This app uses survey data to determine geographic demand for services. Presented with an intuitive UI accessible to franchises and small-business owners, we hope this data will draw business into the regions where the Baltimore community can most benefit.
How we built it
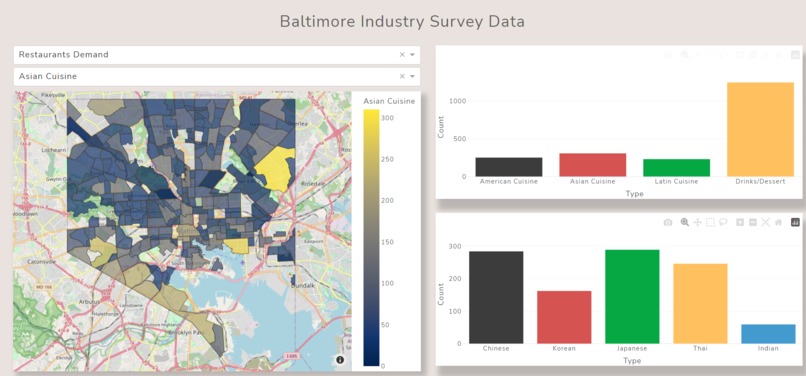
We first synthesized a sample data set we could use for a proof-of-concept. Then, we constructed a map of Baltimore, dividing the city into neighborhoods using geographic polygon data. We built a pipeline for determining the demand for each service in each region, and plotted on an intuitive chloropleth map. As an additional feature, we added sub plots, allowing users to see statistics for service demand by region.
Challenges we ran into
We struggled to synthesize a data set that gave service demands a realistic amount of variance & distribution across Baltimore. We had to find a public API for scraping Baltimore neighborhood polygon data for the map.
What's next for Baltimore Industry Survey Data
The next step is scaling up the app to more industries & collecting real data in Baltimore, helping us equitably bridge the information gap between businesses and the Baltimore community and beyond.

Log in or sign up for Devpost to join the conversation.