-
-
credits
-
Q1-part1
-
Q2
-
Q3
-
Q4
-
Q5
-
Q6
Inspiration
The 2024 poker-themed roguelike deck-building game developed by solo developer LocalThunk.
What it does
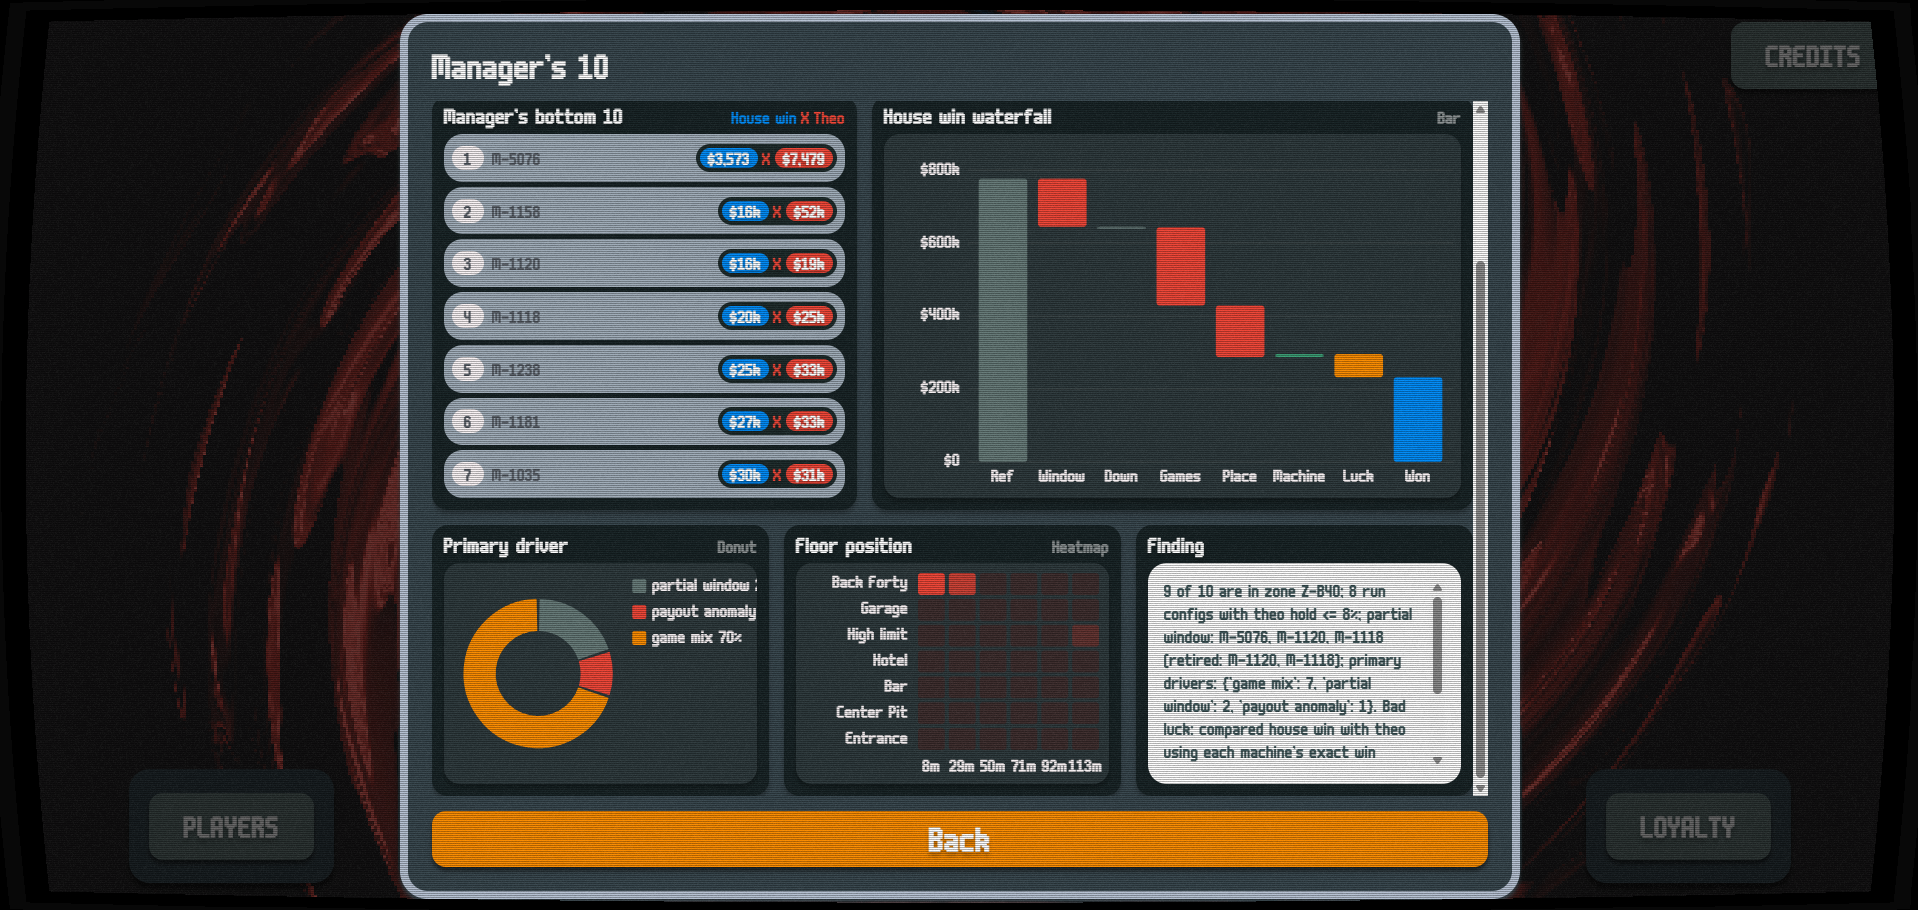
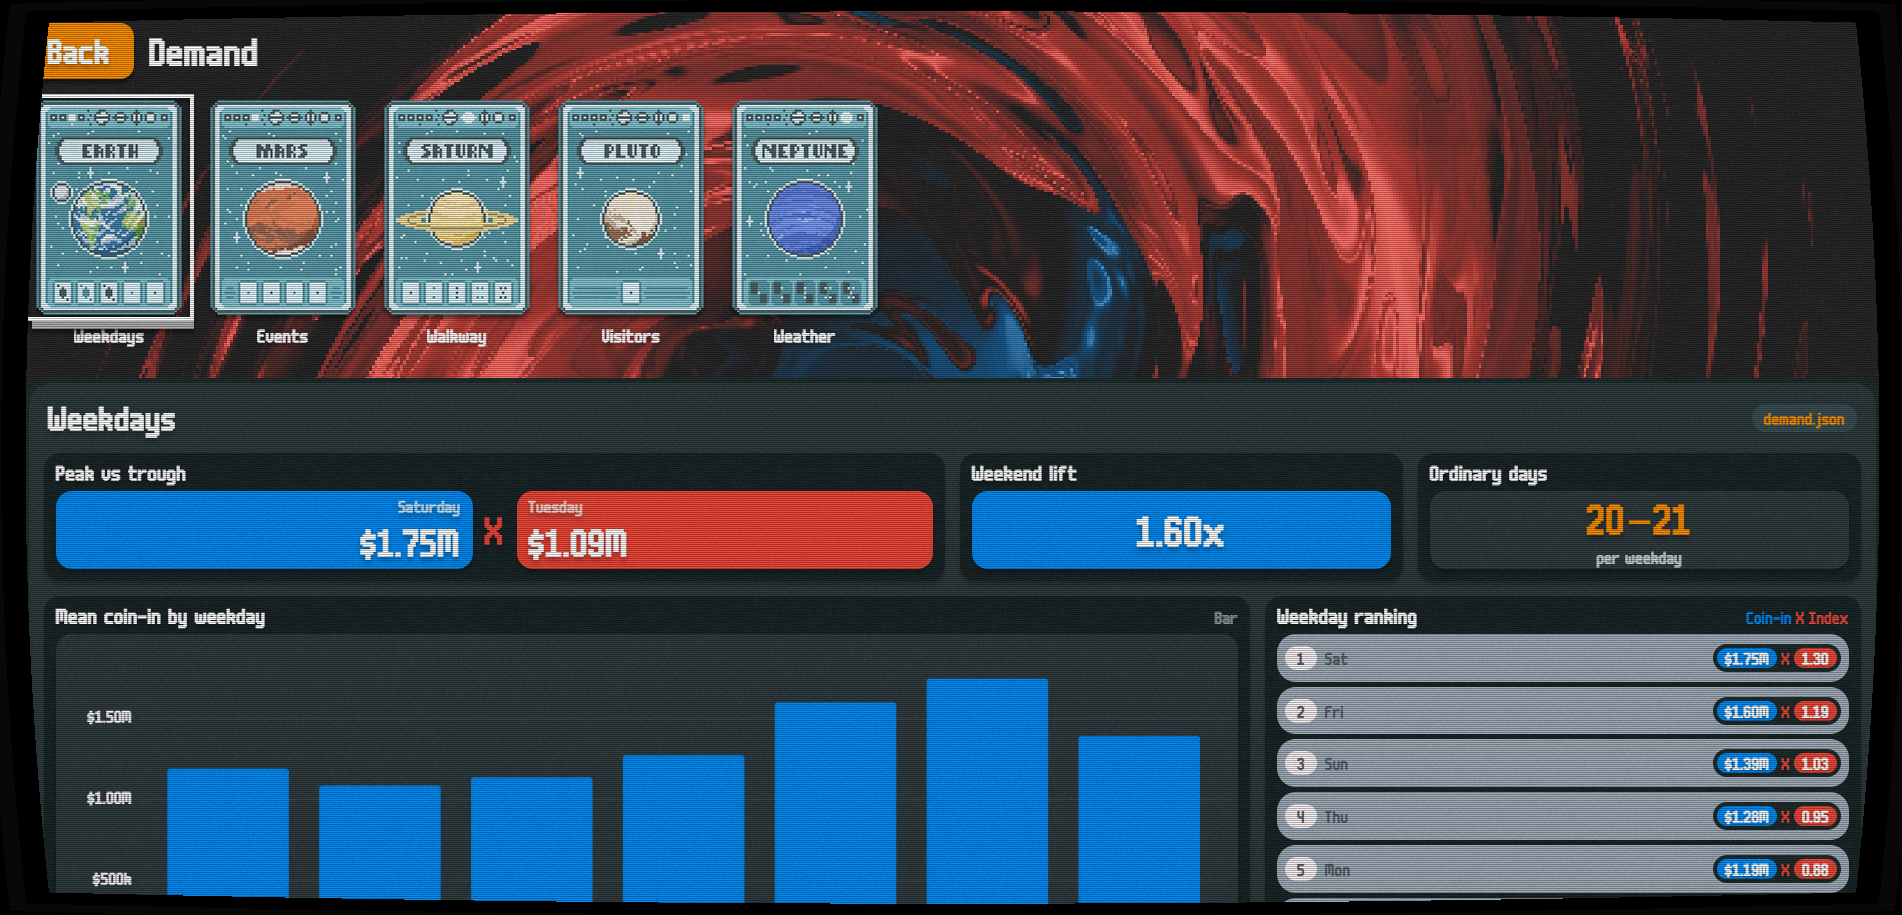
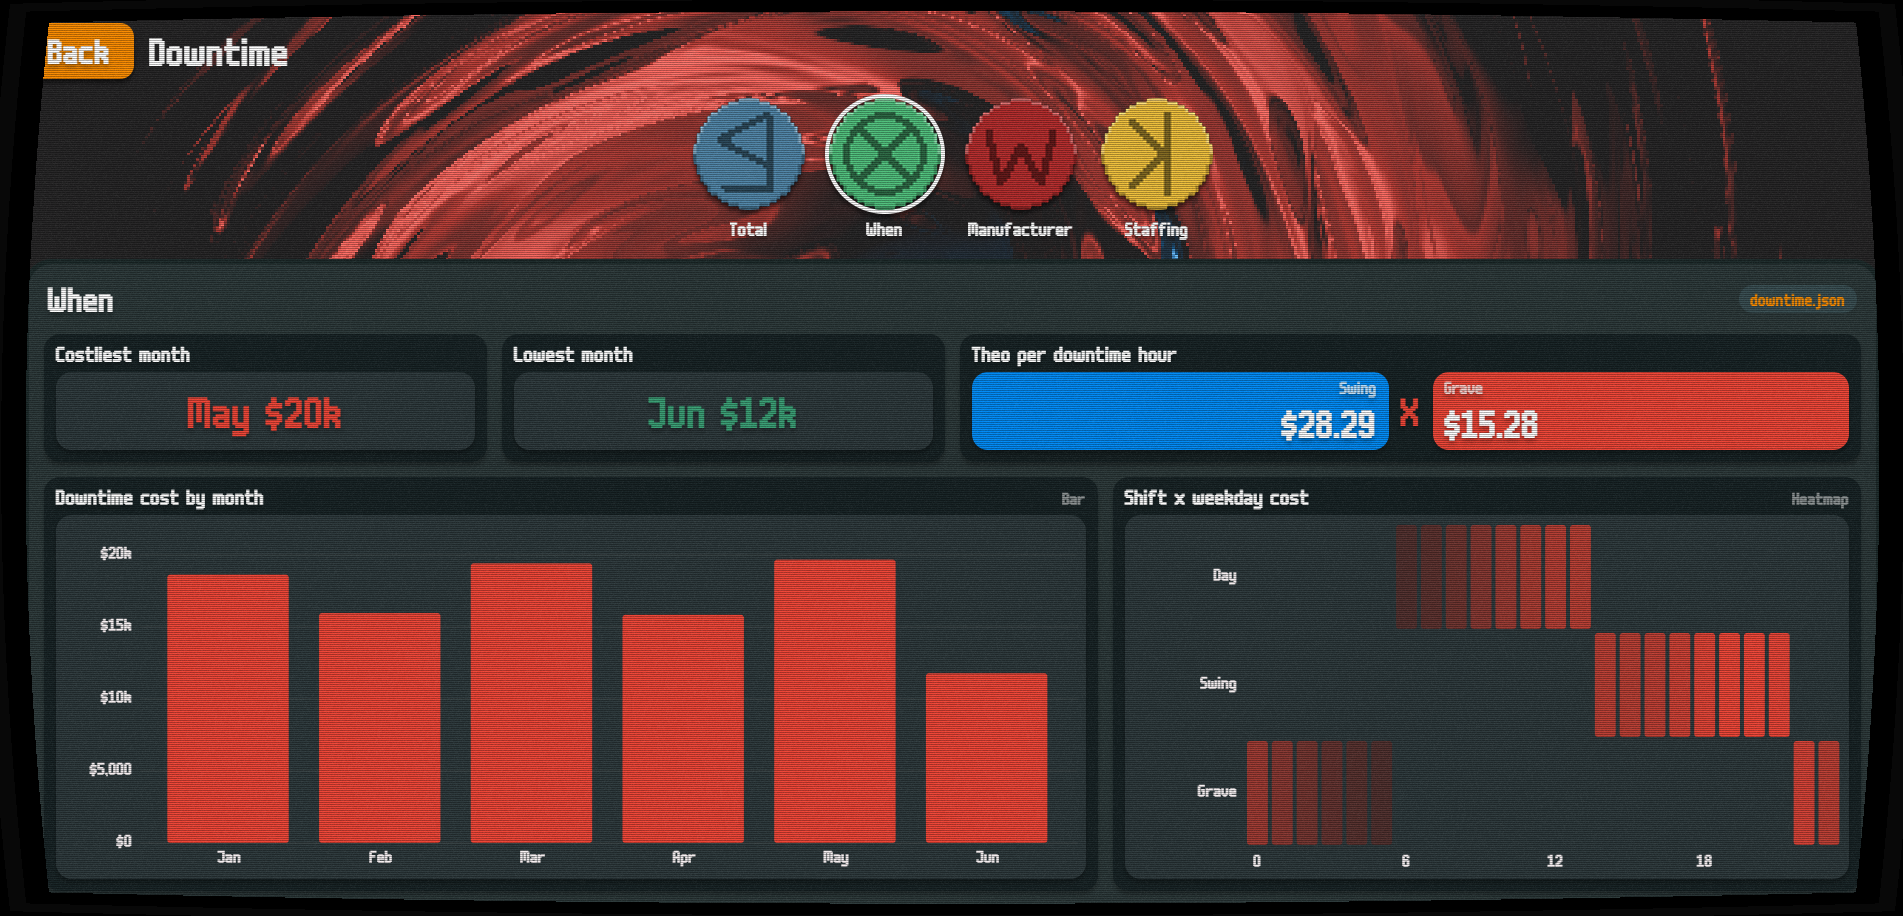
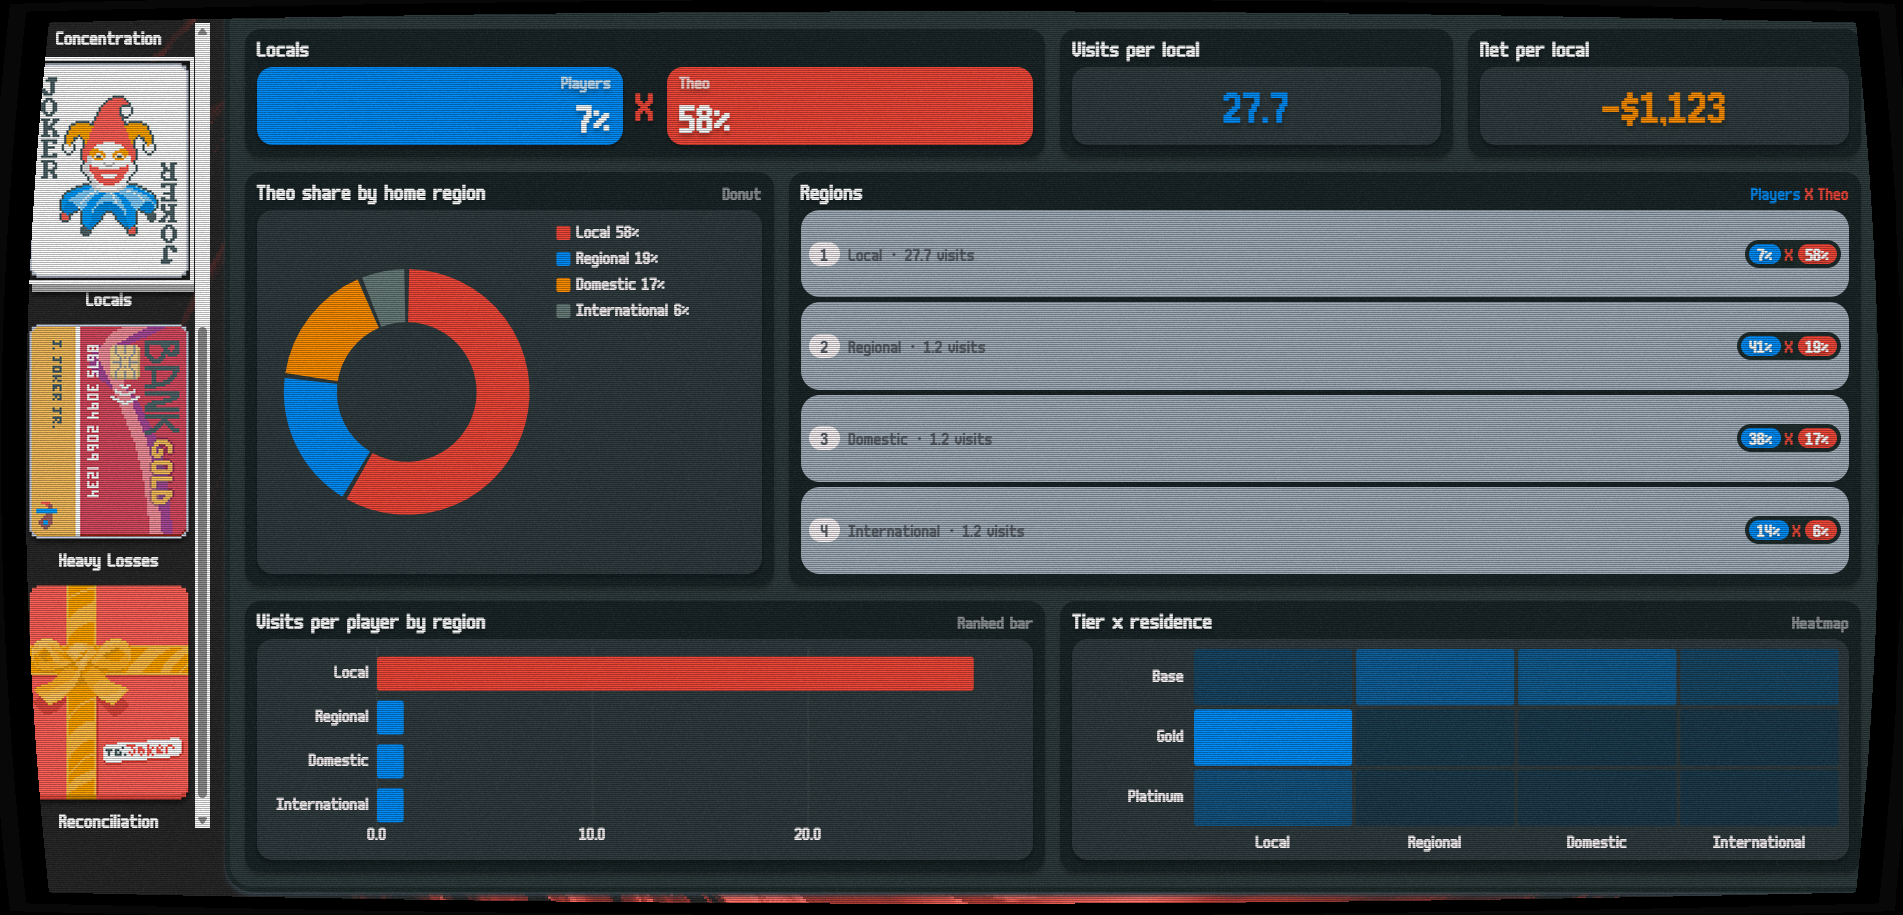
Displays the aggregated findings and transformed data from prior analysis through a unique UI.
How we built it
Nuxt frontend with d3js for charts and gsap for animations. Python scripts with pandas and duckdb for backend.
Challenges we ran into
Tackling the task of completing all requirements for the challenge.
Accomplishments that we're proud of
Finishing the UI on time.
What we learned
A bit about the basics of data analysis and visualization.
What's next for Ball Royale Dashboard
Polishing and maybe more unique visualizations, the charts are kinda generic compared to the UI itself but it is the first time for me using d3. It's a very powerful library in terms of customization so it will be fun to play more with in the future!
Access
https://github.com/So1Sauc3/datathon-2026 https://ball-royale-dashboard.vercel.app/
Open on desktop, each page/card corresponds to a response to a question.
Write-up
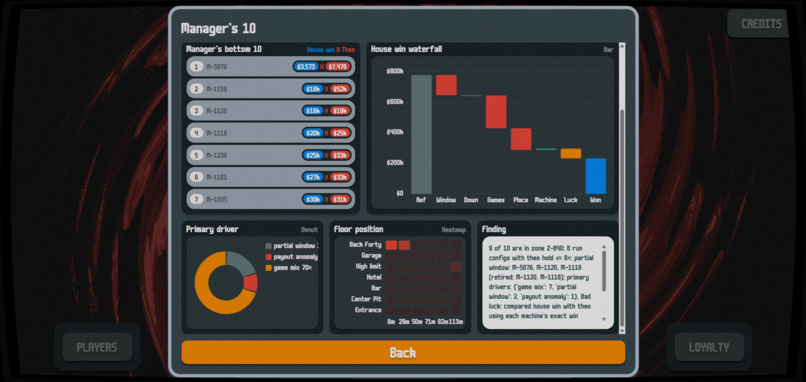
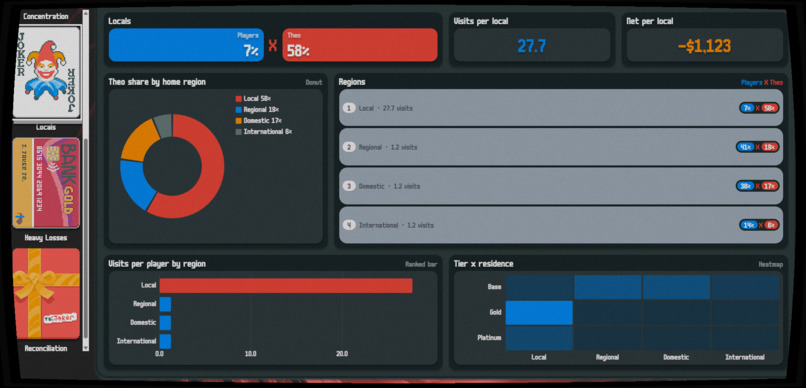
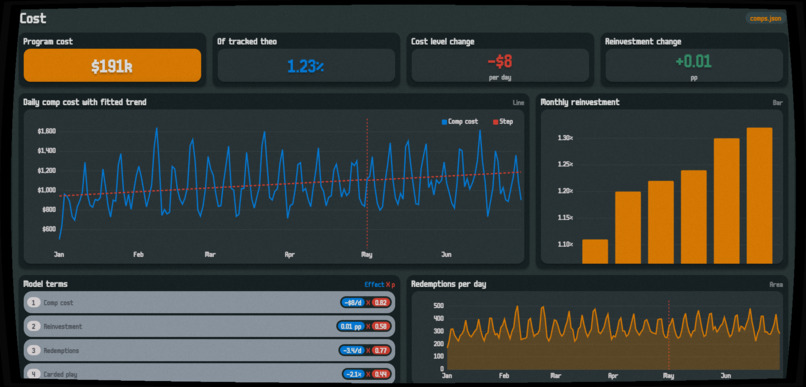
Six screens cover January–June 2025: machines, demand, downtime, tracked players, loyalty, and how to spend $100,000 in July. Date, bank, and guest group all filter, and each claim cites its table. Leave the manager’s bottom ten in place. Nine are in the Back Forty and eight run low-hold settings, with normal availability. Apart from M-1158 (hit rate 38.6% vs a configured 31.5% every month), luck matches chance.
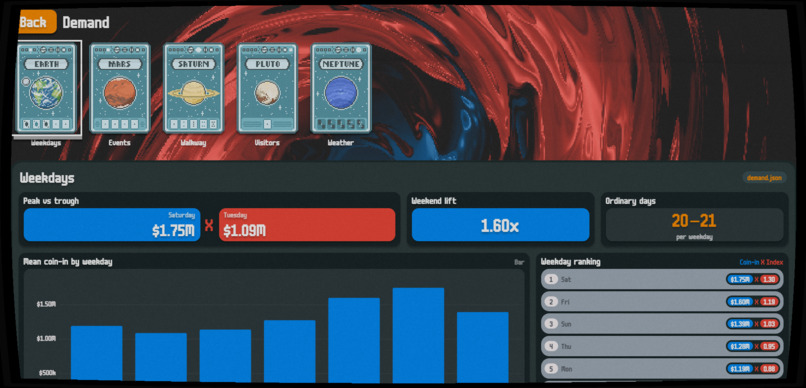
Coin-in per scheduled hour is weekday factors times a level. Factors are a log regression of weekday and month on ordinary days, keeping events out of the weekly shape. Four level rules were chosen on April, refit through April 30, and frozen to disk before May–June was scored. The training-mean level has MAE $53,457, 22% below the guide’s all-days weekday mean ($68,699) and below Holt-Winters ($68,227). An ordinary-day weekday mean is $53,635, so the shape does the work. Following April over-forecasts June. July is about $40.0 million of coin-in, or $38.6 million if June holds. That low case scales every July benefit.
python -m analysis.run loads parquet into DuckDB. floor_day keeps on-floor machine-days, turns cents into dollars, and joins game math. Question modules run in order; the budget writes the dashboard JSON. Ratios are sums over sums. Gaming date is local time minus six hours. Carded and all play are totaled separately, then compared.
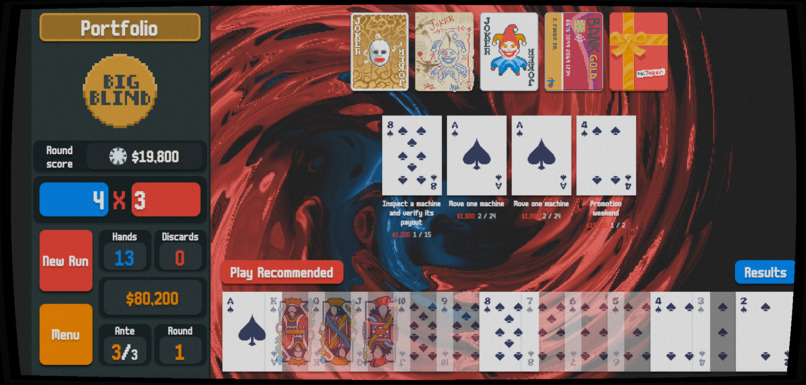
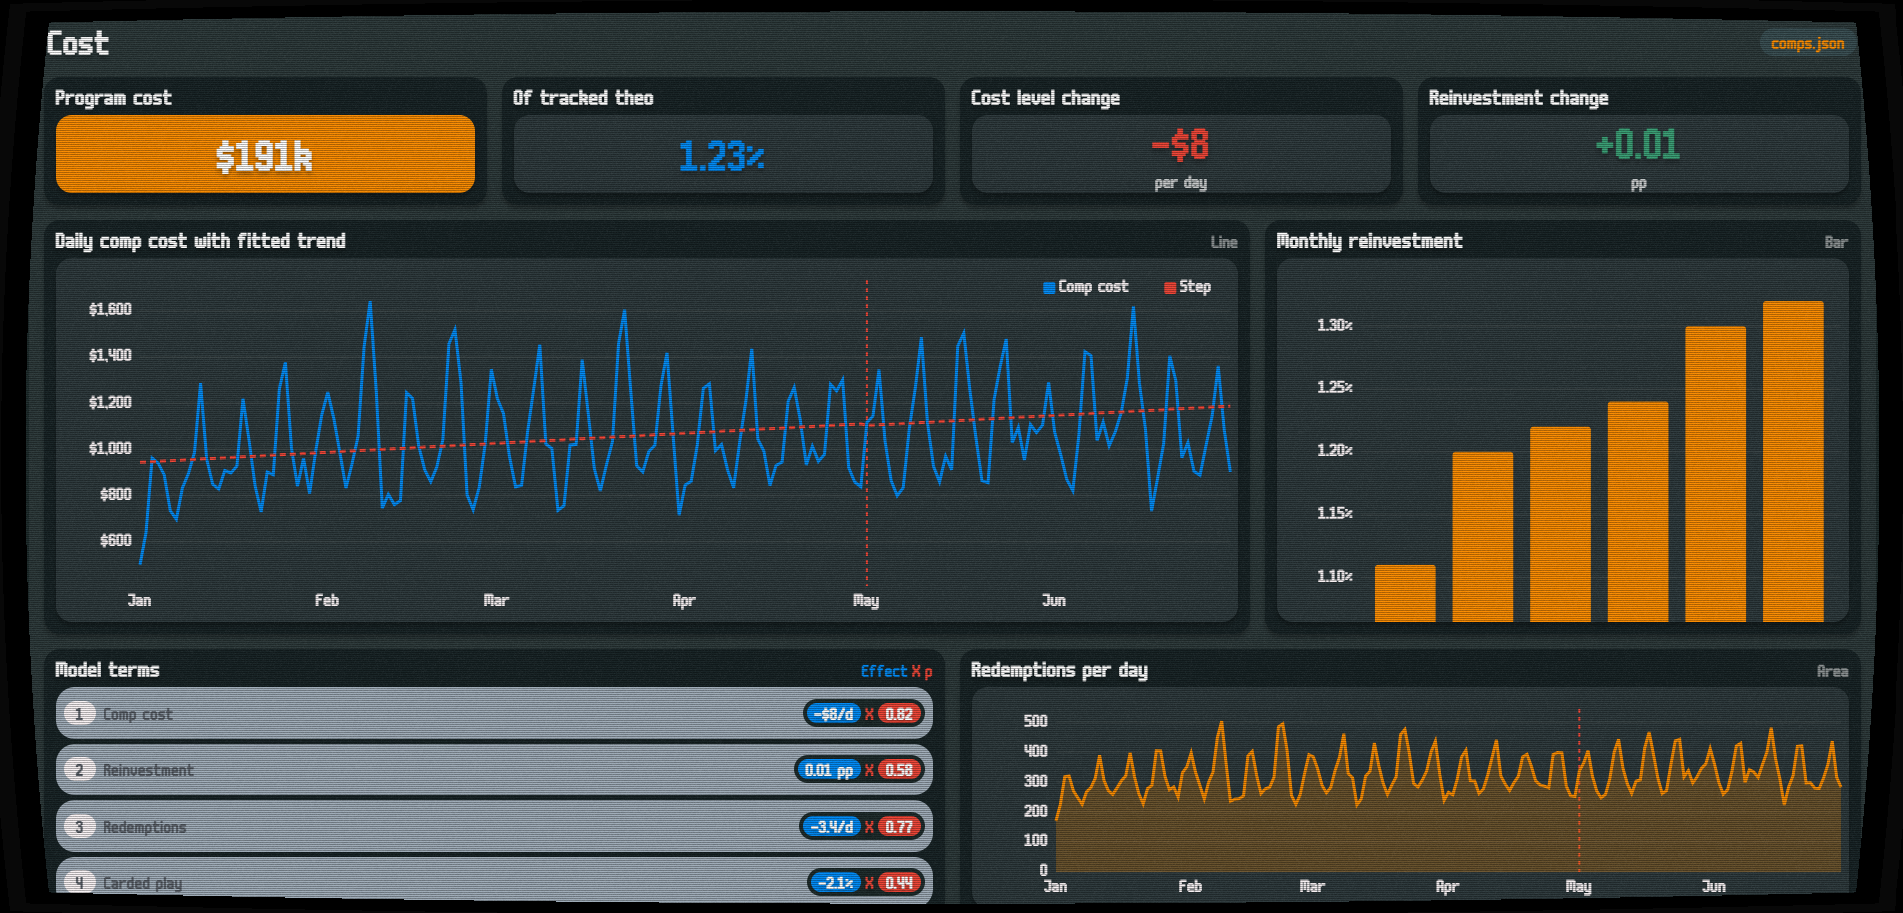
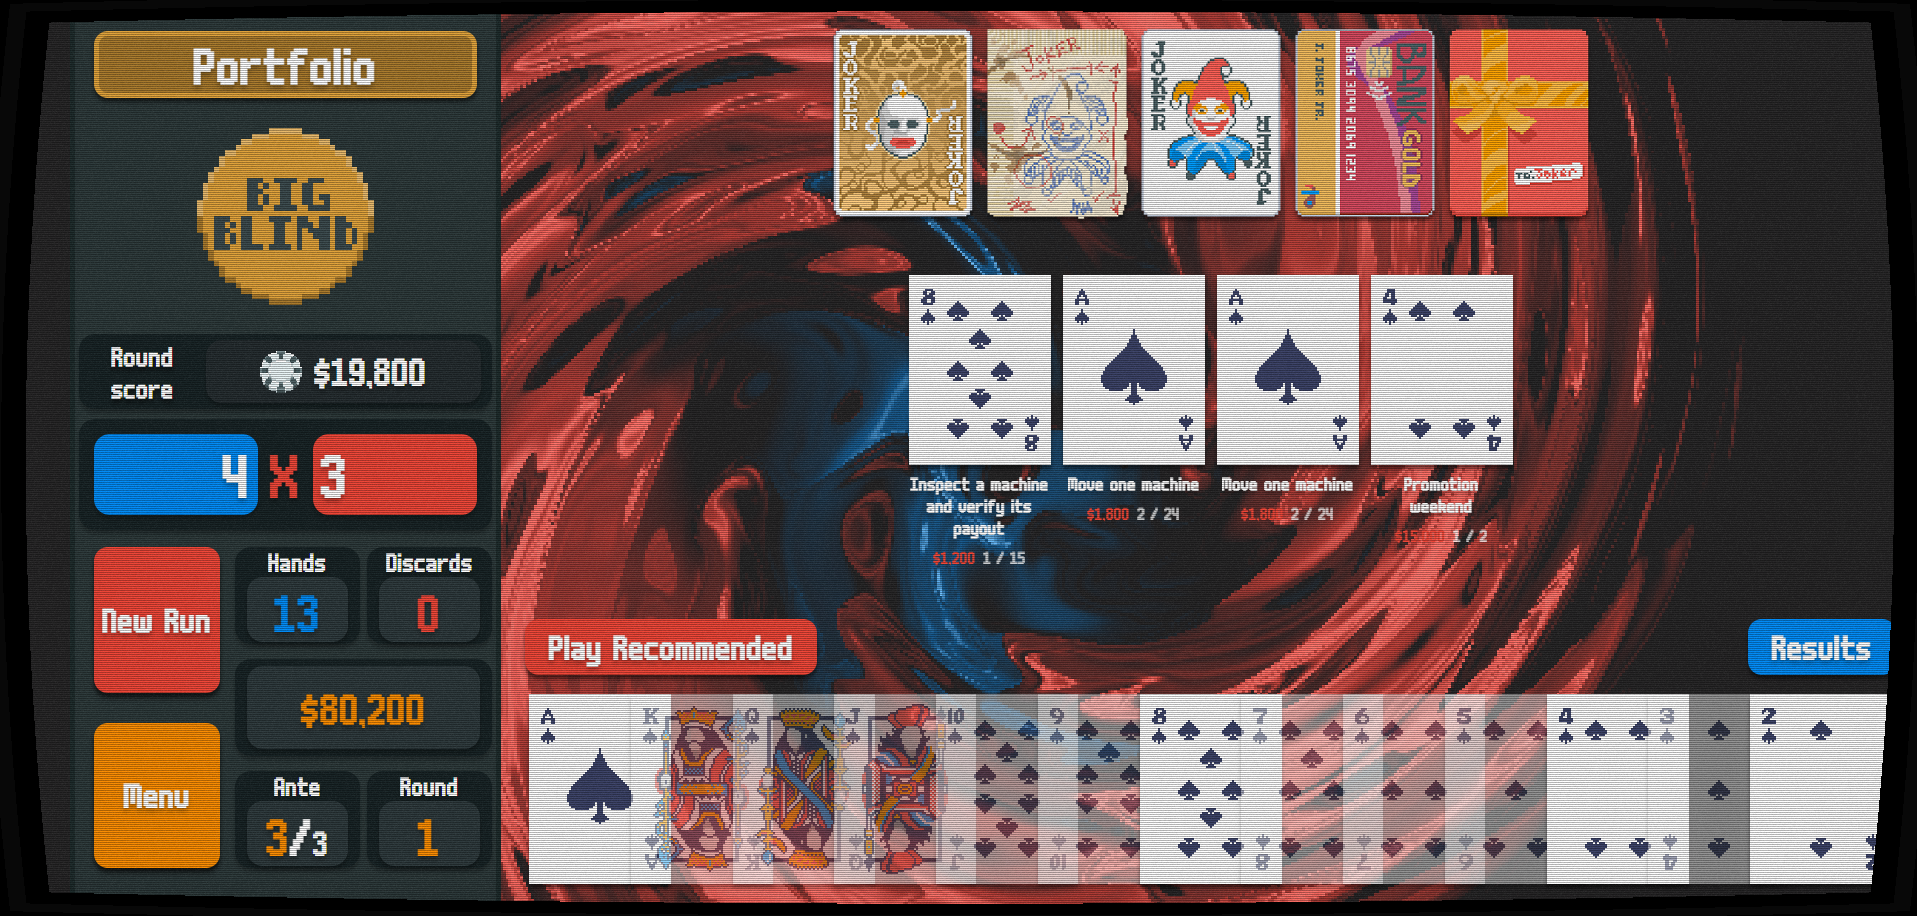
Spend $19,800 on three types and keep $80,200. Mid-case net benefit is $56,200 ($11,600 to $87,700).
Inspect M-1158 ($1,200, one-day lead). Closing its $200/day gap at 70% probability nets about $2,800 over 29 days (30–95% bounds). Whether a fix lasts is unknown. Measure hit rate and hold against 31.5% and 10%, and watch occupancy.
Move M-1283 and M-1146 into empty Center Pit slots ($3,600, two-day lead). The pit factor is 1.13 against the Back Forty’s 0.65. Full transfer and 25% neighbor absorption nets about $16,400 over 28 days. A quarter of the gap breaks even. Compare theo per available hour with each machine’s April–June rate, and the rest of the pit with control zones.
Promote July 18–20 ($15,000, 14-day lead), the first holiday-free weekend after the lead. Own promotions lifted coin-in 6.1–17.4%. At 9.46% theo hold, net of comps, the average nets about $37,000 and pays back above a 3.3% lift. Two cooler-month events are a thin sample. Score the weekend and next week on the frozen forecast. Omit heavy-loss guests.
