-
-
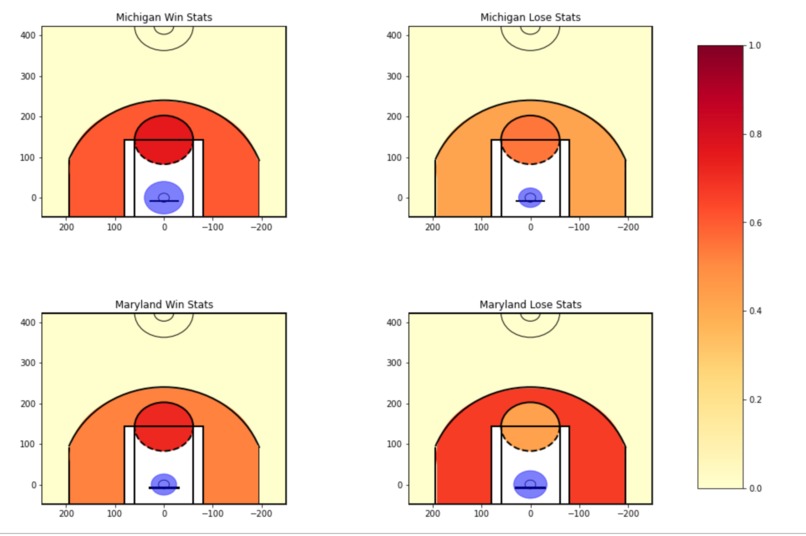
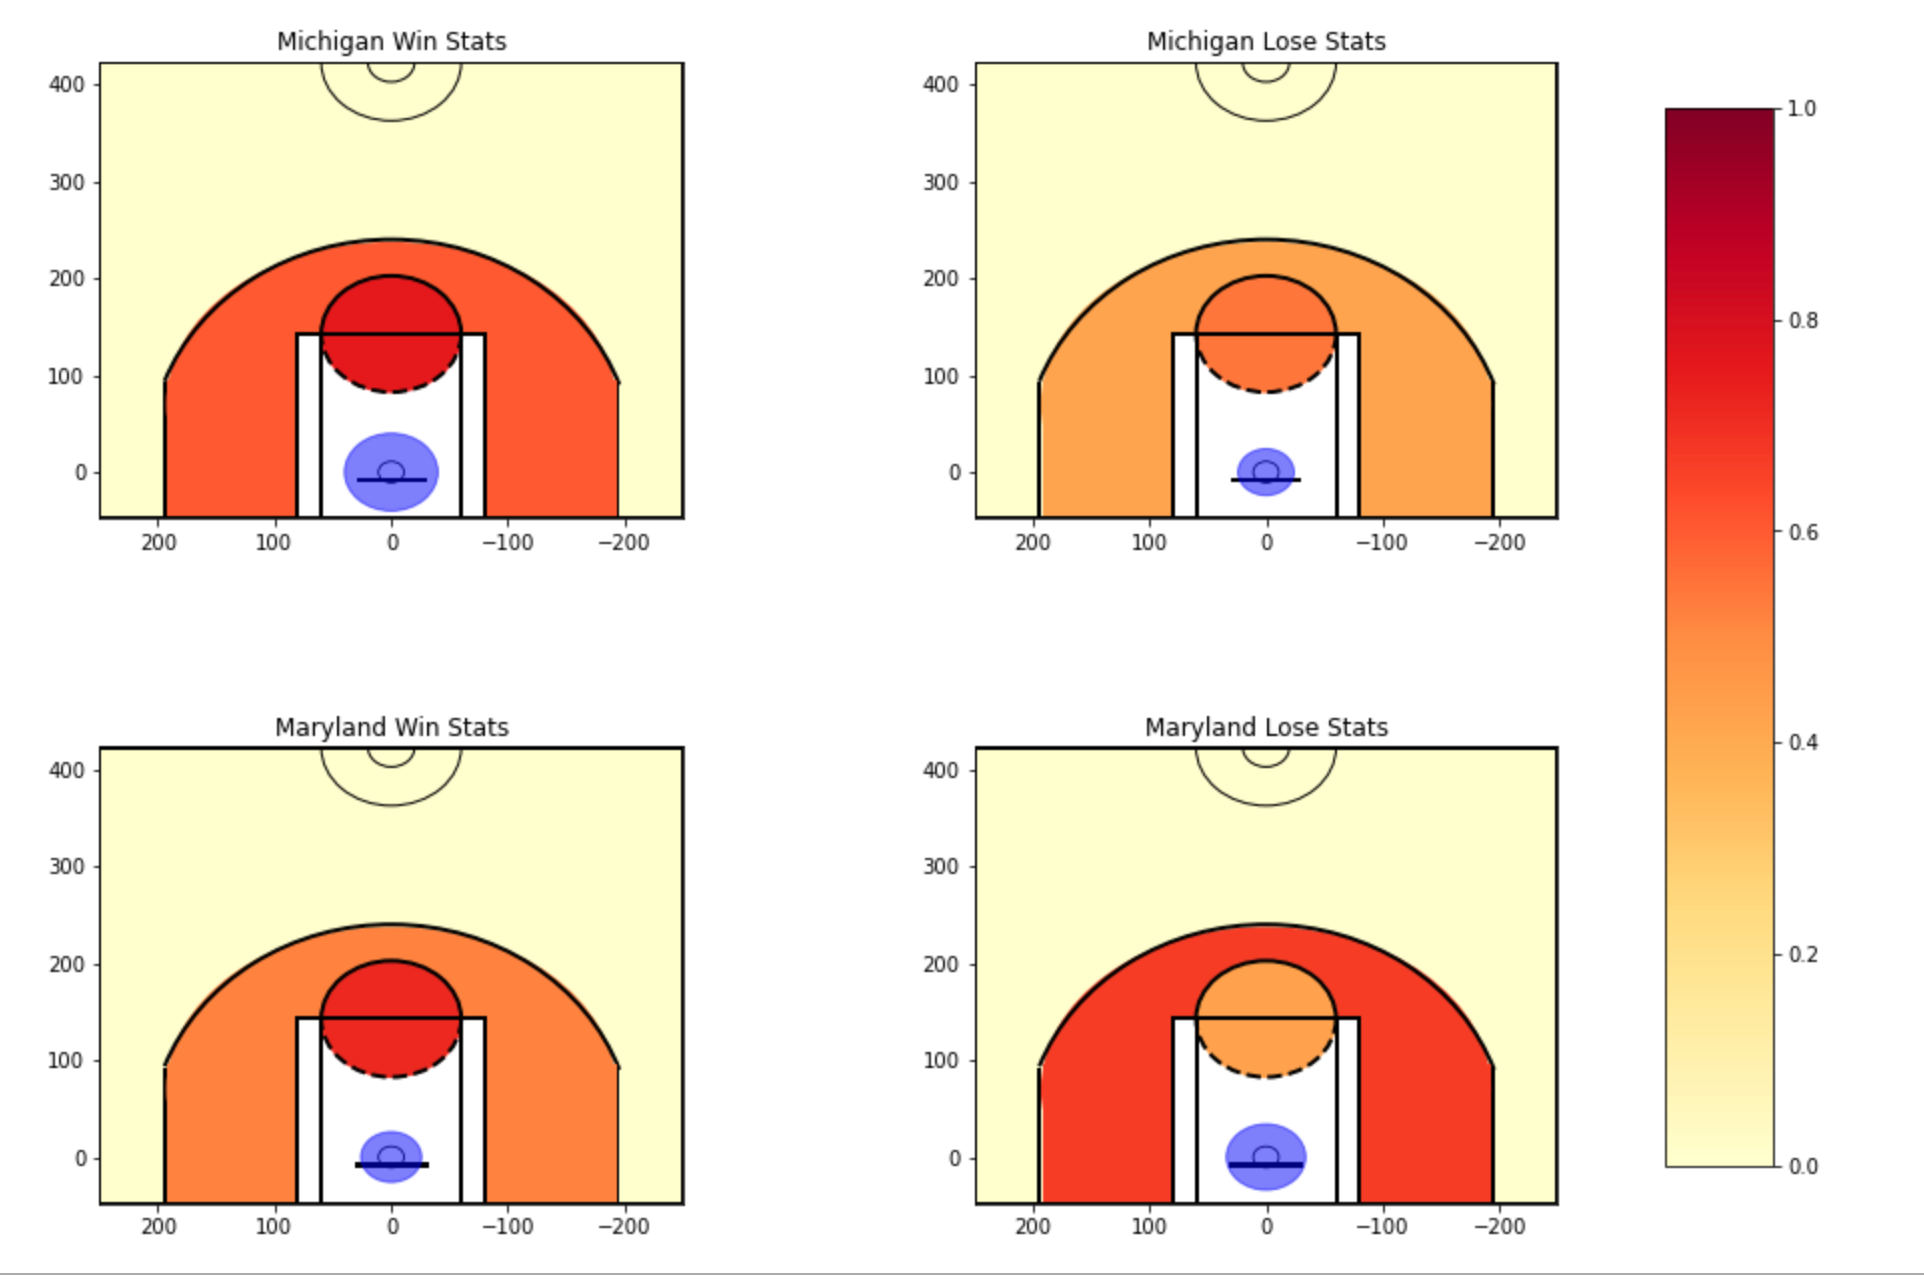
Team Shot Charts
-
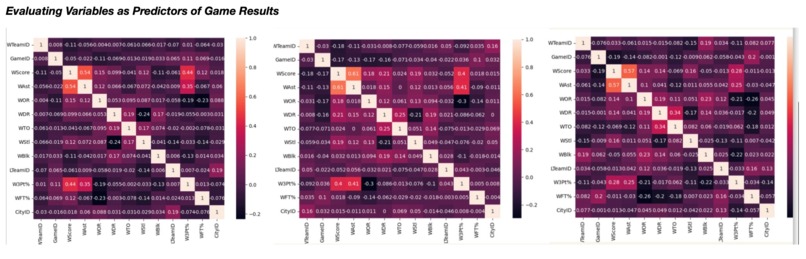
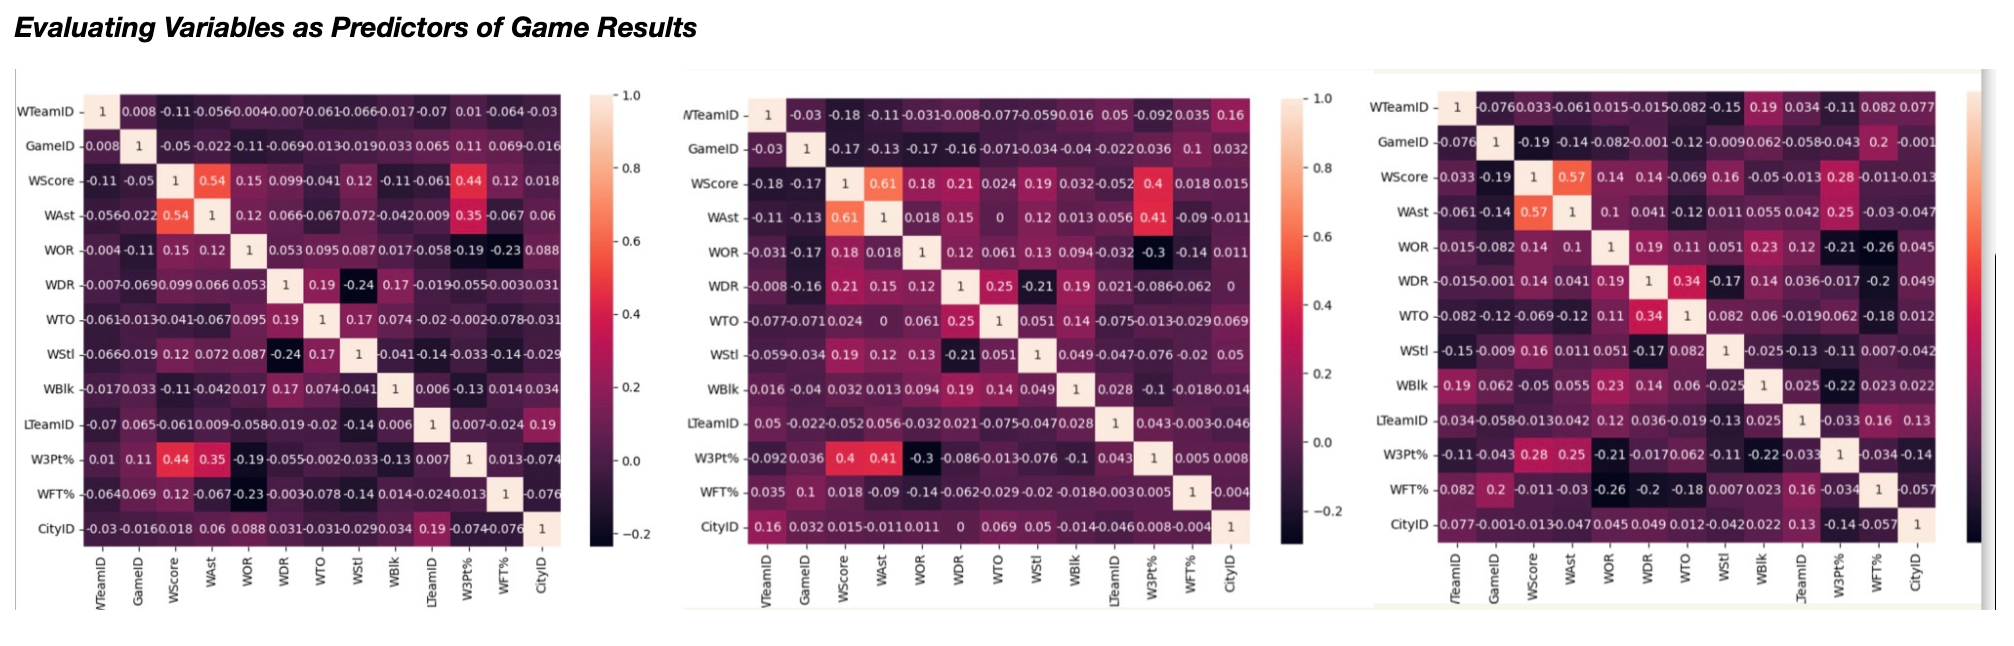
Exploratory Data Visualization
Inspiration
You would think that a team doing the sports analytics track centered around basketball insights would be superfans - but funnily enough, neither of us knew too much about basketball going in. However, we do still like to watch the sport, and our motivation to create this project mostly came from sheer curiosity; we thought it would be interesting to see how we could take what we see on a TV screen and examine it carefully over the years to see what kind of stories are being told and what insights we, and our users, could gain from this product.
What it does
In its fully realized version, the end user product of Ball(In)sights will be an interactive dashboard/website that a user can easily navigate, with options like:
- Explore data: Gives users access to many easily searchable exploratory visualizations, in case they are more data-oriented and want to examine the graphs/charts themselves, or for use in projects/analysis.
- Make predictions: Users can see predictions for upcoming games, or even theoretically input certain parameters for real or hypothetical game match-ups and receive a prediction of the winner and score.
- Shot charts: View beautiful and easy-to-understand shot charts of teams and players that provide a visual understanding of how both perform.
Currently, we have the raw aspects for this platform, but given our time constraints, putting everything into a usable interface is an upcoming future project.
How we built it
For the entire process, we used Python, with specialized libraries for working with data and machine learning.
- Data sourcing: Found relevant datasets on Kaggle and did some prep work on them to created csv's with more usable and clear metrics to be able to complete our project goal
- Dashboard Creation: Three planned components as follows; Shot chart by team to compare teams and their shooting accuracy statistics, Heatmap to detect which variable were the strongest predictors of game results, Regression plots using those variable to identify impact of game location on result, Predictive model based on these variables and using models like SVM, random forest and KNN (not in final dashboard)
Challenges we ran into
A challenge (as it always can be in working with data) was cleaning and engineering the data to be suitable for our needs. For example, for the shot charts, we would ideally have coordinates of where players made shots, but instead, we had to work around that with general areas given the data we used (e.g. 2 point shots attempted, 2 point shots made for teams), or breaking the data down in a way that would lend itself well to classification.
Accomplishments that we're proud of
We are proud of doing work with data that we've never done before
What we learned
We both gained lots of experience with and became much more comfortable with data engineering + cleaning, choosing features, and working with libraries like pandas and
What's next for Ball(In)sights
As mentioned above, creating a clean and beautiful user interface to give easy access to all of our insights is the next step!
Built With
- kaggle
- matplotlib
- numpy
- pandas
- python
- scikit-learn

Log in or sign up for Devpost to join the conversation.