Inspiration
The Baker Ripley Challenge.
What it does
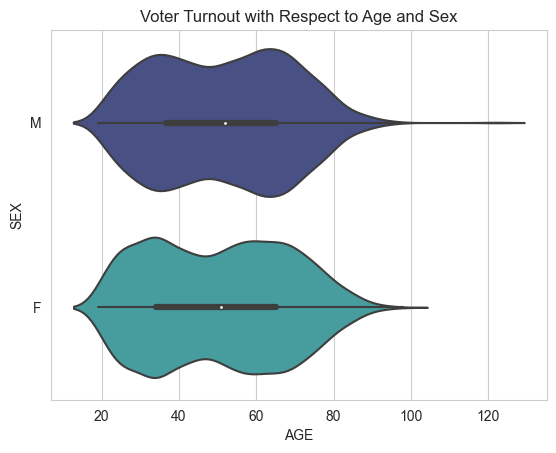
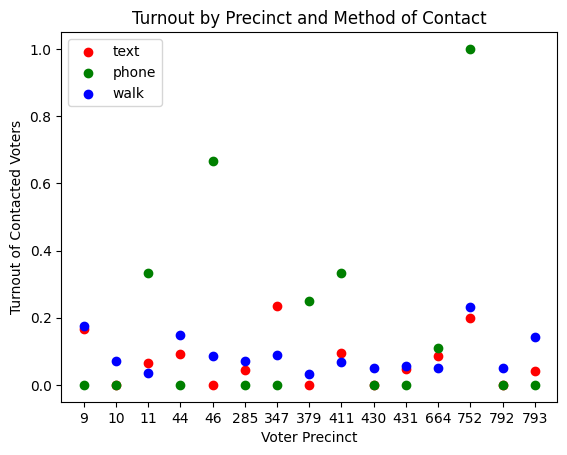
Who voted in the November election? What was the impact of each method? What about on different demographics? What was the cost of getting one person to vote? How did targeted precincts and non-targeted similar precincts compare to one another in terms of voter turnout?
How we built it
Python, Pandas, Matplotlib, Seaborn, Plotly, e.t.c.
Challenges we ran into
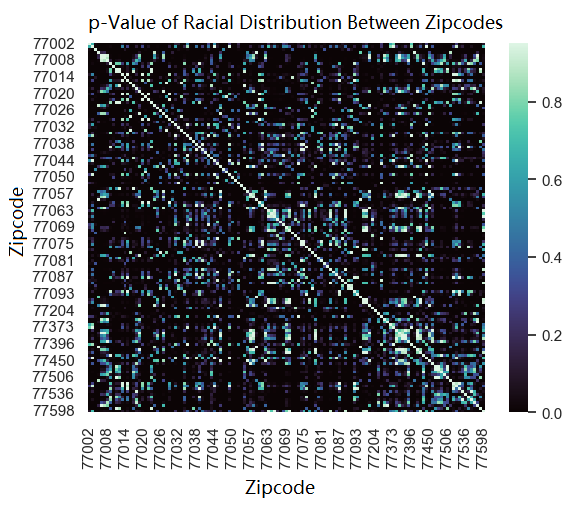
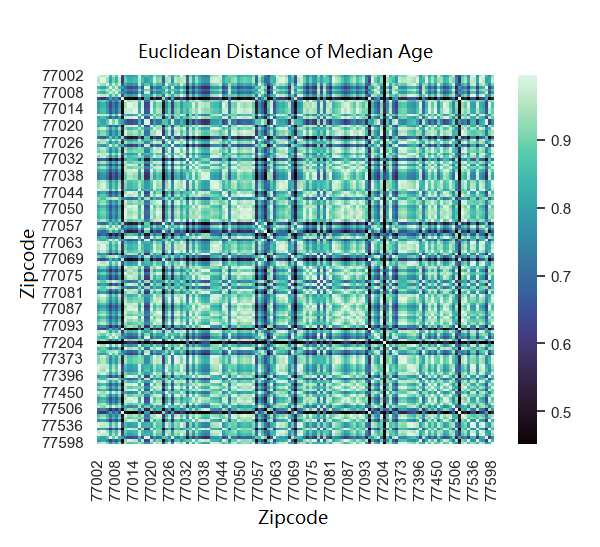
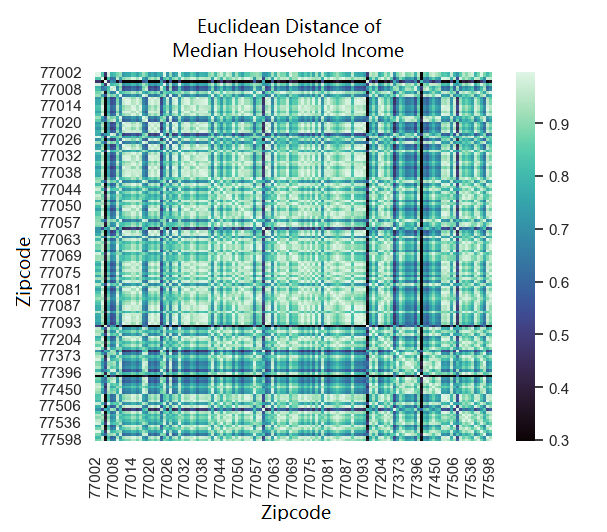
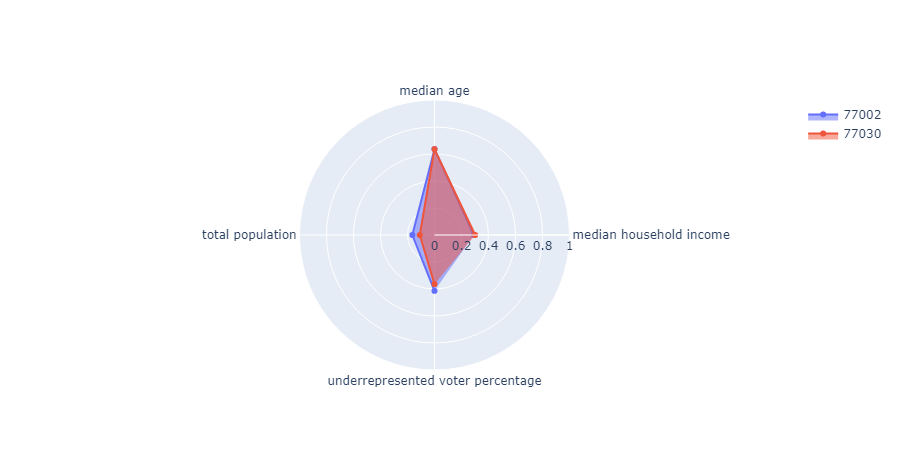
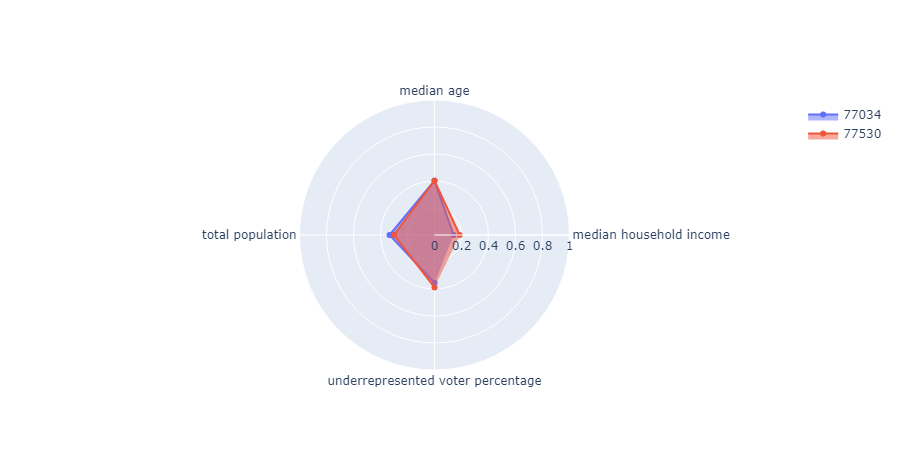
We were unable to find demographic data from precincts. We were, however, able to find demographic data from zipcodes, so we mapped each precinct to its corresponding zipcode, computed the most similar zipcode, and mappped that back to the most similar untargeted precinct. Another challenge was to see how to best visualize the data to get as much insight as possible.
Accomplishments that we're proud of
Underclassmen team, first Datathon. Finding and comparing similar precincts with the limited data that we had.
What we learned
Data analysis, and visualization packages in Python. Computing results and useful information from large quantities of data. Data cleaning was a large portion of the data analysis work.
What's next for Baker Ripley Impact Analysis
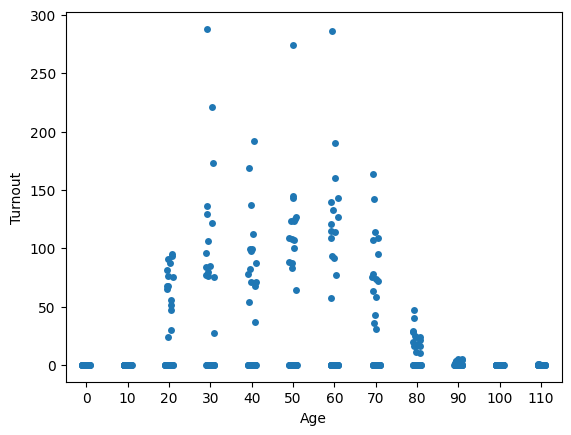
Walks had the best success of contacting a voter, but are also incredibly expensive. One solution would be to use walks to target specific areas or voters with demographics where voter turnout is the lowest. For example, older voters, or specific zip codes. Inexpensive texts and phone calls can be used to target lower priority voters.

Log in or sign up for Devpost to join the conversation.