-
-
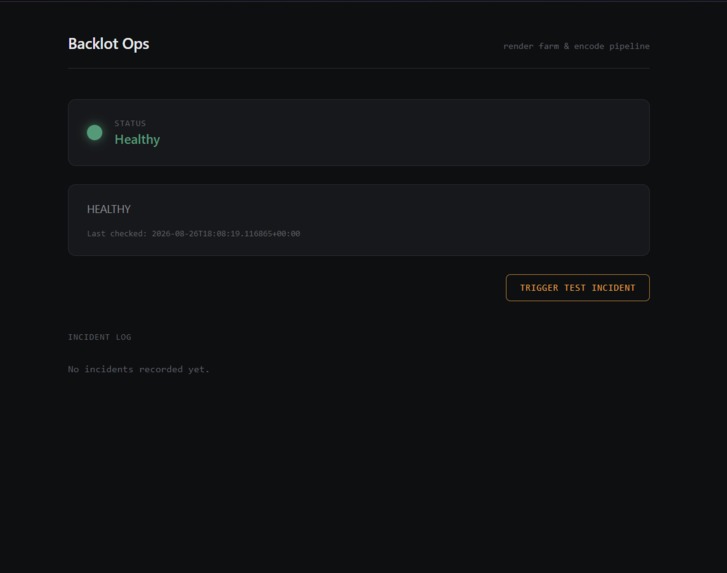
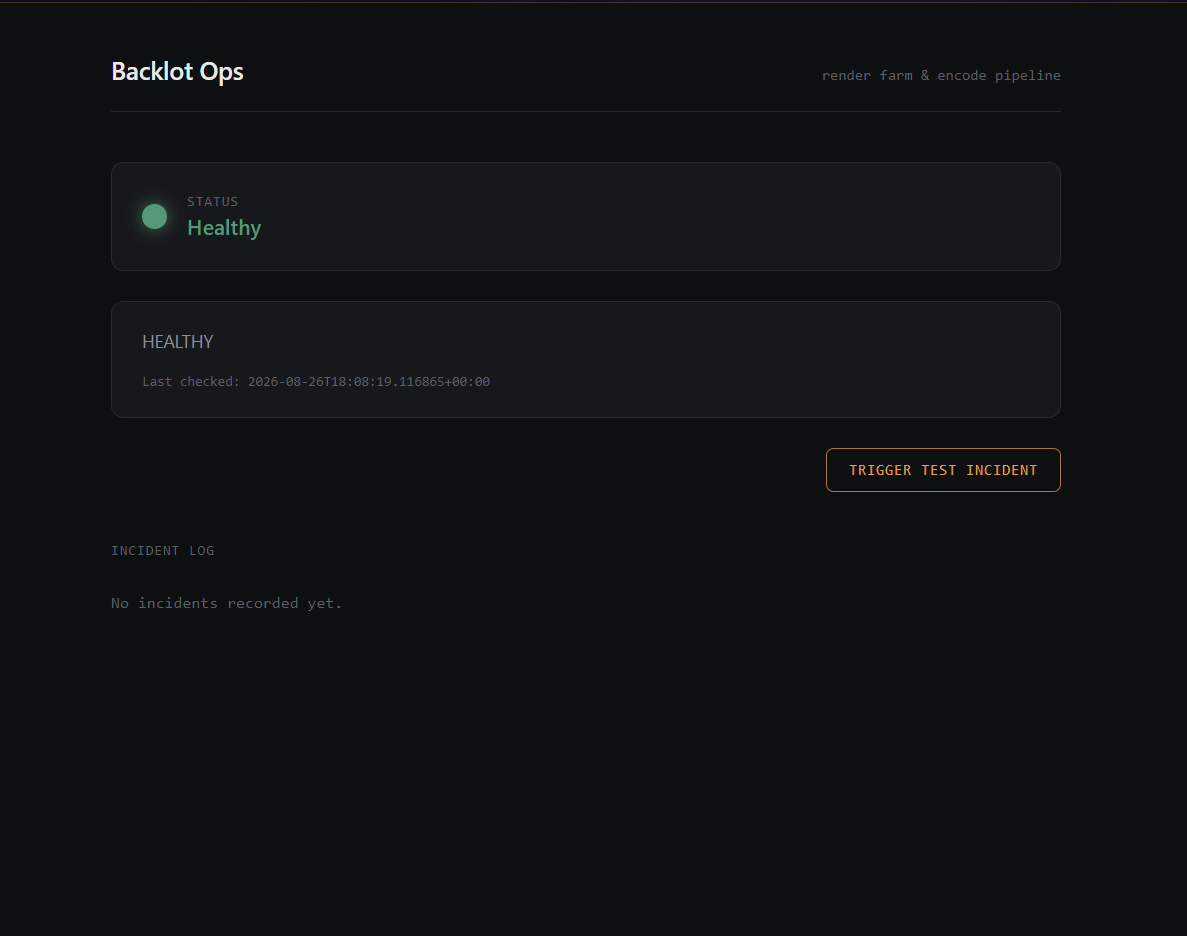
Showing dashboard when no incidents have been detected
-
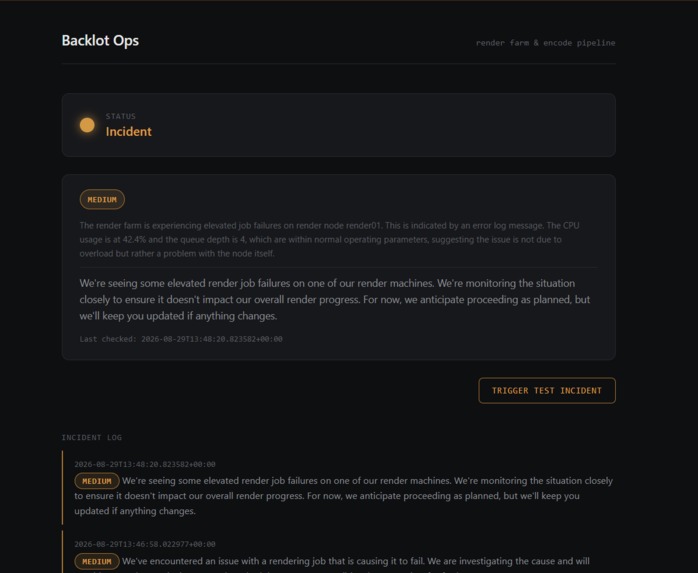
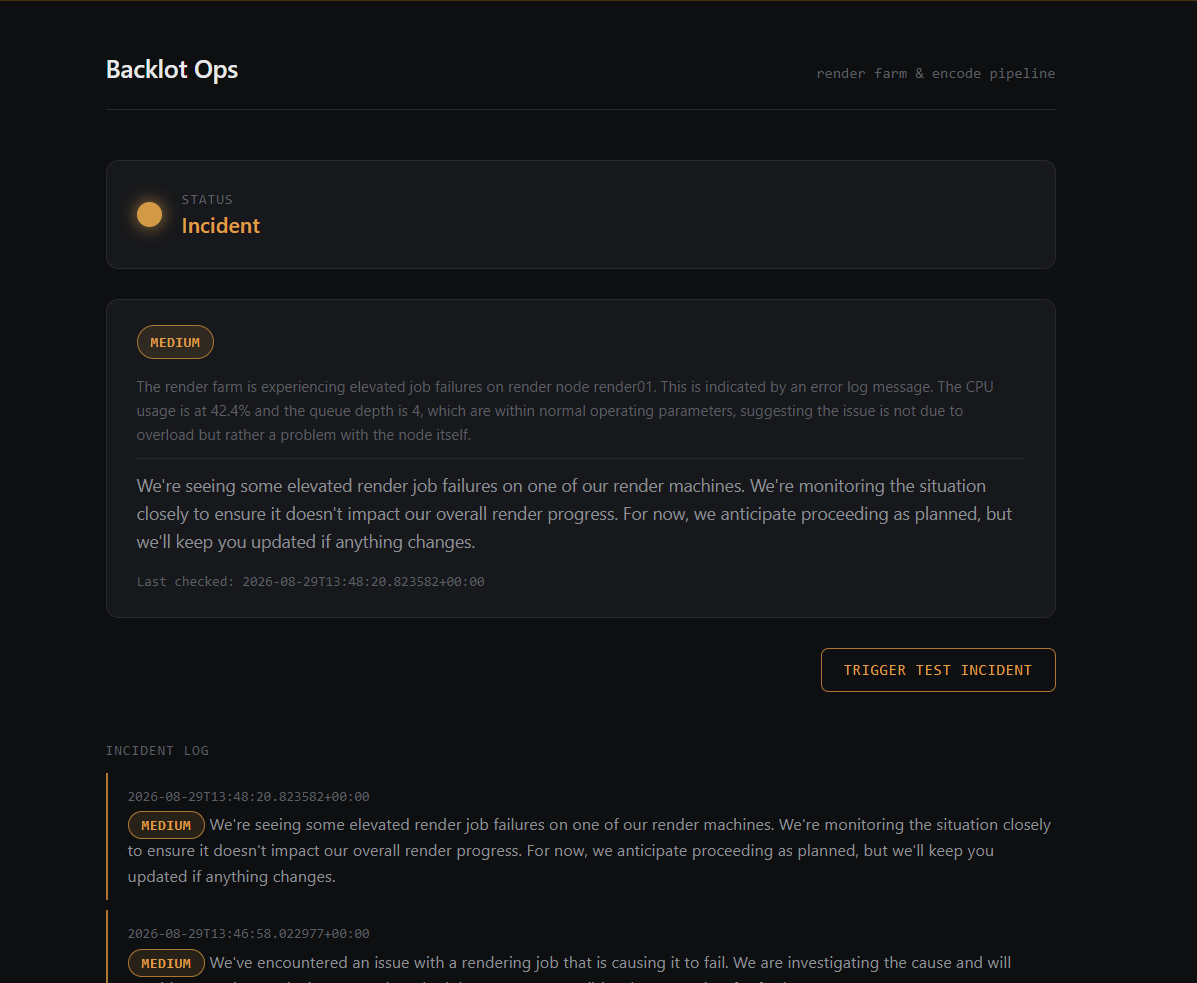
Shows updated dashboard and AI description of incident, including severity and recommendations
-
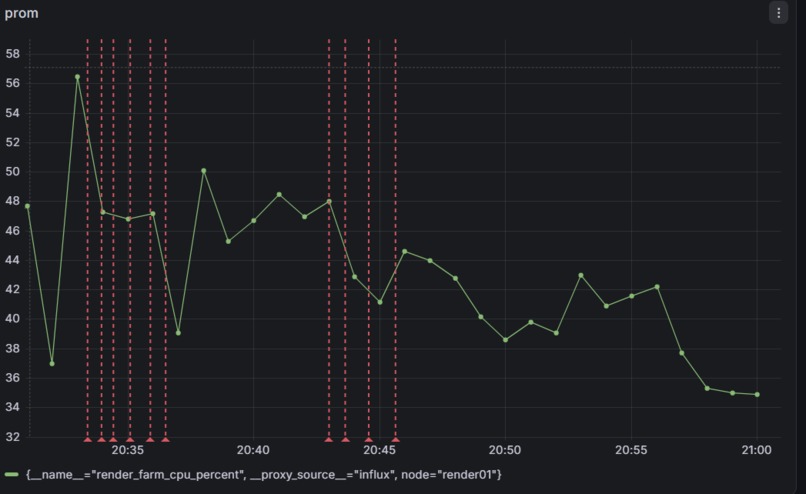
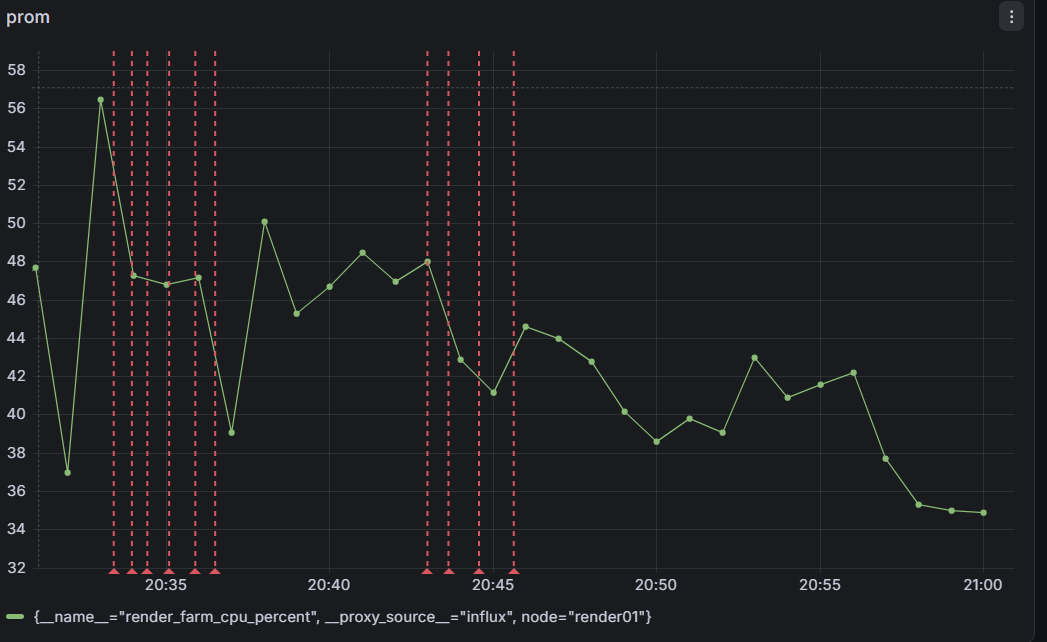
Live Grafana dashboard tracking render node CPU utilization, featuring automated incident annotations generated by Backlot Ops.
Inspiration
Modern animation and VFX pipelines deal with massive streams of engineering data—from render farm metrics to complex error logs. I noticed a major disconnect: while engineers stare at raw metrics, line producers and creative stakeholders just need to know if production schedules are at risk. I wanted to build a bridge between deep infrastructure telemetry and human-readable production management using AI agents.
What it does
Backlot Ops is an intelligent multi-agent system that monitors studio infrastructure in real-time. It pairs a technical agent analysing Grafana metrics and logs with a line producer agent that translates technical incidents into business impact summaries. It also features live Grafana dashboard annotations so teams can instantly trace system bottlenecks right back to production milestones. Detection is event-driven: Grafana's own alert rules trigger the agent investigation directly via webhook the moment a real threshold is breached, rather than relying solely on scheduled polling.
How I built it
- AI & Agents: Powered by the Gemini API for multi-agent reasoning, alongside an experimental Gemini TTS (
gemini-3.1-flash-tts-preview) audio generation module for voice alerts. - Telemetry & Monitoring: Integrated heavily with Grafana (Metrics, Logs, and Annotations API) to pull and mark real-time system data. Configured Grafana alert rules (Prometheus threshold and Loki log-based) routed through a webhook contact point to a FastAPI endpoint, enabling sub-minute incident detection without constant polling.
- Infrastructure & Security: Hardened using FastAPI rate-limiting (slowapi), dynamic CORS middleware, and strict Google Cloud Run container instance caps for cost protection.
- Deployment: Packaged as a containerised web application deployed live on Google Cloud Run.
Challenges I ran into
Getting the multi-agent system to synthesize low-level infrastructure errors into clear, non-technical stakeholder updates without losing accuracy was tricky. I also had to overcome cloud container port binding timeouts during my initial Google Cloud Run deployments, which I solved by properly configuring environment variables and secure runtime permissions. Building the event-driven webhook path surfaced a concurrency issue where simultaneous agent investigations (from polling and webhook triggers) contended over the same MCP subprocess connection - solved with an asyncio lock to serialize agent calls. I also diagnosed an under-provisioned Cloud Run container causing MCP session timeouts under load, fixed by increasing the memory and CPU allocation.
Accomplishments that I'm proud of
- Successfully deploying a multi-agent AI system live to Google Cloud Run with a fully functioning public URL.
- Building a seamless integration with Grafana's Metrics, Logs, and Annotations APIs so that system failures automatically drop live visual markers onto performance graphs.
- Building a resilient, event-driven alerting pipeline where Grafana's own alert rules trigger real-time agent investigations via webhook, with proper concurrency handling and automatic incident resolution.
- Successfully experimenting with cutting-edge Gemini features, including multi-modal reasoning agents and native audio generation (
gemini-3.1-flash-tts-preview).
What I learned
I gained a deep appreciation for how multi-modal AI agents can bridge the gap between backend engineering telemetry and frontend business intelligence, and learned a ton about deploying secure containerized Python apps to Google Cloud.
What's next for Backlot-ops
- Fully integrating the experimental TTS voice alert module into the active incident-handling loop so stakeholders receive audio briefings.
- Expanding the multi-agent system to handle predictive scaling alerts before production downtime is caused.
- Adding customisable dashboard templates for different studio departments (e.g., lighting, compositing, and pipeline engineering).

Log in or sign up for Devpost to join the conversation.