-
-
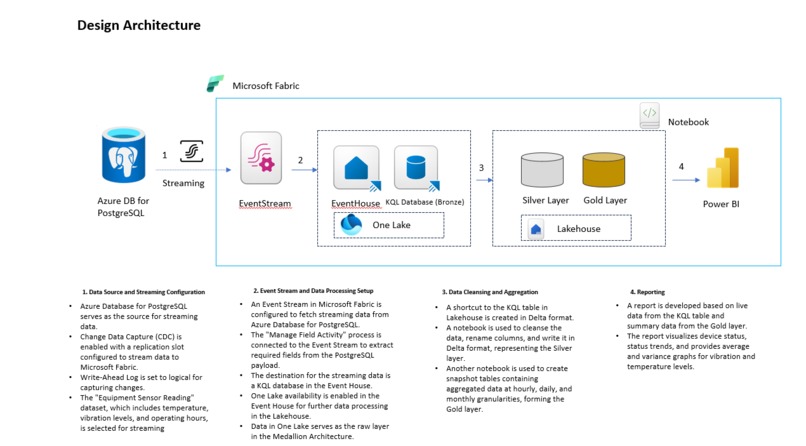
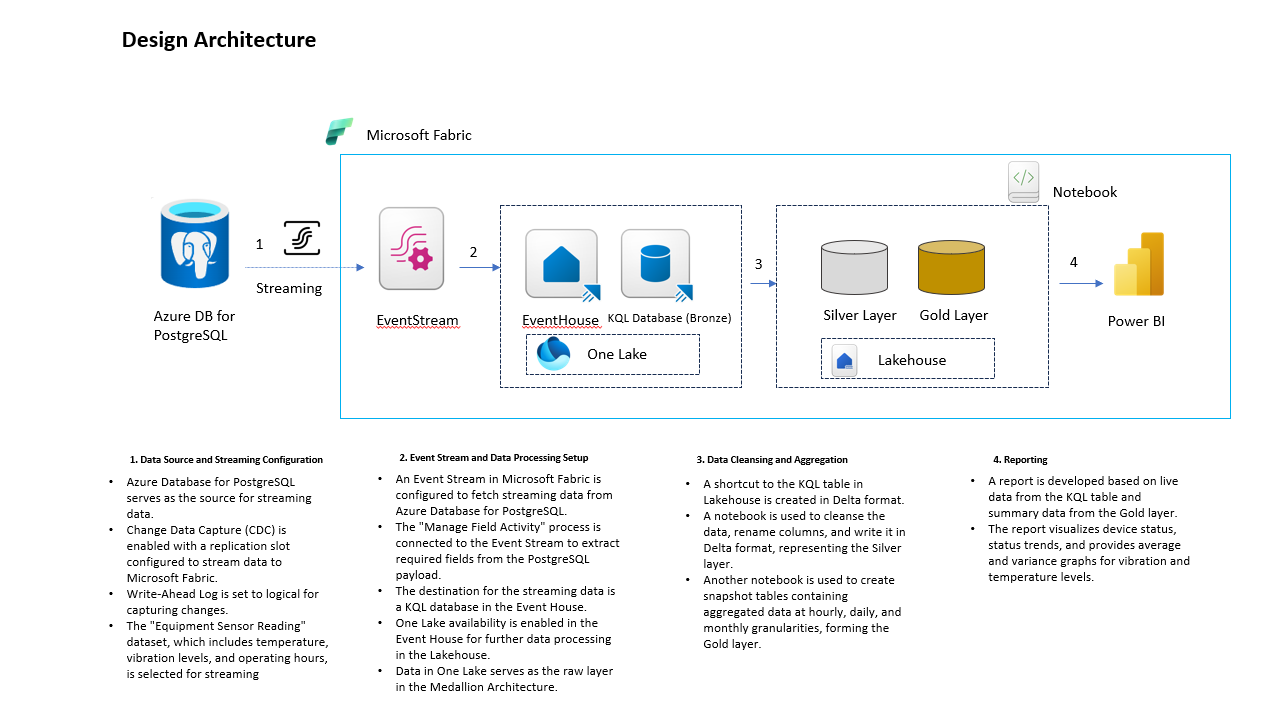
Design Architecture
Inspiration
The inspiration for this project stemmed from the need to continuously monitor the health of industrial equipment using real-time sensor data. Sensors on devices capture metrics like temperature and vibration levels every minute, and by analyzing this data, we can predict failures before they occur. This can drastically reduce downtime and improve operational efficiency. Leveraging Azure’s cloud ecosystem and modern data architecture, we aimed to build a system that enables proactive maintenance and equips decision-makers with the data they need to ensure smooth operations.
What it does
This project focuses on real-time monitoring of equipment health through sensor data. The core functionality includes:
- Capturing real-time temperature and vibration data from devices via Azure Database for PostgreSQL with Change Data Capture (CDC) enabled.
- Streaming this data to a KQL database for real-time analysis and storage.
- Using a snapshot table to maintain the latest device status using Medallion Architecture for efficient reporting.
- Providing an interactive Power BI report that visualizes the device health, status trends, and sensor readings, enabling stakeholders to track equipment performance in real-time and take action proactively.
How we built it
We built the project using several Fabric components and best practices for real-time data streaming and analytics:
Azure Database for PostgreSQL with CDC: We started by setting up a PostgreSQL database with CDC enabled to track changes in equipment sensor readings. This allowed us to stream data updates as soon as they occurred.
Event Stream Creation: We created an event stream that linked the PostgreSQL database to the downstream system. The stream was configured to select specific fields (temperature, vibration, transaction type, and timestamp) from the CDC payload.
Downstream KQL Database: Data was then streamed into a KQL (Kusto Query Language) database, where a new table was created to store the raw sensor data for analysis.
Snapshot Table (SCD Type 1): A snapshot table was set up using the Medallion Architecture to store the latest status of each device (normal, warning, or faulty). This table was essential for providing an up-to-date view of the equipment for reporting purposes.
Power BI Reporting: Finally, a Power BI report was built using data from the KQL table and the snapshot table. The report displayed key metrics such as:
- Device health status (normal, warning, faulty)
- Trends in device status changes
- Line charts showing temperature and vibration levels
- A table visual with complete device details for further analysis
Challenges we ran into
Real-Time Data Stream Integration: Integrating the real-time sensor data from PostgreSQL into a downstream system posed a few challenges. Ensuring data consistency and minimizing delays in the streaming process required fine-tuning of the CDC configuration.
Handling High-Frequency Data: Since sensor data is captured every minute, managing a high volume of data in near real-time was a challenge. Optimizing the event stream for performance was crucial to ensure smooth operation.
Data Consistency in the Snapshot Table: Maintaining accurate and consistent device status in the snapshot table was tricky. We had to ensure that the latest data was correctly reflected, without introducing duplicates or missing entries.
Power BI Performance: Since real-time data is constantly being streamed, ensuring that Power BI reports didn’t lag when loading large datasets was another hurdle. We had to optimize queries and Power BI’s data models to handle this in a scalable way.
Accomplishments that we're proud of
Real-Time Monitoring: Successfully set up a real-time data streaming pipeline that allows for continuous monitoring of equipment health, providing timely insights into the status of devices.
Medallion Architecture Implementation: Implemented a Medallion Architecture to maintain a snapshot of the latest equipment statuses, which is essential for providing accurate and up-to-date reports.
Interactive Power BI Report: Built a dynamic Power BI dashboard that visualizes trends, device statuses, and sensor readings. This gives stakeholders a clear picture of equipment health and allows them to track changes over time.
Predictive Insights: By combining historical and real-time data, the system lays the foundation for predictive maintenance, helping identify patterns in sensor data that could indicate impending equipment failures.
What we learned
- Microsoft Fabric as a One-Stop Solution: A major learning from this project was the power of Microsoft Fabric as an integrated, end-to-end solution for data processing and reporting. We were able to leverage Microsoft Fabric to:
- Seamlessly fetch and stream data via Event Stream, which connects directly to our source (Azure Database for PostgreSQL).
- Use the Event House to land the streaming data in OneLake, a unified data lake that acts as the central repository.
Efficiently integrate this data into reporting and analytics by connecting it to downstream services, such as KQL databases and Power BI for dynamic, real-time insights.
- Data Architecture: Implementing the Medallion Architecture helped us understand how to efficiently store raw data and derive insights from it, ensuring scalability and performance.
- Power BI Optimization: We learned how to optimize Power BI reports to handle large amounts of real-time data without sacrificing performance, enabling users to interact with the data efficiently.
What's next for Real Time Equipment Monitoring and Predictive Maintenance
Predictive Analytics: With historical and real-time data in place, the next phase will focus on building machine learning models to predict device failures based on sensor data patterns. This will help shift the system from reactive to truly predictive maintenance.
Enhanced Reporting: We plan to enhance the Power BI dashboards further by integrating more advanced visualizations, such as anomaly detection, to highlight potential issues proactively.
Built With
- azure
- eventhouse
- eventstream
- kql
- microsoftfabric
- postgresql
- pyspark
- python
- sql
- visualstudiocode


Log in or sign up for Devpost to join the conversation.