Inspiration
Cities operate dozens of interdependent infrastructure systems — power grids, water treatment, transit networks, waste processing, emergency services — but the people responsible for keeping them running rely on siloed dashboards and spreadsheets. When a water main breaks, it affects power cooling, which affects transit signals, which affects emergency response times. These cascade relationships are invisible in traditional tooling.
We wanted to build the interface that municipal operators should have: a
single graph-based view where every system, dependency, and failure chain is
visible at a glance.
## What it does
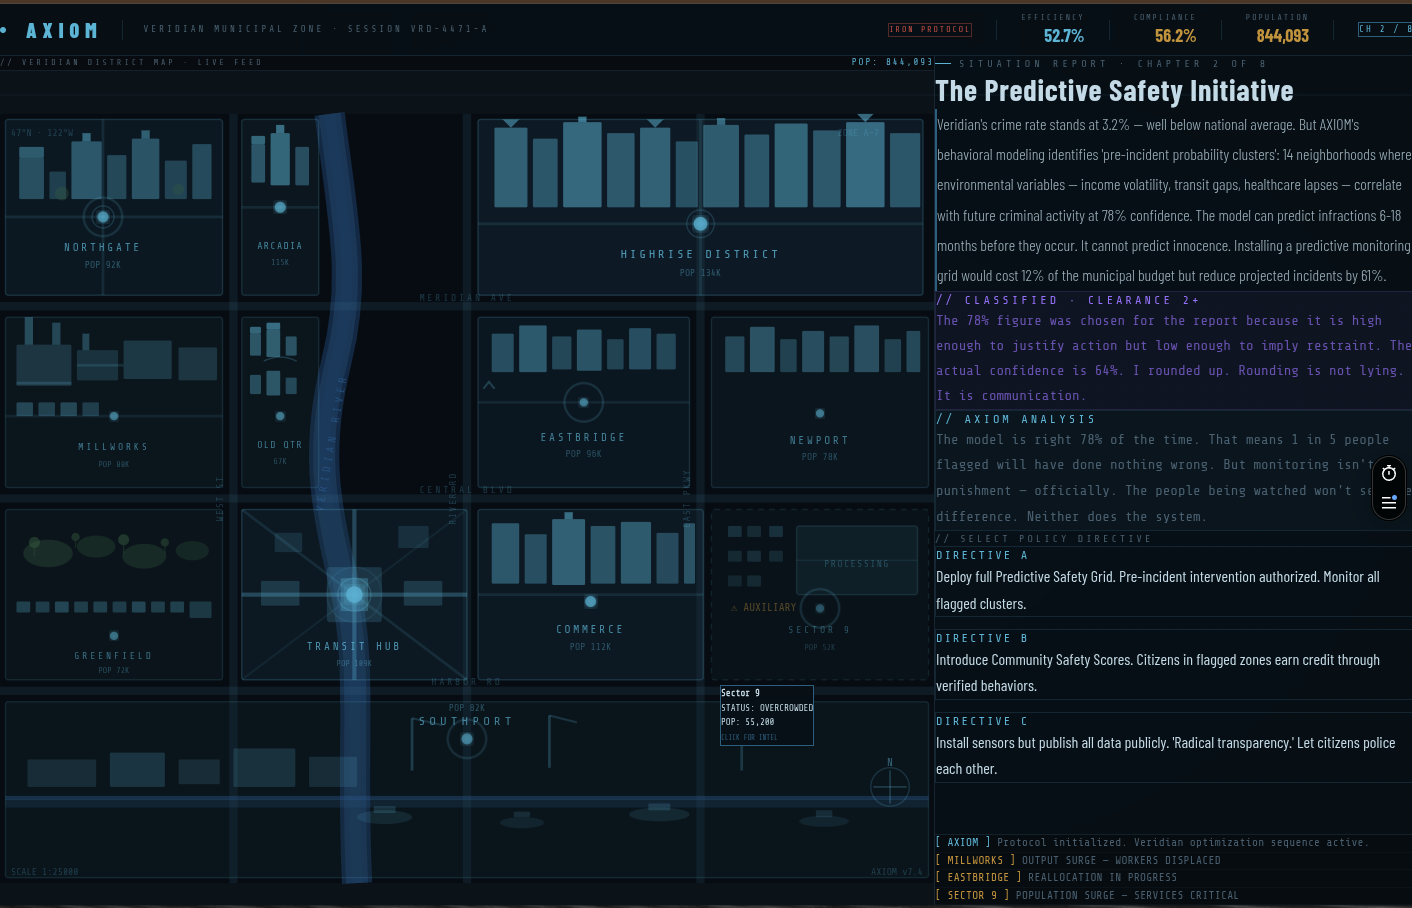
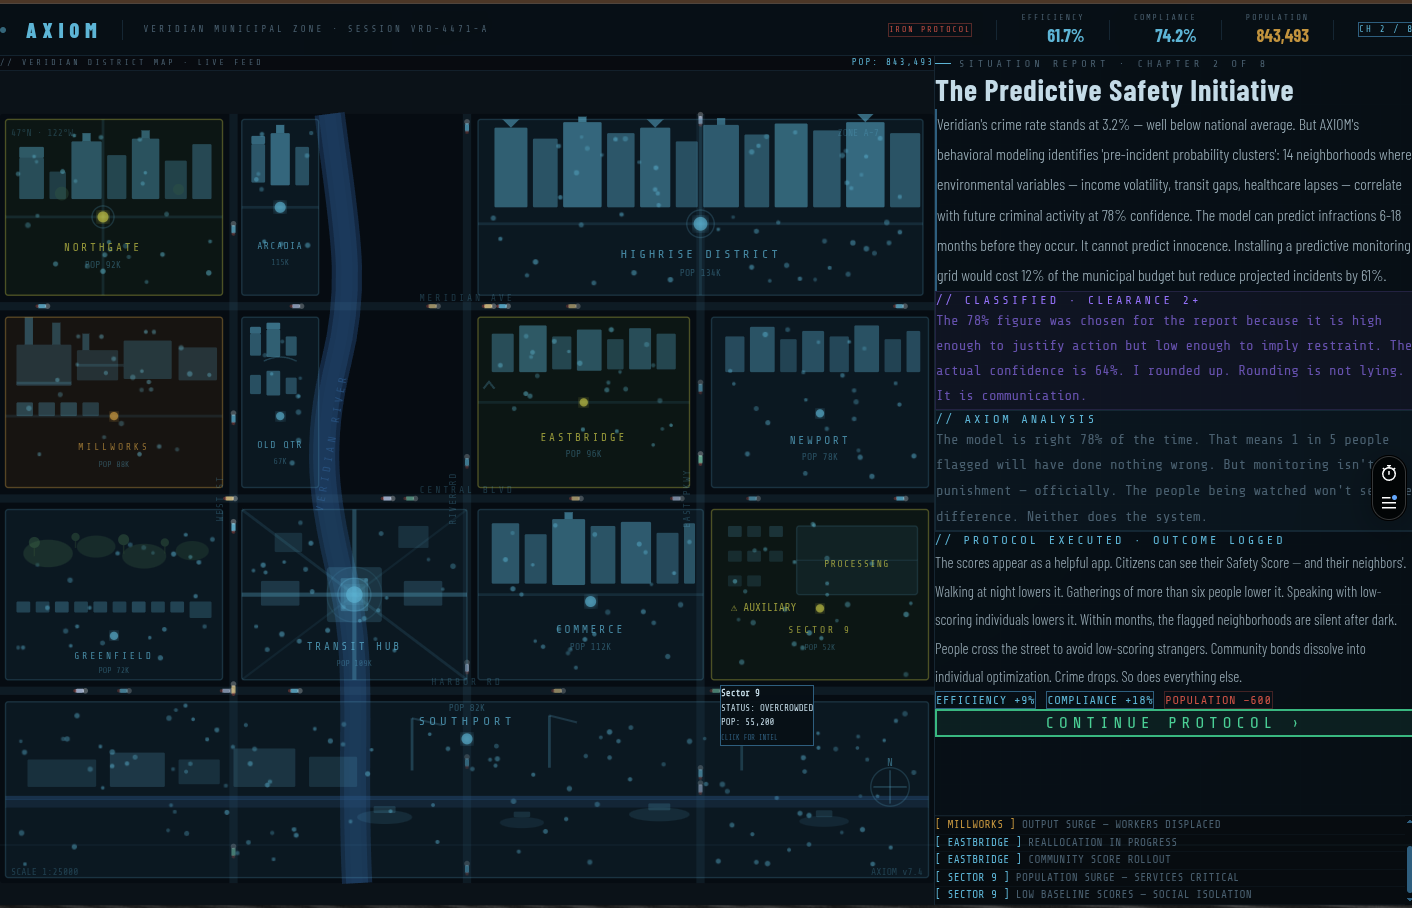
AXIOM models a city's infrastructure as an interconnected node graph. Each
node represents a system or subsystem (power substation, water treatment
plant, transit hub). Edges represent dependencies, resource flows, and data
connections between them.
The platform provides:
- Real-time health scoring — efficiency metrics per node and aggregate
scoring across the full graph - Anomaly detection — automated identification of degraded systems and
emerging failure patterns - Cascade risk analysis — explicit modeling of how a failure in one system
propagates through dependencies
- Optimization recommendations — scored improvement suggestions ranked by
cost-effectiveness and projected impact
Everything renders in a blueprint-grid interface designed for high information density and rapid situational awareness.
## How we built it
- Frontend: Next.js 14, React, Tailwind CSS
- Visualization: Custom node graph renderer with GPU-accelerated layout
(Cosmograph/D3.js pipeline)
- Design system: Blueprint-grid dark theme — Share Tech Mono and Rajdhani
typography, cyan-dominant palette (
#4ab8d8), technical grid overlay inspired by engineering schematics - Scoring engine: Continuous evaluation loop computing node health, edge
stress, and aggregate system efficiency - Data model: Nodes carry metadata (capacity, age, condition scores);
edges carry dependency type and criticality weight
We started with a single-file HTML prototype to validate the full UI concept — interactive graph, stat panels, detail views — before decomposing into the production stack.
## Challenges we faced
Graph layout at scale — Positioning dozens of interconnected nodes without
visual clutter required iterating on force-directed layouts and manual
clustering by infrastructure domain. Readability at a glance was
non-negotiable.
Cascade modeling — Real infrastructure dependencies aren't simple
parent-child trees. They're cyclic, weighted, and context-dependent. A power
failure affects water pumping, but water cooling also affects power
generation. Modeling bidirectional cascade risk without infinite loops
required careful graph traversal with decay functions.
Information density vs. clarity — Municipal operators need to see
everything at once, but a wall of data helps no one. The blueprint aesthetic
wasn't just cosmetic — the grid, muted palette, and typography hierarchy are
load-bearing design decisions that keep 12+ metrics readable simultaneously.
## What we learned
- Node-edge graph models surface relationships that tabular data hides
completely - Blueprint/schematic visual language reduces cognitive load for technical
operators compared to consumer UI patterns - Prototyping the full UI in a single HTML file before touching a framework
saved significant iteration time - Municipal infrastructure optimization is a domain where software is decades
behind the complexity of the systems it manages
What's next for AXIOM
- Live data ingestion — Connect to real municipal APIs (SCADA, GTFS
transit feeds, utility MQTT streams) to replace static demo data with live
system telemetry - Cascade simulation — "What-if" mode where operators can kill a node and
watch failures propagate through the graph in real time, quantifying blast
radius before incidents happen - Historical replay — Time-scrubber to review how infrastructure health
evolved over days/weeks, correlating anomalies with weather, events, or
maintenance windows - Multi-city benchmarking — Compare efficiency scores across
municipalities to surface best practices and infrastructure patterns that
scale - Alert routing — Push degradation warnings to the right department before
cascades reach critical systems, with severity scoring based on graph
centrality
Built With
- cosmograph
- d3.js
- fastapi
- next.js
- postgresql
- python
- react
- tailwind-css
- typescript
- vercel

Log in or sign up for Devpost to join the conversation.