-
-
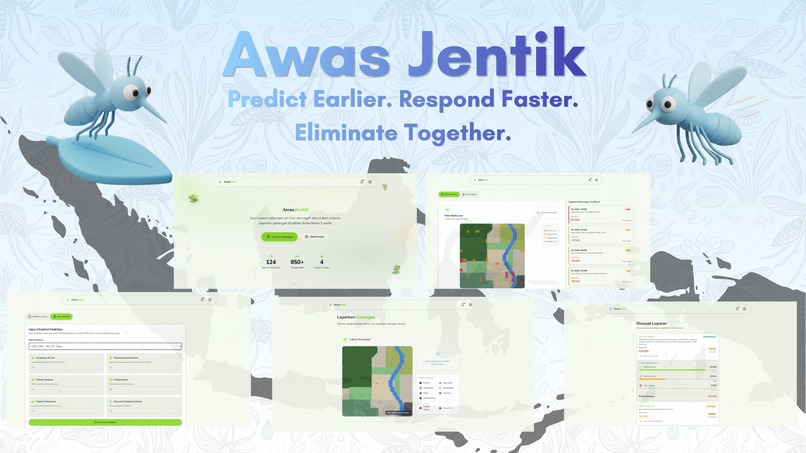
Awas Jentik
-
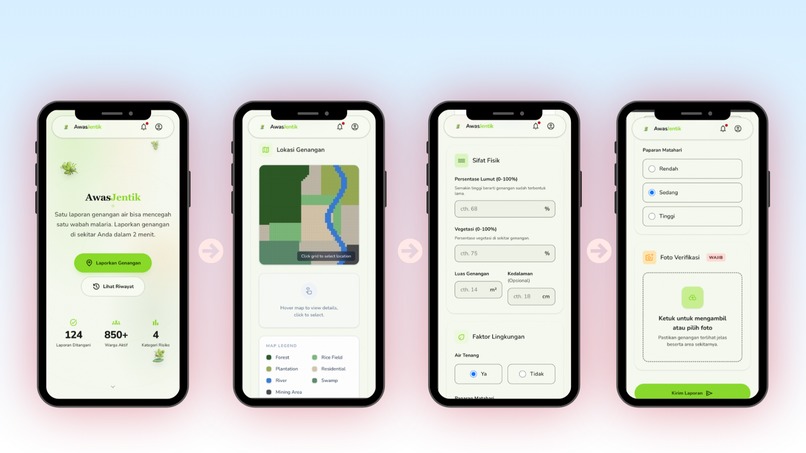
Fitur Utama
-
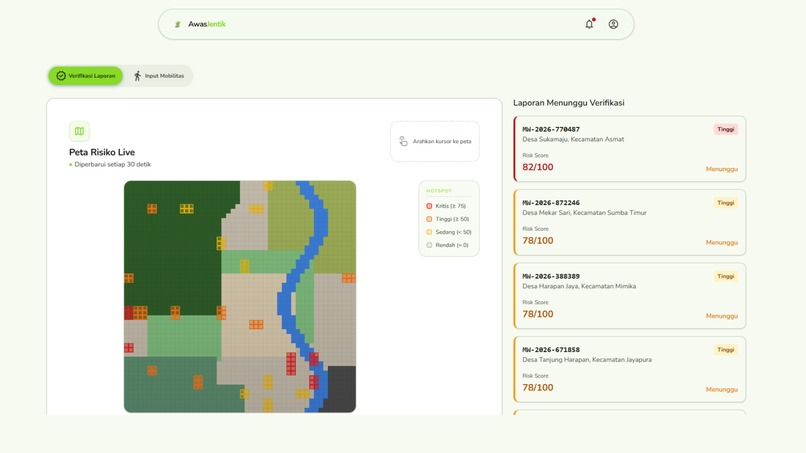
Kader Dashboard
-
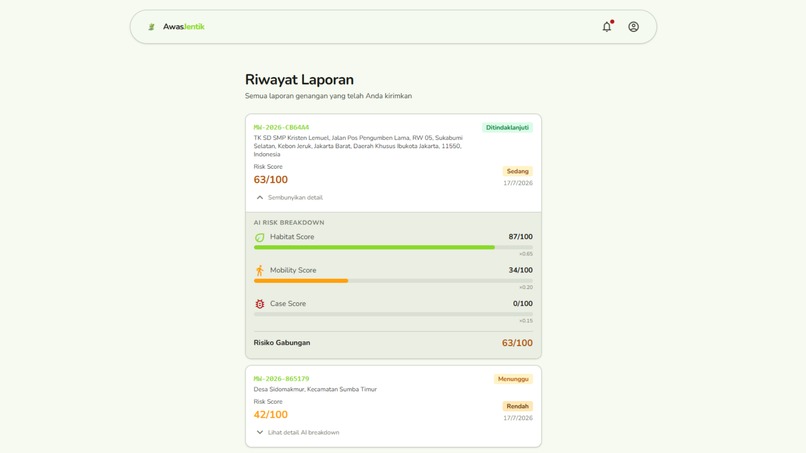
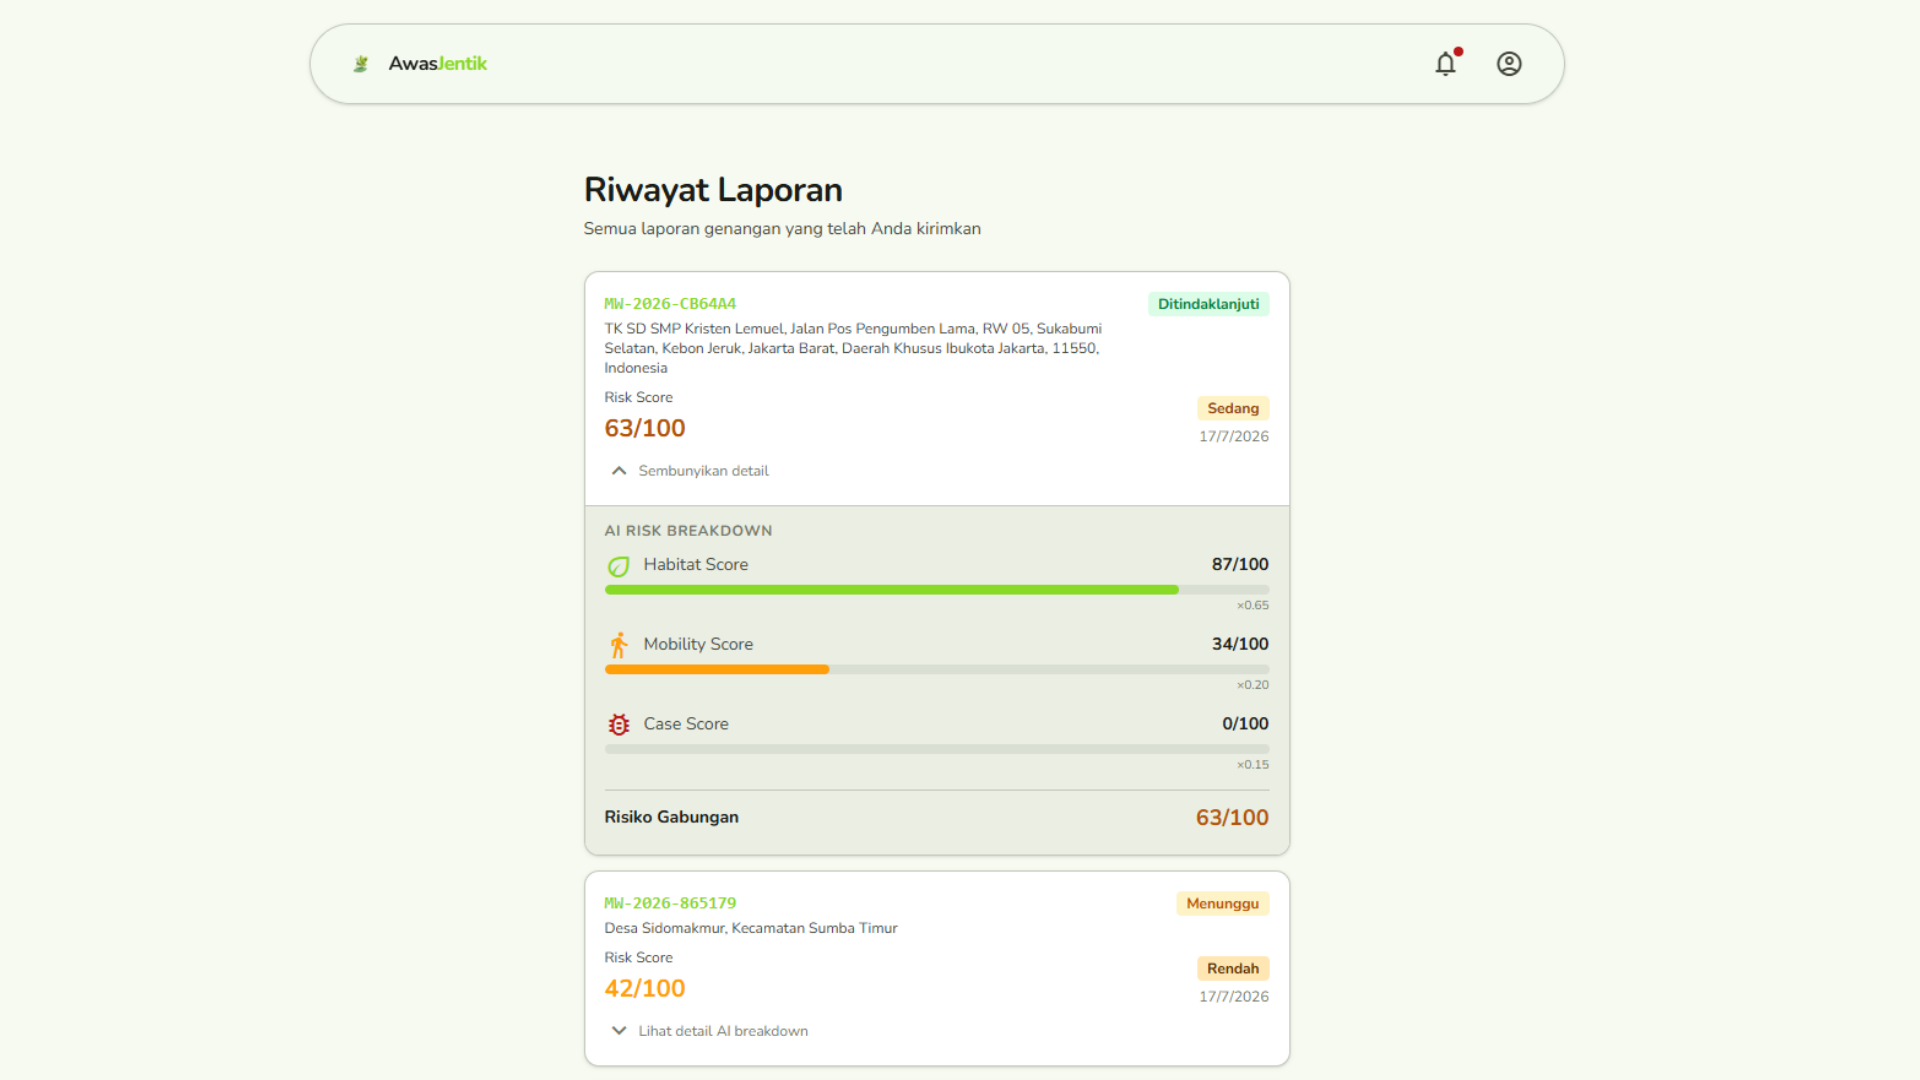
Riwayat Laporan
-
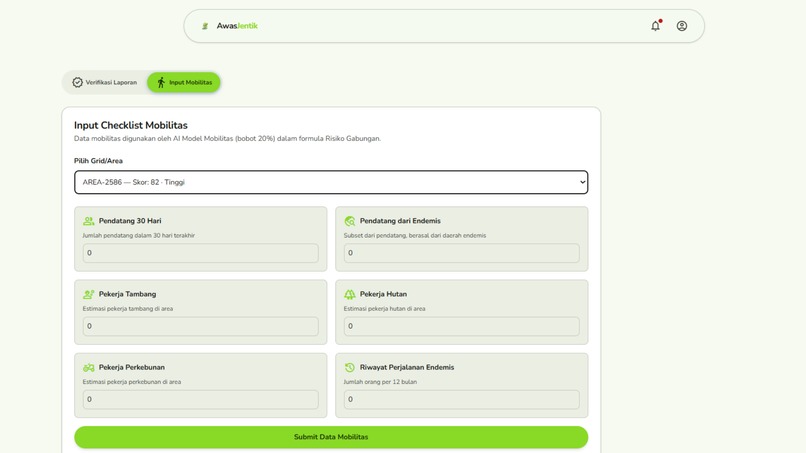
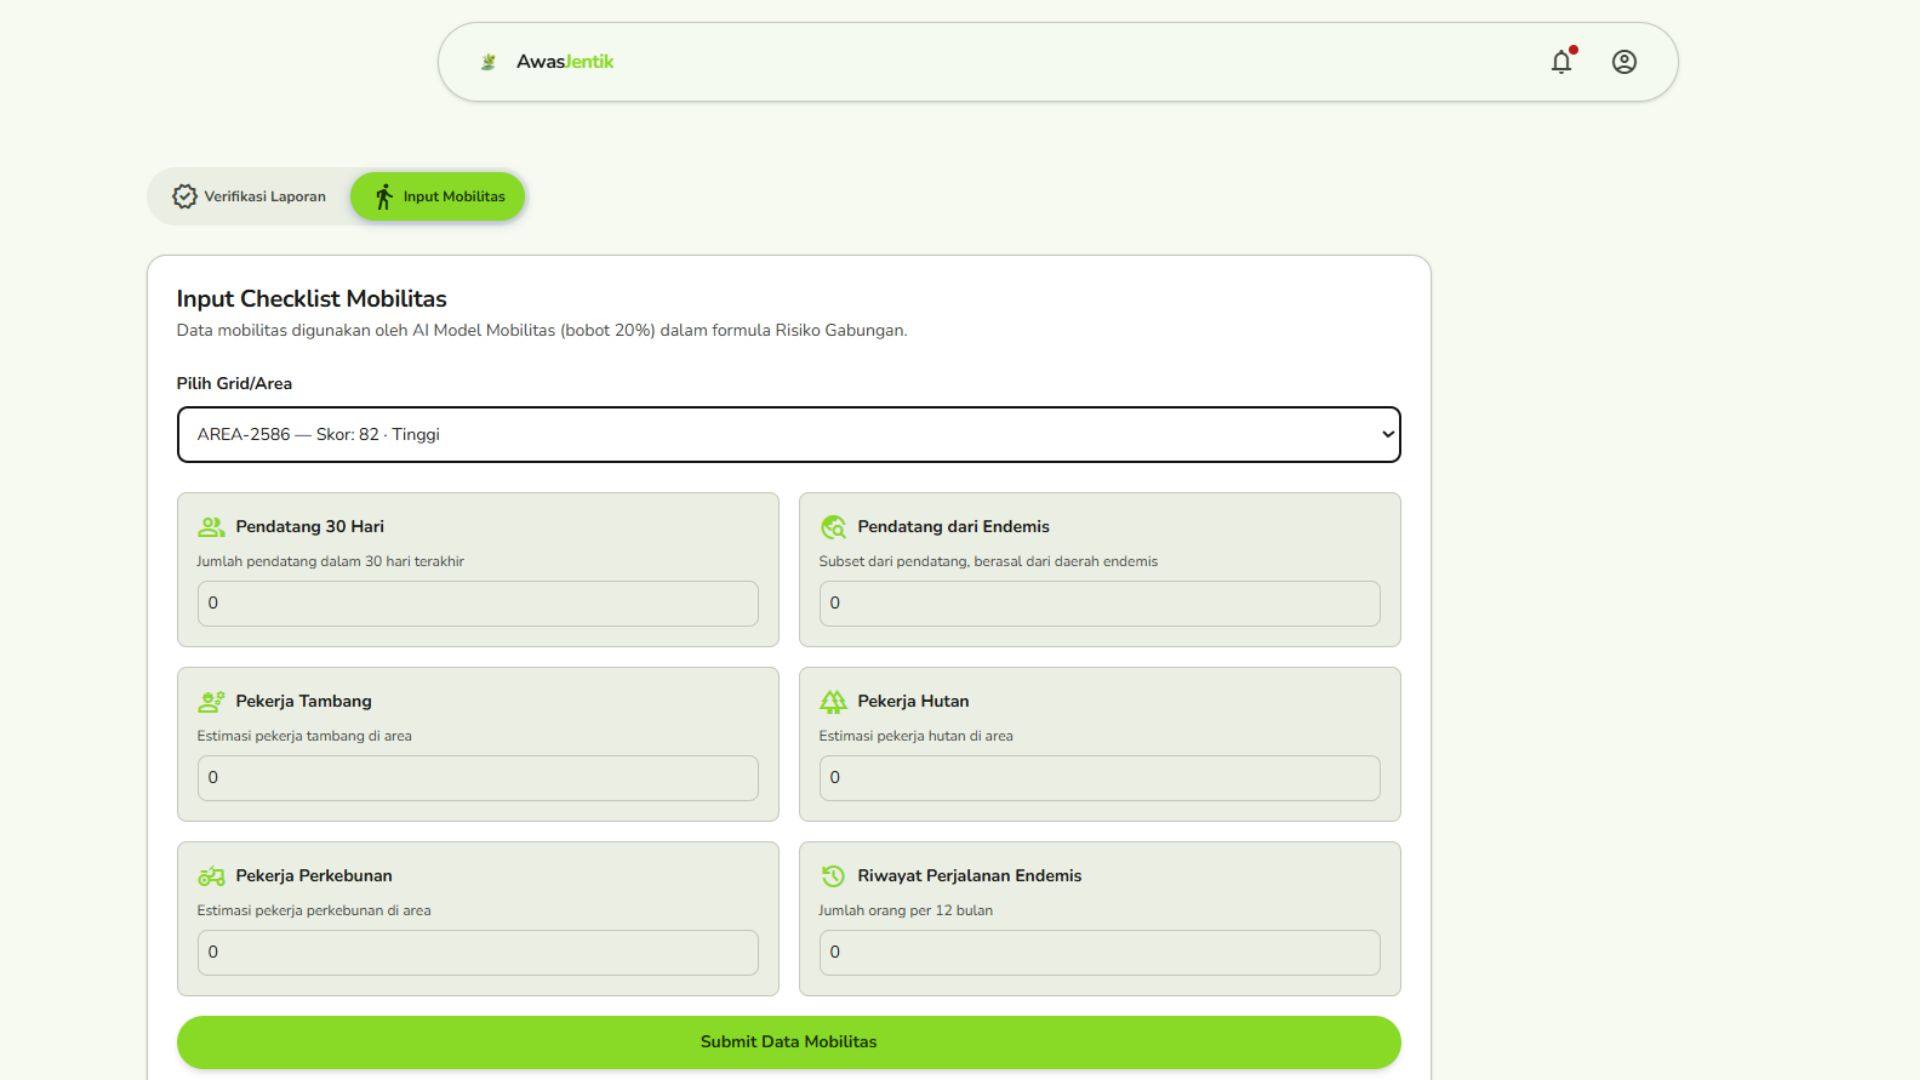
Input Mobilisasi Penduduk
-
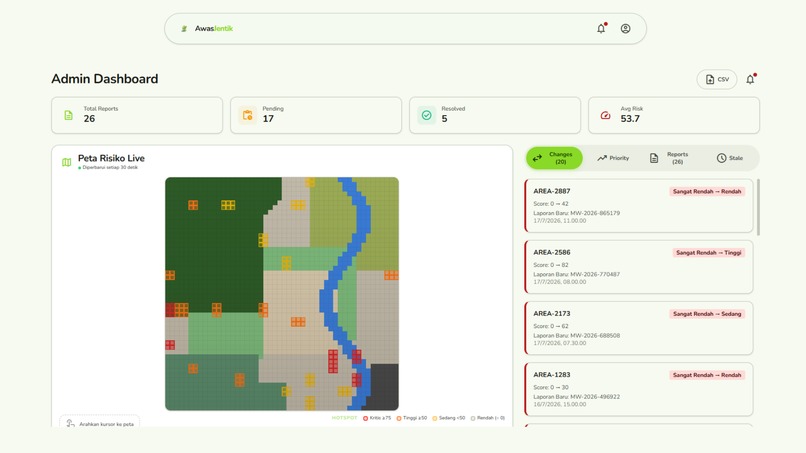
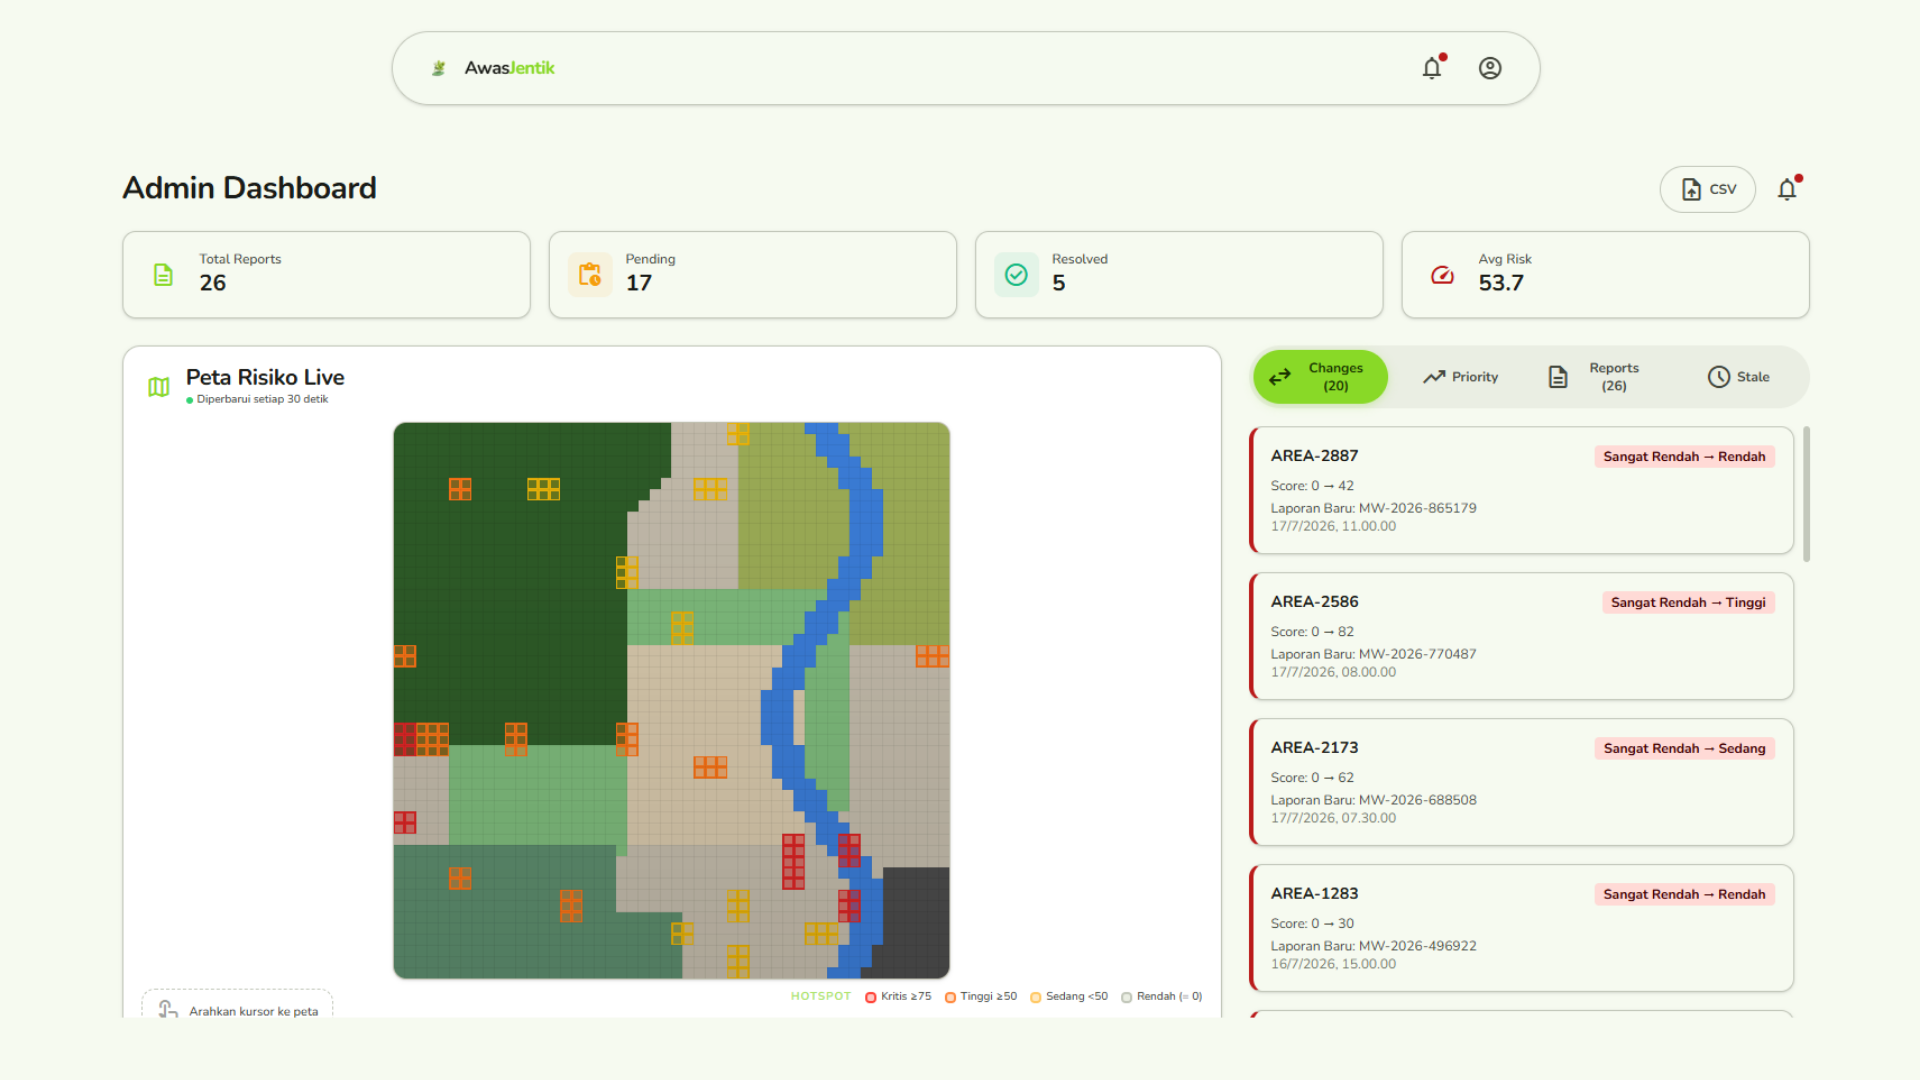
Admin Dashboard - Changes
-
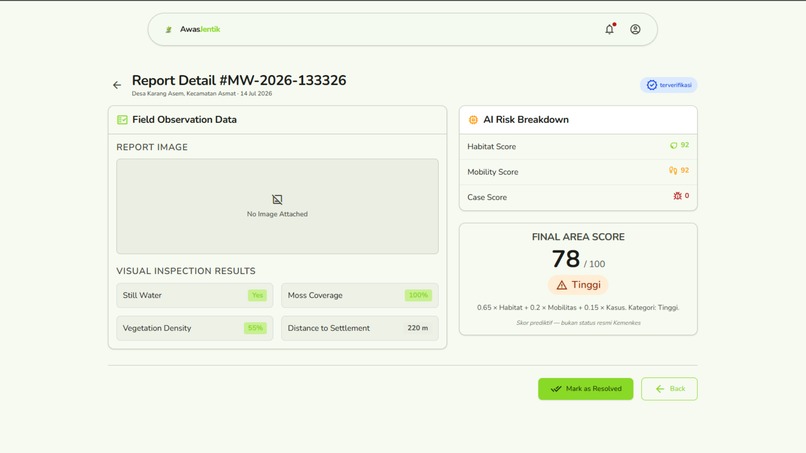
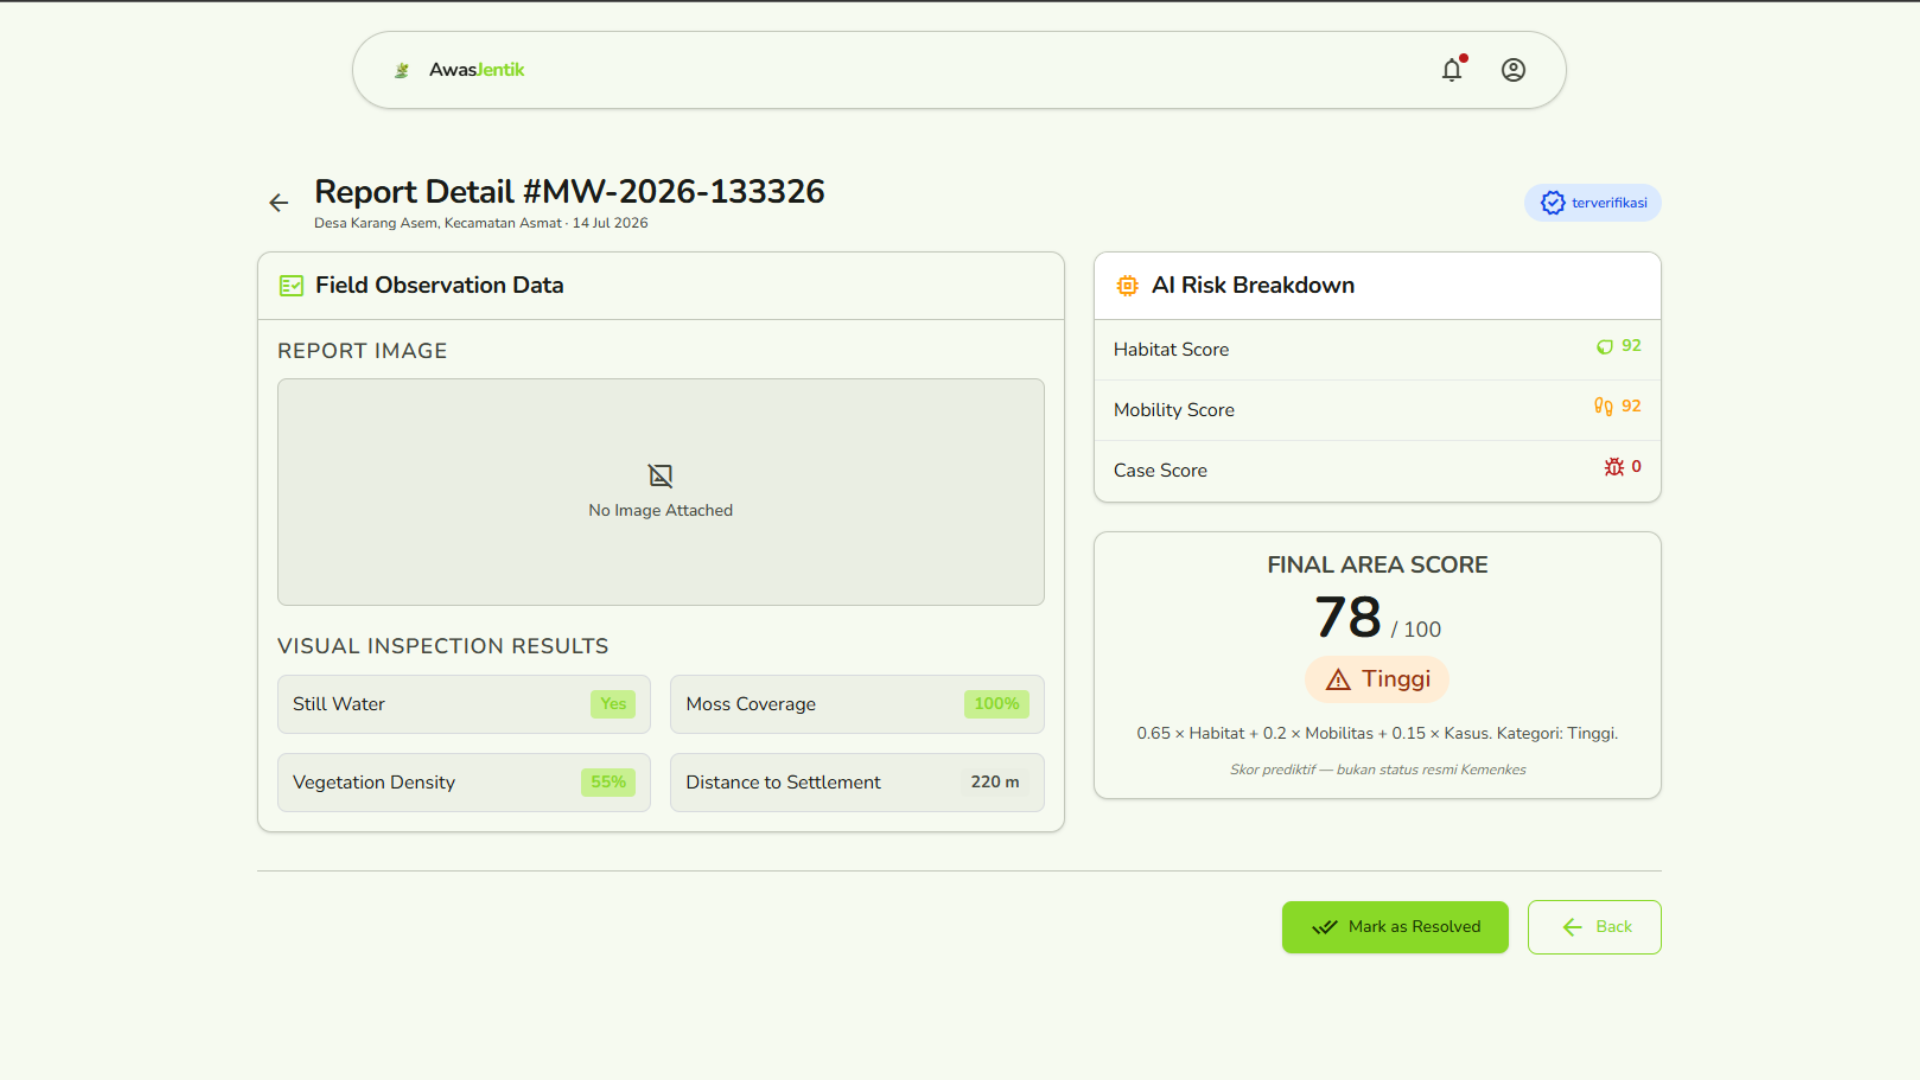
Report Detail
-
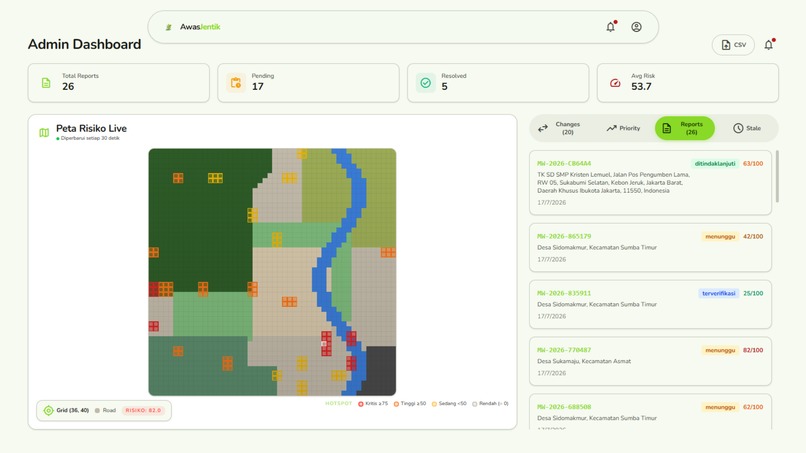
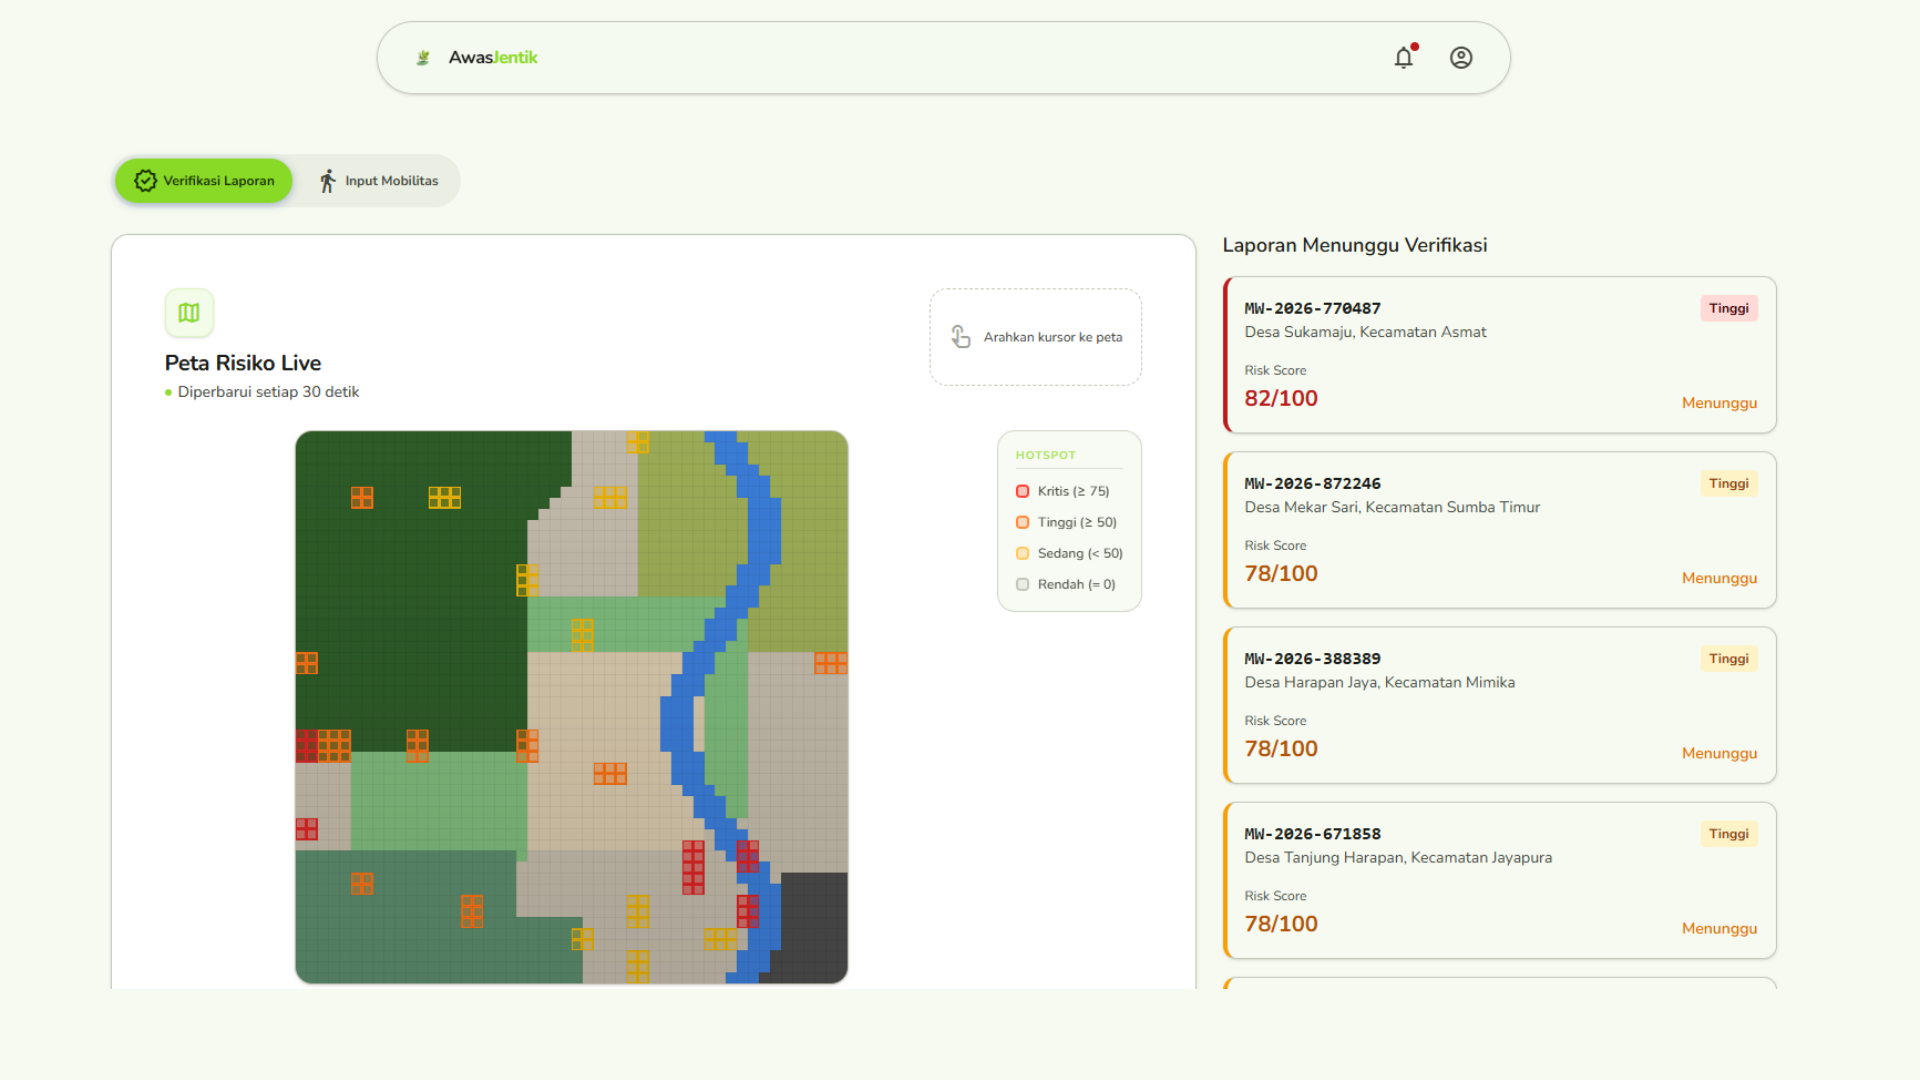
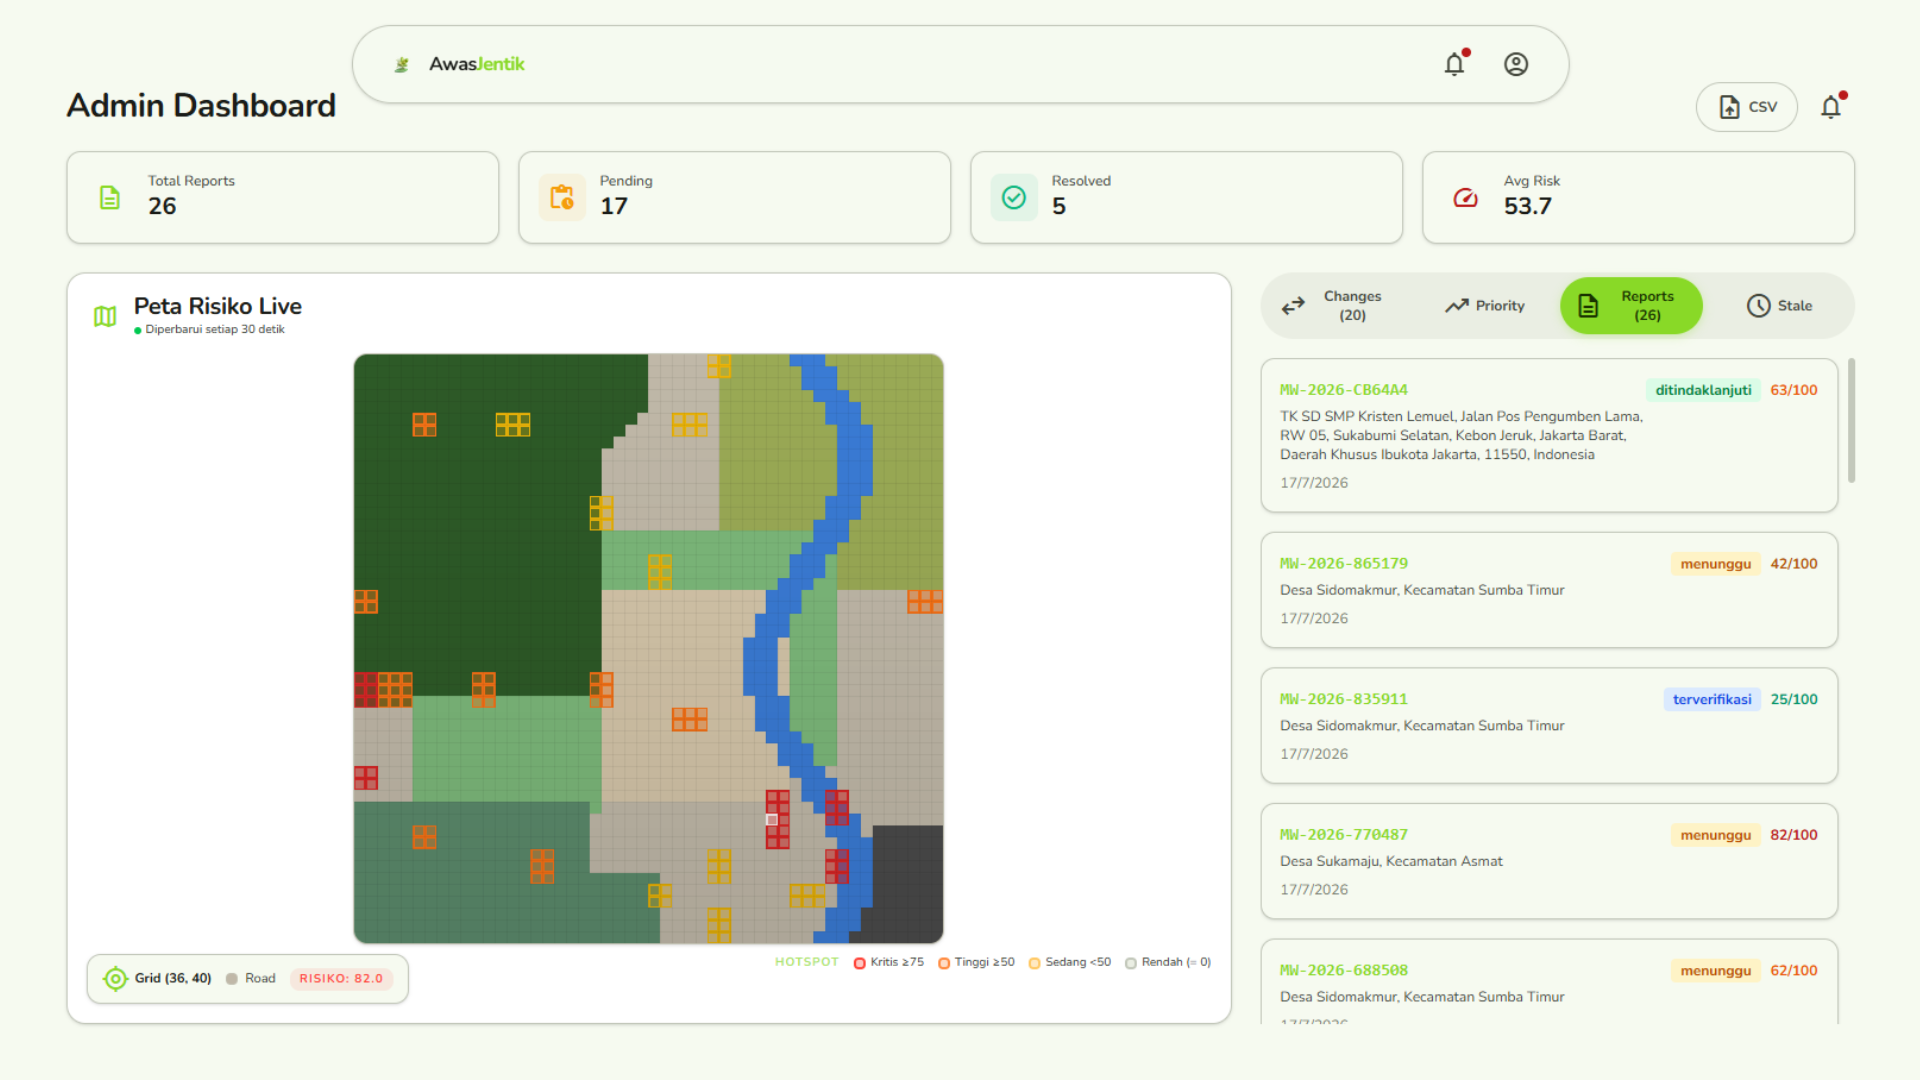
Admin Dashboard - Reports
-
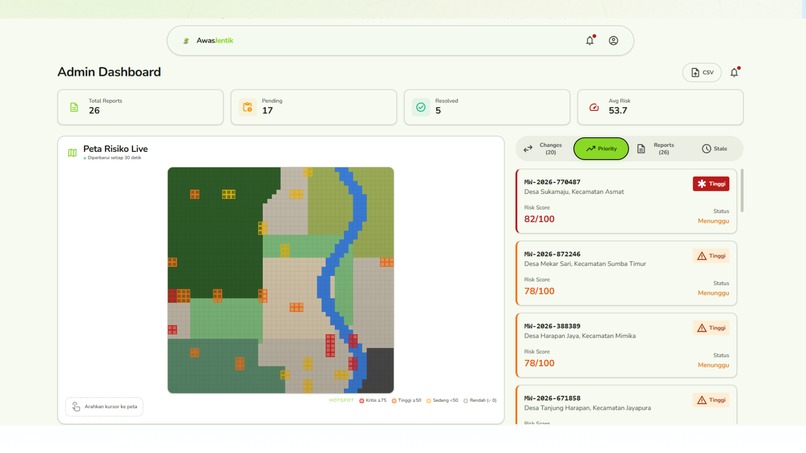
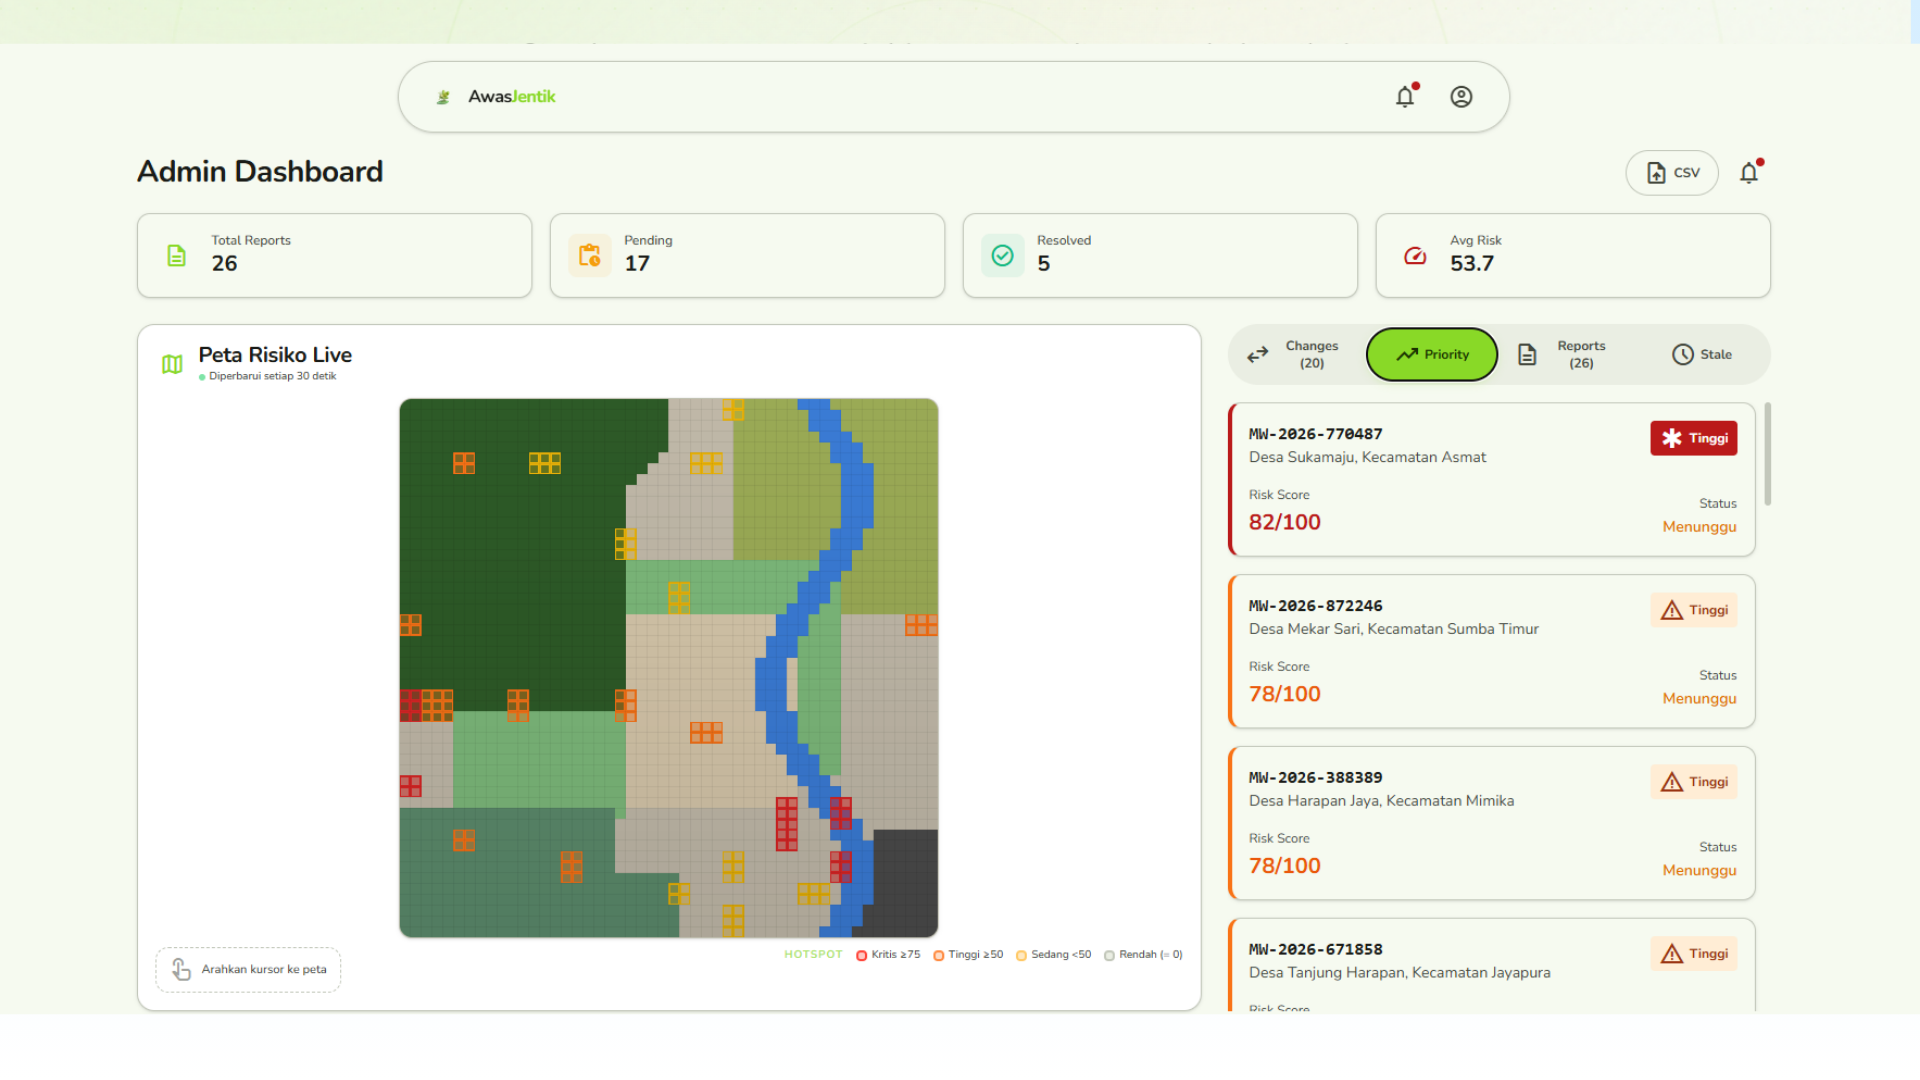
Admin Dashboard - Priority
-
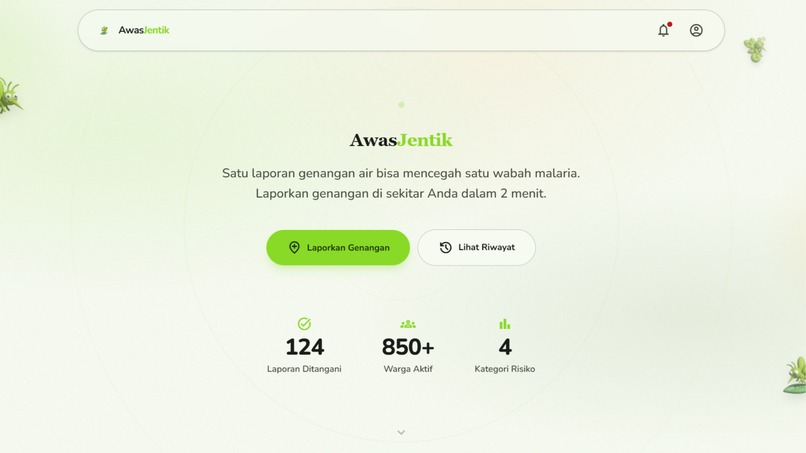
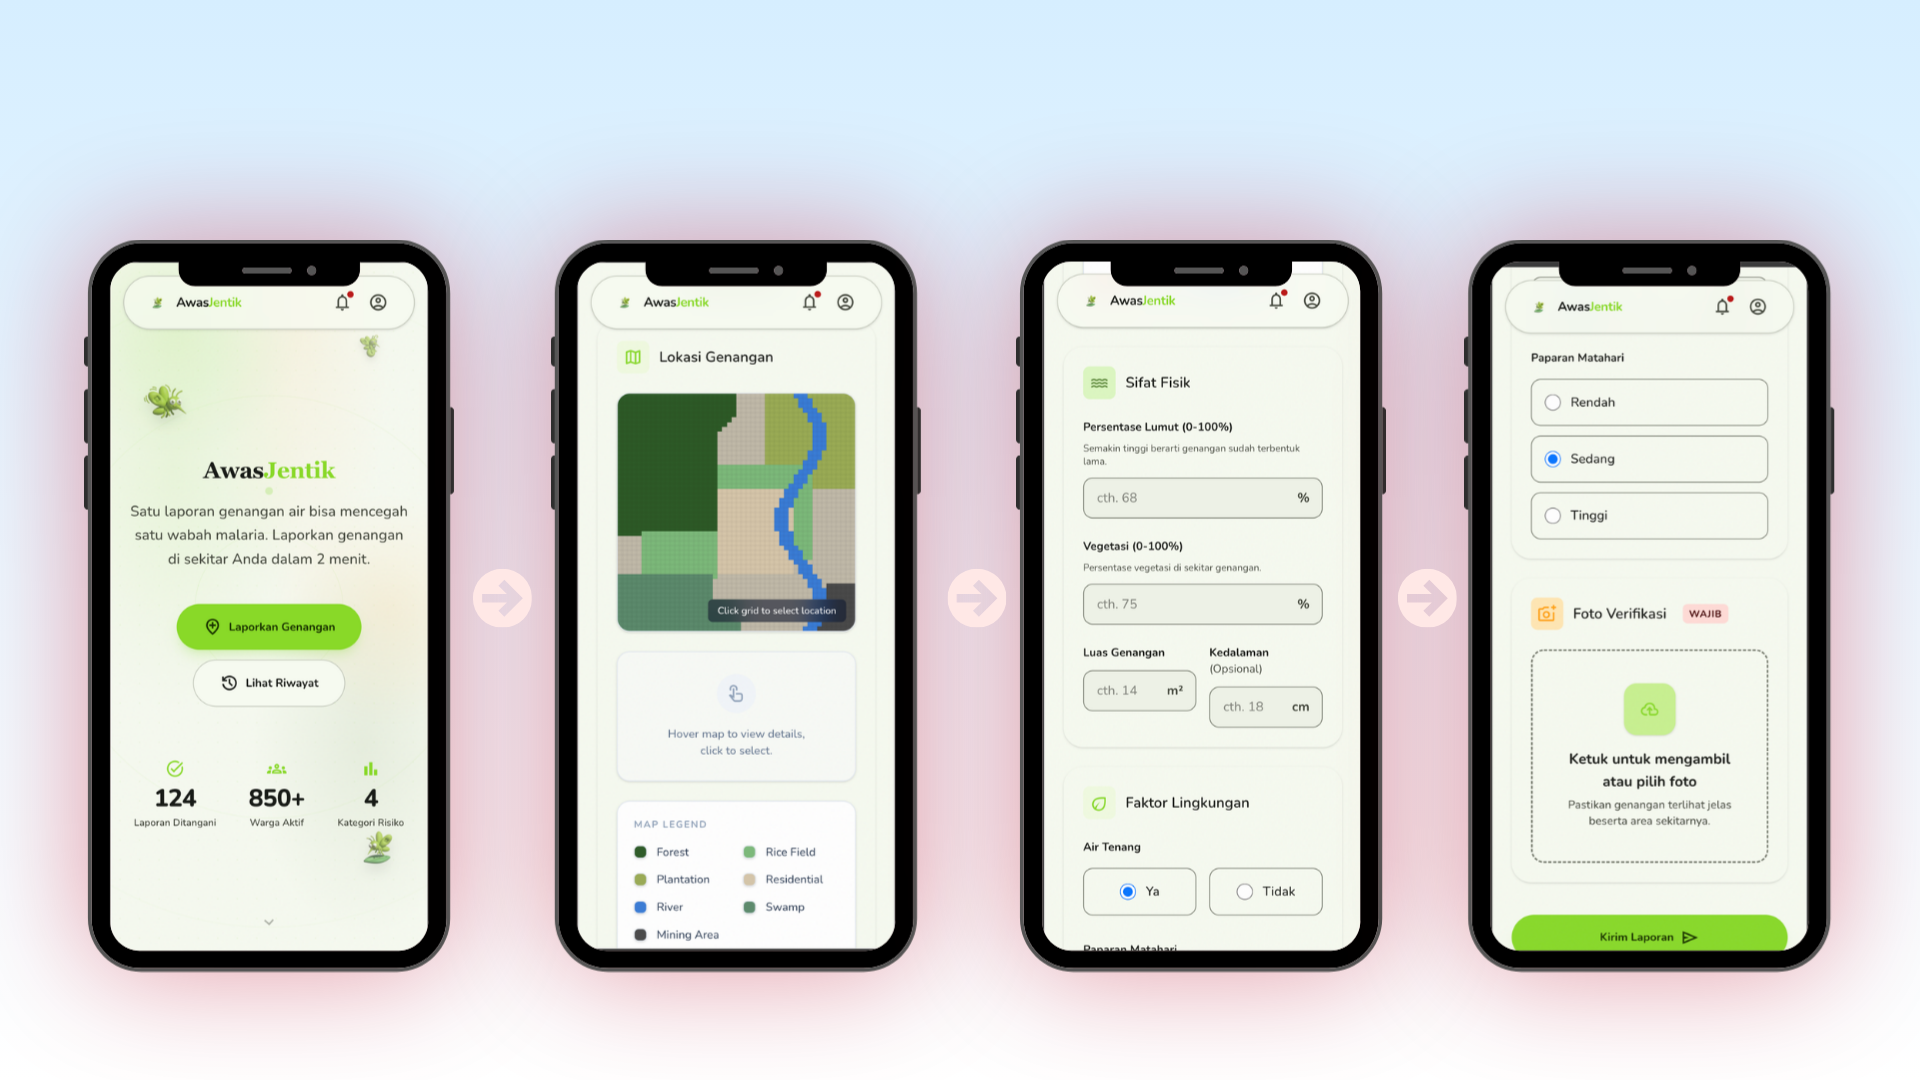
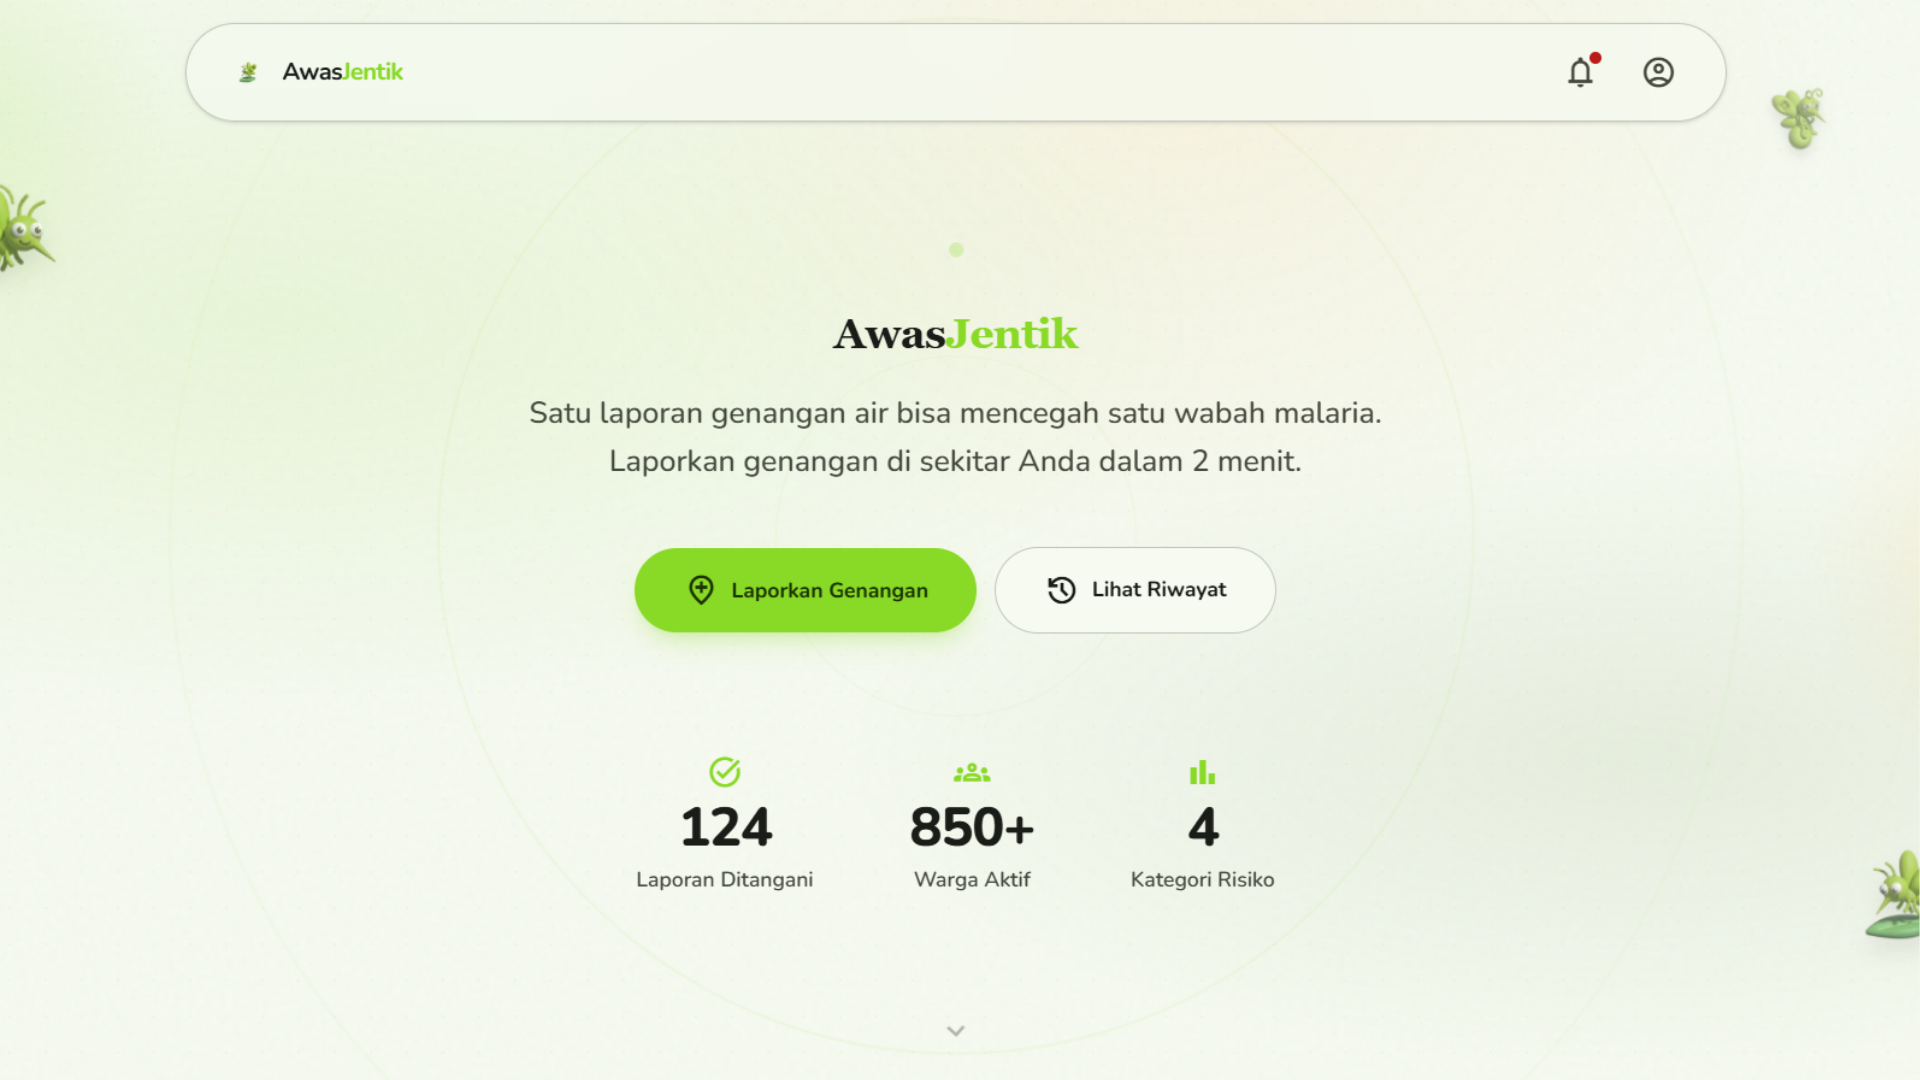
Landing Page
-
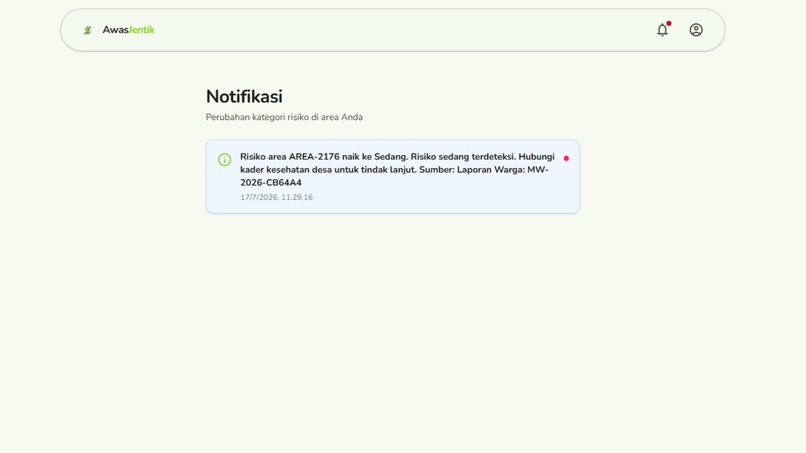
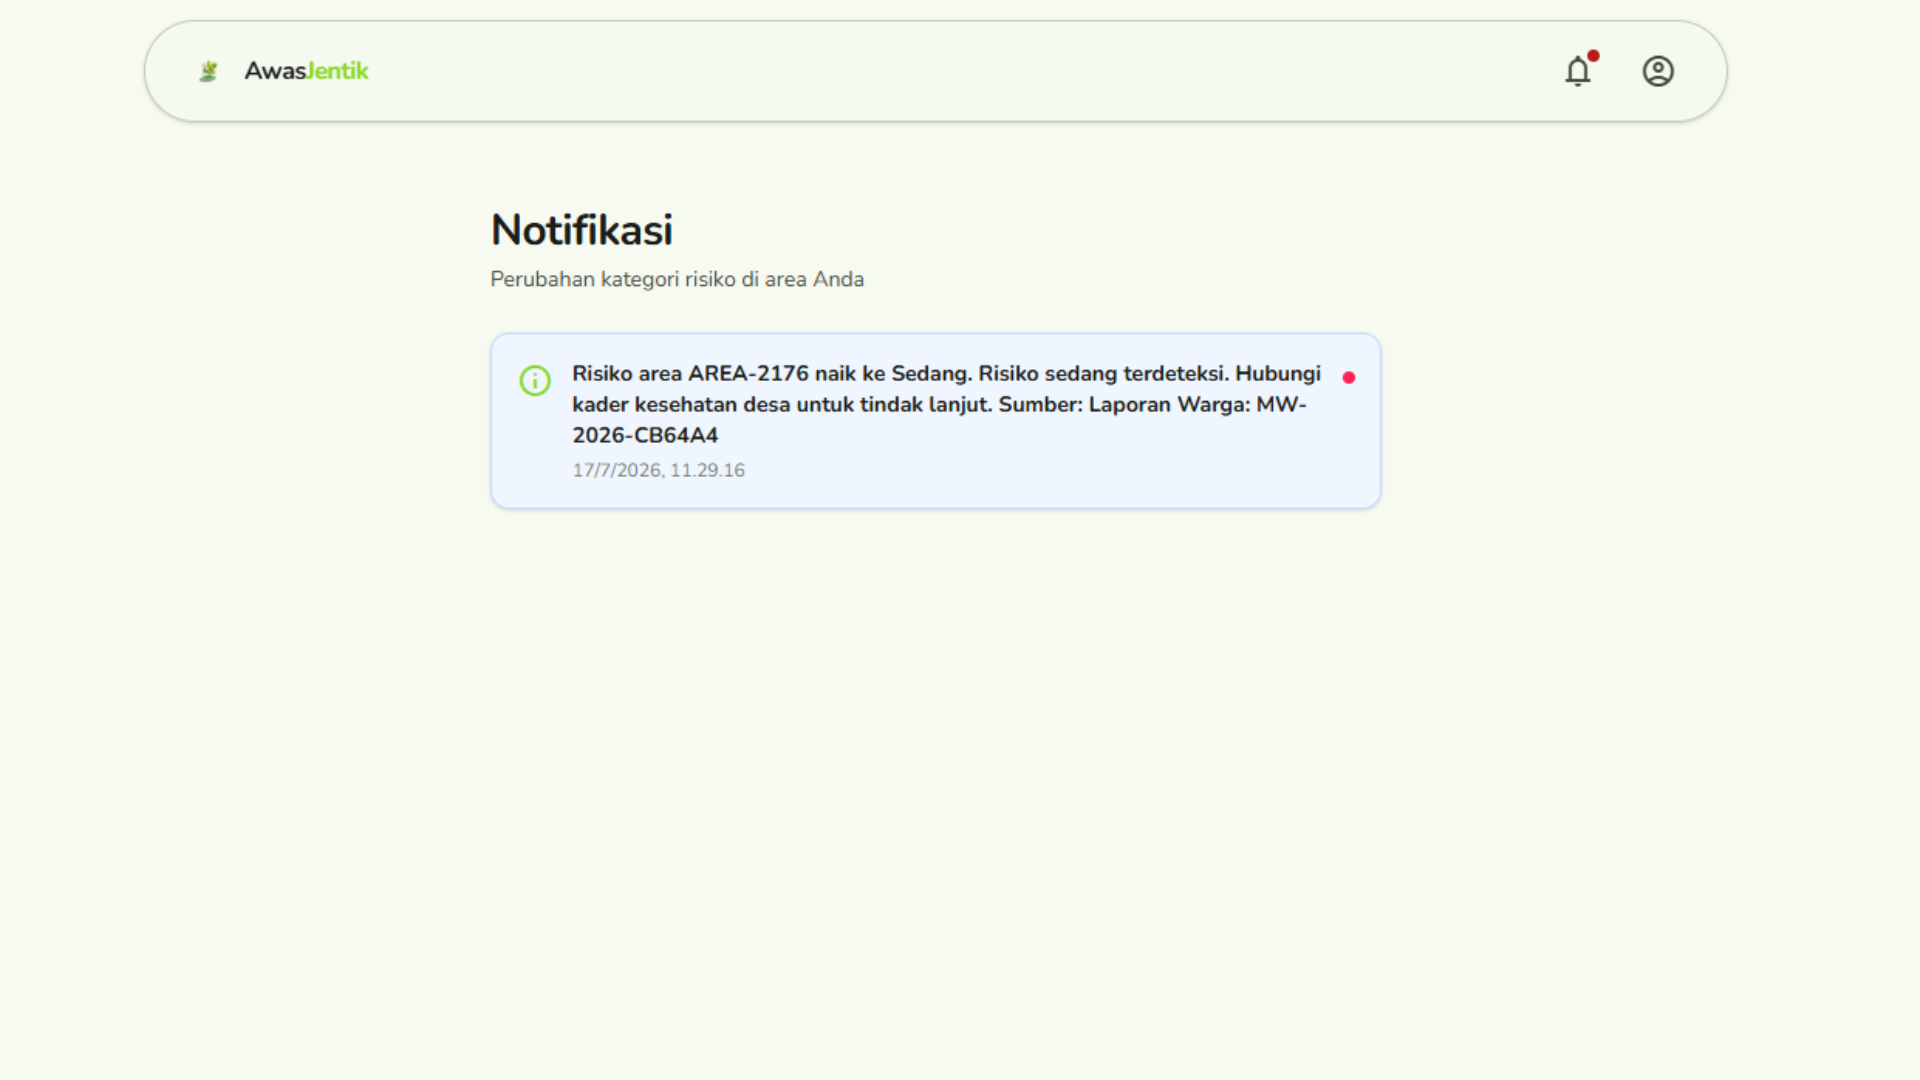
Notification
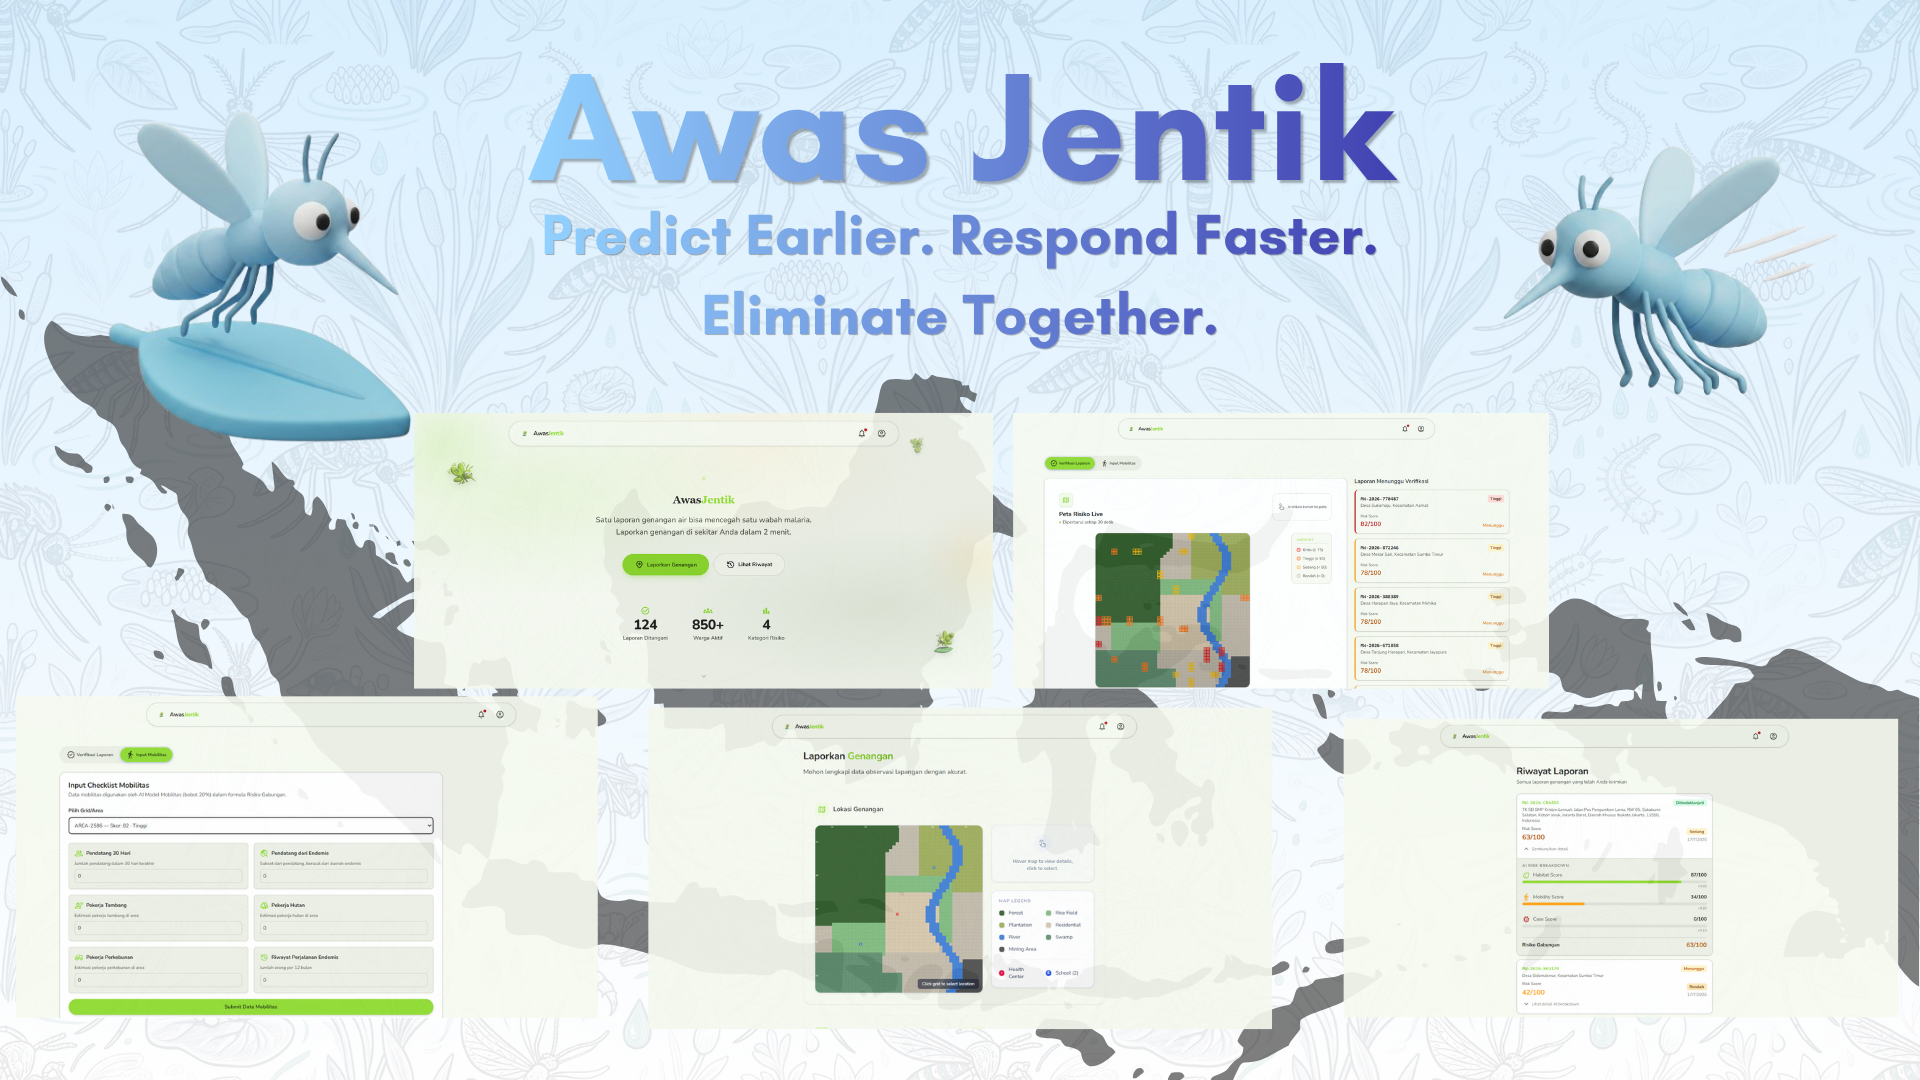
Awas-Jentik
Inspiration
706,297 malaria cases in Indonesia in 2025 — up 30% in a single year. 95% concentrated in Papua. And the part that kept us up at night: several areas already certified "malaria-free" are experiencing outbreaks again.
Indonesia's surveillance system, SISMAL, only activates after a patient is diagnosed. By then, the breeding site has been active for weeks. The transmission chain has already started.
We asked: what if we could detect the risk before the first case appears? The answer was Awas-Jentik.
What it does
Community members and health workers report field conditions in under two minutes — standing water, vegetation density, sunlight exposure — with GPS captured automatically. Two AI models score the report in parallel:
Combined Risk = 0.65 × Habitat Score + 0.20 × Mobility Score + 0.15 × Case History
Admins get a 2,500-grid risk heatmap, a live change-detection panel logging every category shift, and a staleness tracker flagging areas with no update in 60+ days — because silence doesn't mean safe.
How we built it
Two tracks ran in parallel. On the ML side: a structured dataset of 2,400 observations built from scratch, zero missing values, validated end-to-end at R² = 0.927. On the product side: use cases, role boundaries, and six PRD iterations — each closing specific gaps from the last.
Stack: Next.js 16 + TypeScript (frontend), FastAPI + Python 3.12 (backend), PostgreSQL + Supabase Auth, scikit-learn for inference, deployed on Vercel and Railway.
Challenges we ran into
Hardest technical decision: Combining Habitat and Mobility into one model hurt performance — the correlation between them is only 0.006. Separating them improved end-to-end R² from ~0.85 to 0.927.
Hardest design decision: We simplified from three roles (citizen, kader, admin) to two (user, admin). A community health worker and a citizen have more in common than we assumed — merging them made auth cleaner and role boundaries clearer.
Hardest constraint: 30 hours. The Immunity Gap Score is designed but partially implemented. CV is deliberately deferred to Phase 2. Known gaps, not forgotten features.
Accomplishments that we're proud of
Every claim in this submission is backed by a number. Habitat model: R² = 0.924, MAE = 3.72. Mobility model: R² = 0.639, MAE = 10.98. Combined pipeline: R² = 0.927, MAE = 2.86. Category match: 84.8% (5-class habitat), 88.8% (4-class heatmap).
The formula weights — 0.65/0.20/0.15 — are fixed and documented, not black-boxed. We skipped CV not because we couldn't build it, but because community larva detection sensitivity is only ~12.6%. Building on that signal would mean building on noise.
What we learned
The hardest part of a surveillance system isn't detecting things — it's knowing when not to act.
EMA smoothing (α = max(0.1, 1/(N+1))) means a single anomalous report doesn't flip an area's category. Habitat alone doesn't cause an outbreak — it needs a non-immune person entering it. That's why the two-model architecture exists. Not as a technical flourish, but as an epidemiological necessity.
Simplicity compounds. Every feature we cut made the rest of the system clearer.
What's next for Awas-Jentik
Phase 2 (1–3 months): App usage generates real training data. Models retrained on field observations. Lightweight CV explored for water body detection — not species classification.
Phase 3 (6+ months): Full Immunity Gap Score with BPS migration matrices. Mobility data becomes a time series. Integration with puskesmas notification systems.
The core loop — report → score → smooth → detect → notify — is complete. What's next is making it real.
Built With
- docker
- fastapi
- next.js
- numpy
- pandas
- postgresql
- python
- react
- scikit-learn
- supabase
- tailwind-css
- typescript
- vercel


Log in or sign up for Devpost to join the conversation.