-
Schedule Visualization By Vehicle Type
Inspiration
We were interested in tackling one of the many various challenges that were offered at the hackathon, and the SAP competition provided an optimization and visualization problem that was enticing enough for us to try.
What it does
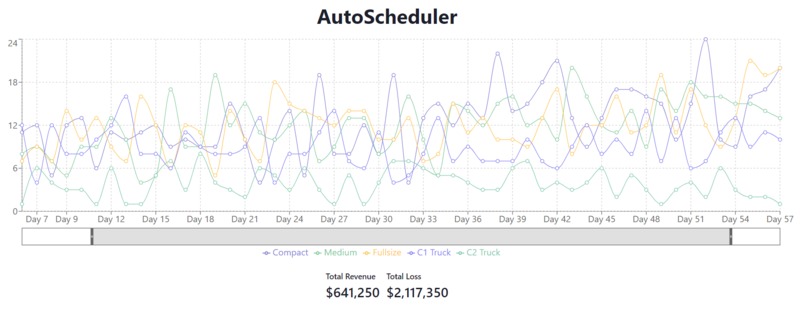
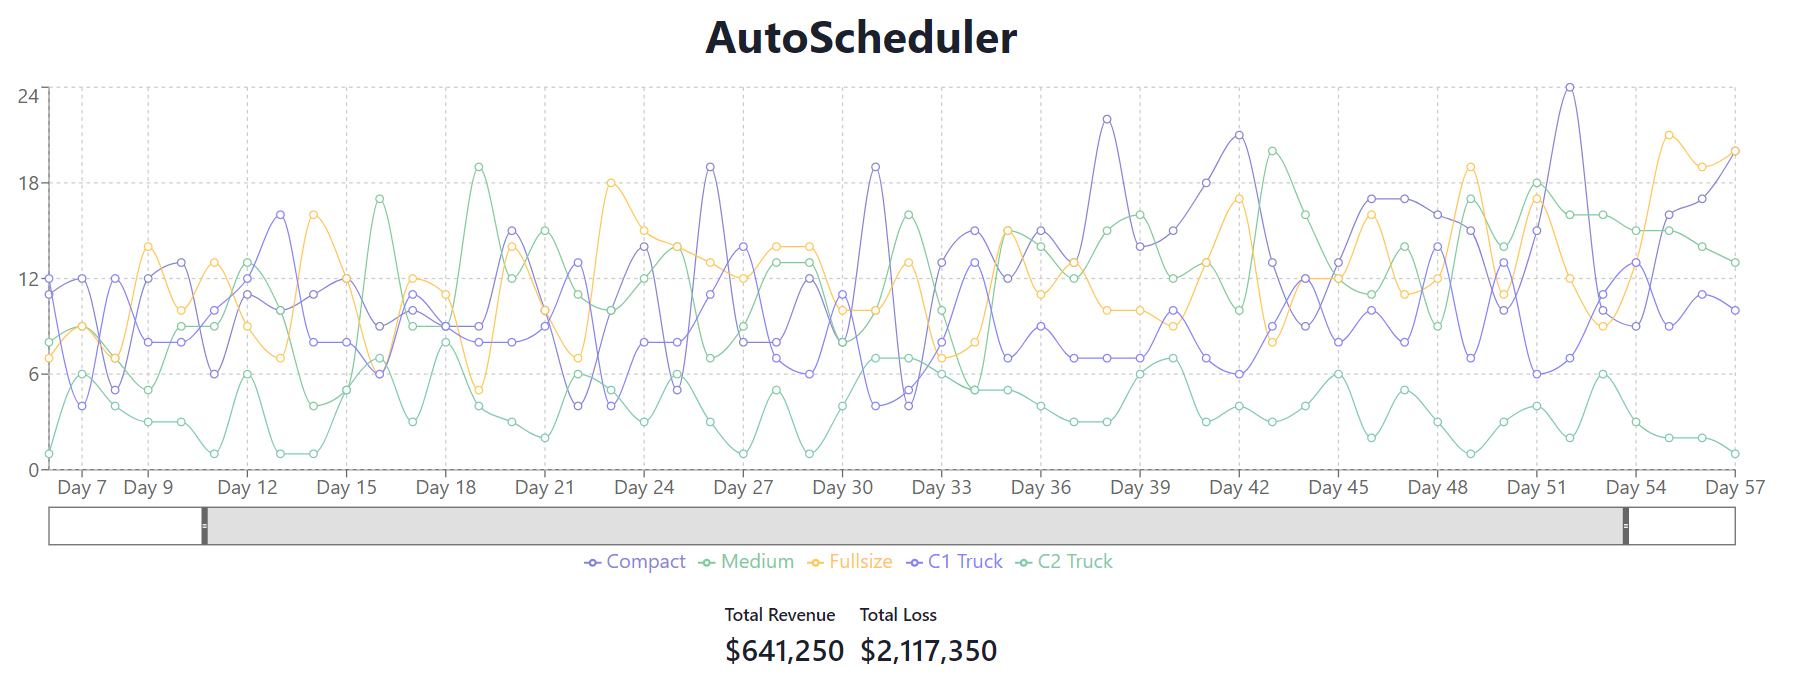
The AutoScheduler app takes in a .csv file of schedules and vehicle types and appropriately schedules the various appointments to emphasize fairness, revenue, and to allow for the user to see a visual interpretation of the end result for any specific day, for any specific interest (types of vehicle accepted/rejected for a given day, revenue/lost opportunity for money on that day... etc)
How we built it
We used Python, React.js, Flask and Nginx and we split the task into 4, with two people working on the front end and two on the back end. We eventually shifted our focus and had 3 people focus on the front end after the overall conception of the backend was formed.
Challenges we ran into
The conception of the data structure and overall back end was the hardest for the first half of the project as we attempted to make the algorithm fast. Later, the visualization part was difficult as we wanted to have the best chart/graph for this given task. Then, integrating our processed data with the graph and combining it all together was yet another challenge.
Accomplishments that we're proud of
We're proud that the algorithm is relatively fast with the careful choice of the overall data structure and with what we chose to visualize the data.
What we learned
We learned about data processing with python, and using Flask for the first time. Furthermore, most of the team was not familiar with nginx.
What's next for AutoScheduler
If we had the time, we would have wanted to add a database and to allow the user to create an account to add orders (and an admin to remove orders).

Log in or sign up for Devpost to join the conversation.