Inspiration
Modern observability platforms such as Splunk are incredibly powerful, but getting value from them often requires significant setup and expertise. Engineers must manually configure telemetry pipelines, instrumentation, dashboards, alerts, searches, and incident workflows before they can effectively monitor their systems.
We wondered: what if observability could configure itself?
Instead of building another AI chatbot for logs, we wanted to create an autonomous observability engineer—one that could understand an application, set up monitoring automatically, and investigate incidents when things go wrong.
That idea became AutoOps AI.
What it does
AutoOps AI transforms any repository into a fully monitored and self-investigating system using Splunk and AI.
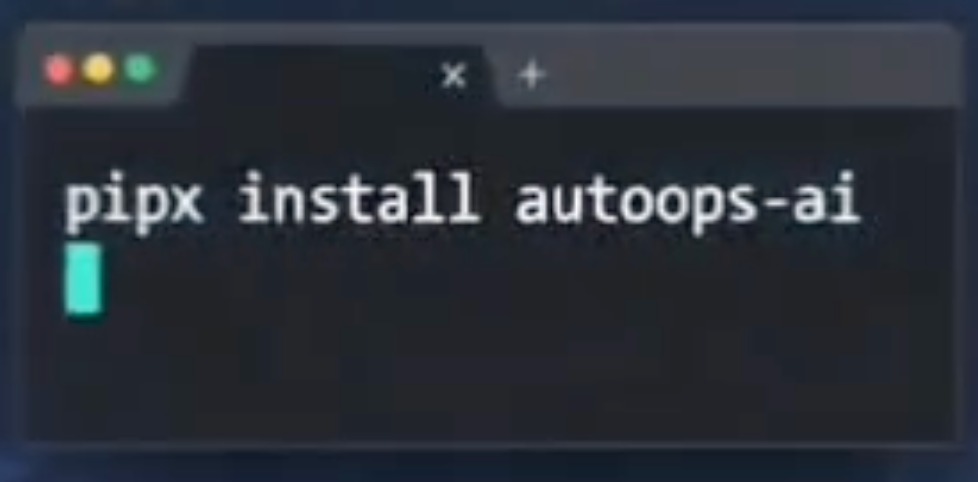
A developer installs AutoOps, connects their preferred AI provider, and points it at a repository.
AutoOps then automatically:
- Discovers application architecture
- Maps services, APIs, databases, and dependencies
- Generates observability instrumentation
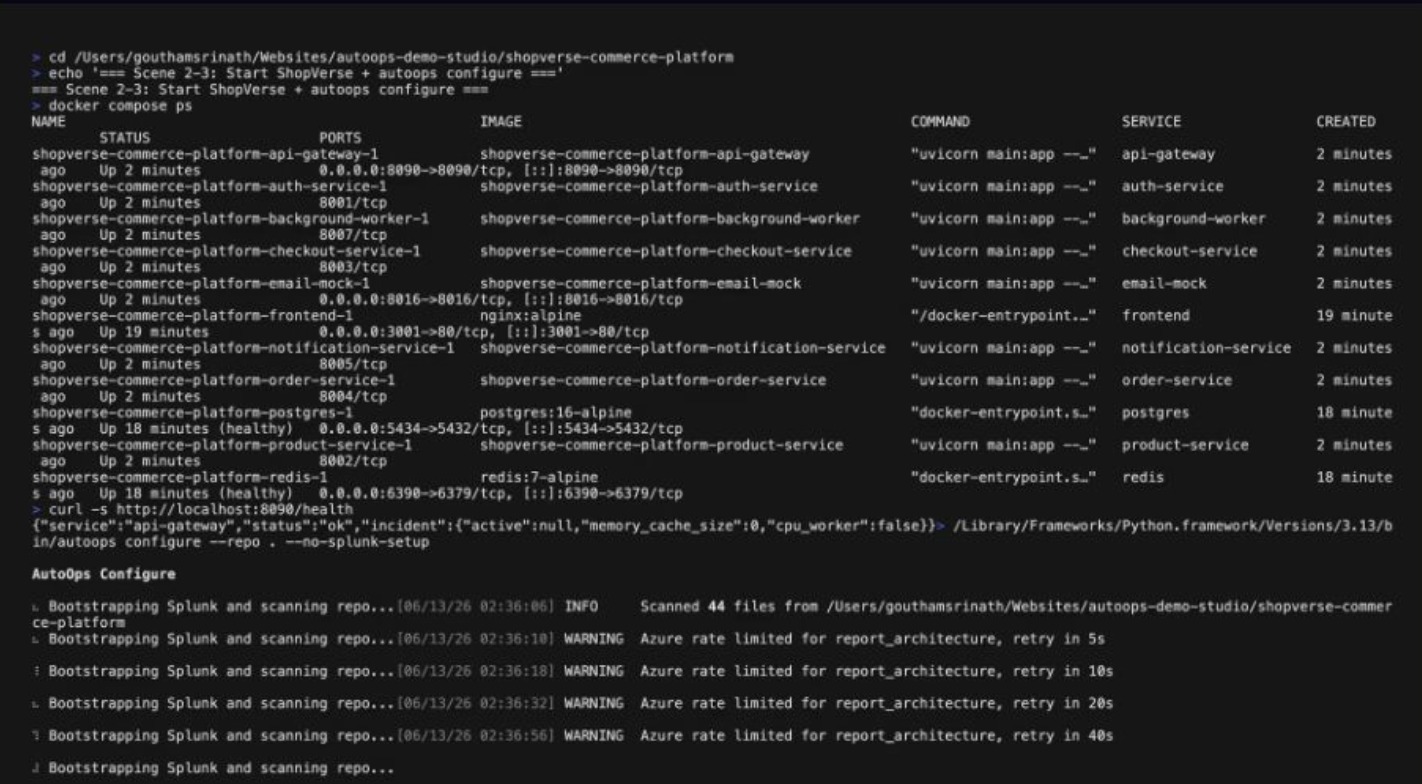
- Bootstraps Splunk and OpenTelemetry
- Creates dashboards, alerts, and saved searches
- Connects telemetry pipelines
- Monitors logs, metrics, and traces in real time
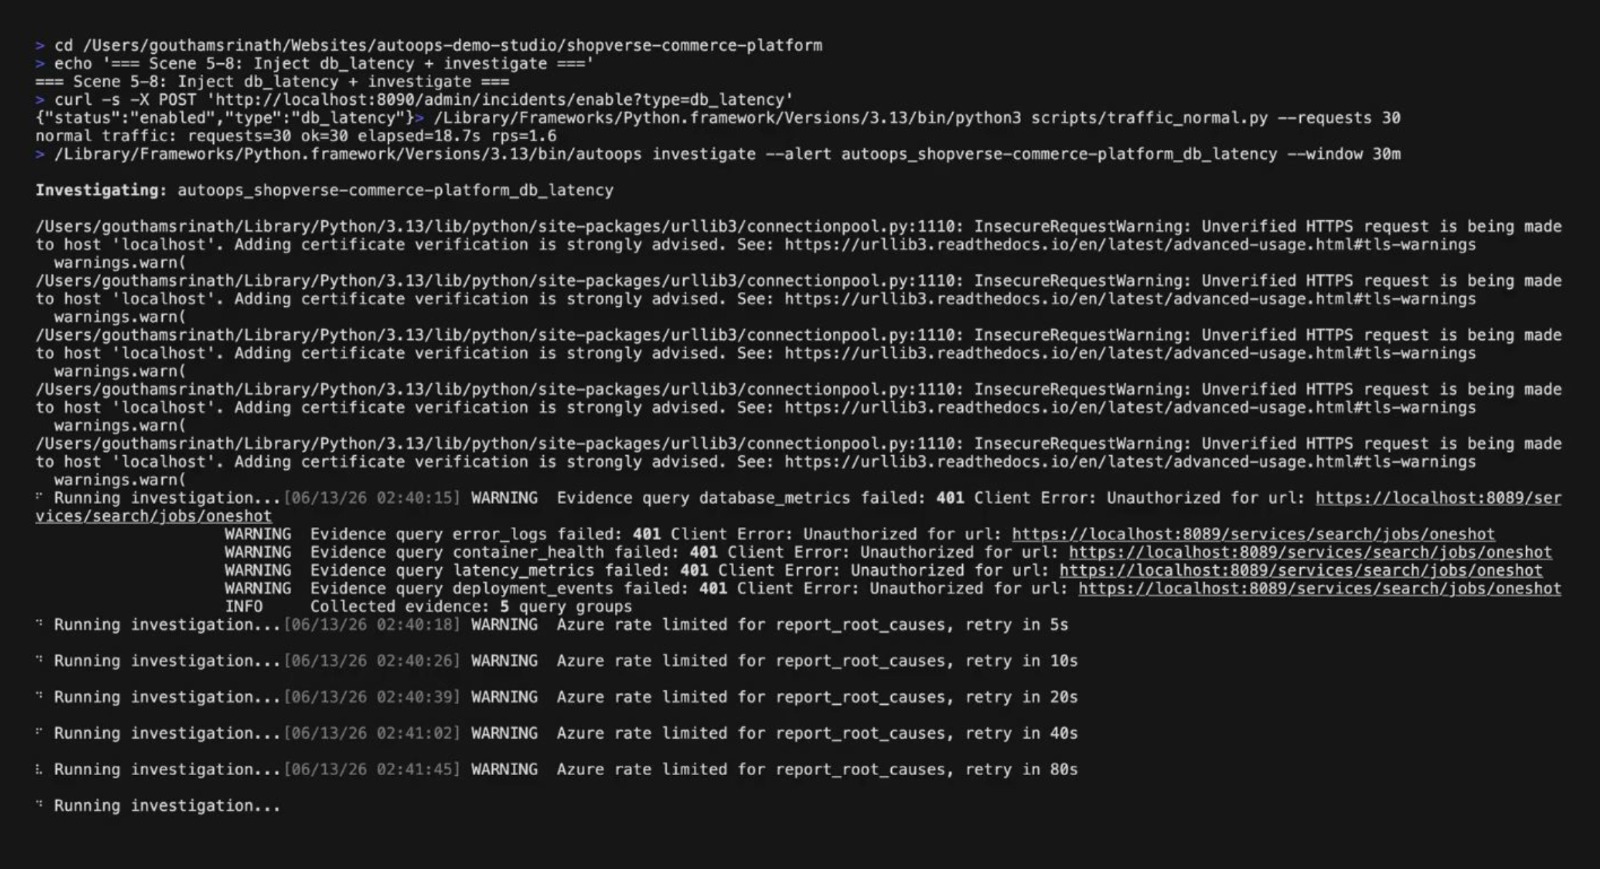
- Investigates incidents using AI
- Performs root cause analysis
- Generates remediation recommendations
When alerts fire, AutoOps collects evidence from Splunk, analyzes telemetry, identifies likely root causes, and produces actionable incident reports.
How we built it
AutoOps AI was built as a Python-based cross-platform CLI application designed to work on both macOS and Windows.
Key technologies include:
- Splunk Enterprise
- Splunk REST APIs
- Splunk MCP integration with REST fallback
- OpenTelemetry
- Docker
- FastAPI
- PostgreSQL
- Python
- Azure OpenAI and multi-provider LLM support
- Typer CLI
- Keyring for secure credential storage
The system is organized as a multi-agent architecture:
- Discovery Agent
- Scans repositories
- Understands architecture
- Identifies frameworks and dependencies
- Instrumentation Agent
- Generates observability instrumentation
- Configures tracing and logging
- Splunk Configuration Agent
- Creates dashboards
- Creates alerts
- Creates saved searches
- Evidence Agent
- Collects logs, metrics, and traces from Splunk
- RCA Agent
- Performs AI-powered root cause analysis
- Remediation Agent
- Generates recommendations and incident summaries
We also built automatic Docker bootstrapping, OpenTelemetry collector setup, provider management, telemetry validation, and a complete demonstration environment with injectable production incidents.
Challenges we ran into
One of the biggest challenges was reducing the complexity of observability setup into an experience that felt effortless.
We had to solve:
- Cross-platform support for macOS and Windows
- Automated Docker detection and startup
- Splunk container provisioning
- OpenTelemetry configuration generation
- Repository architecture discovery
- Reliable telemetry ingestion
- Multi-provider LLM support
- Structured AI workflows for incident investigation
- Secure credential management
Another major challenge was ensuring AutoOps could operate on arbitrary repositories rather than being hardcoded for a single demo application.
Making the system generalized, repeatable, and autonomous required significant orchestration across multiple services and tools.
Accomplishments that we're proud of
We are proud that AutoOps evolved beyond a hackathon prototype and became a usable developer tool.
Some highlights include:
- Published as an installable package
- Cross-platform support
- Automatic Splunk setup
- Automatic OpenTelemetry setup
- Architecture discovery
- Automated dashboard and alert generation
- AI-powered incident investigation
- Multi-provider AI support
- End-to-end autonomous observability workflow
Most importantly, we created a system that can take a repository and transform it into a monitored environment in minutes rather than hours.
What we learned
Building AutoOps taught us that observability is not just a monitoring problem—it is fundamentally an automation problem.
We learned how much engineering effort is spent on setup and configuration before teams can actually benefit from observability tools.
We also learned the importance of combining deterministic automation with AI reasoning. Traditional automation handles infrastructure and configuration reliably, while AI helps interpret signals, investigate incidents, and explain complex failures.
The combination of both proved far more powerful than either approach alone.
What's next for AutoOps AI
Our vision is to evolve AutoOps into a fully autonomous observability platform.
Future plans include:
- Support for additional languages and frameworks
- Kubernetes-native deployment
- Continuous architecture monitoring
- Automated remediation execution
- Security and compliance investigations
- Predictive incident detection
- Team collaboration workflows
- Splunk App packaging
- Enterprise deployment support
- Autonomous observability recommendations
Ultimately, we want AutoOps to become the first AI-powered observability engineer that continuously understands, monitors, investigates, and improves software systems with minimal human intervention.
Built With
- amazon-bedrock
- anthropic-claude
- azure-openai
- docker
- fastapi
- github.
- openai
- openrouter
- opentelemetry
- postgresql
- pydantic
- pypi
- python
- redis
- splunk-enterprise
- splunk-mcp
- splunk-rest-api
- sqlalchemy
- typer

Log in or sign up for Devpost to join the conversation.