-
-
5
-
1
-
6
-
2
-
4
-
3
Repo: https://github.com/bennibyx/financial-analyst-agent-final | Live demo: https://financial-analyst-app.onrender.com | Video: https://youtu.be/Bqvt2k3dy4c
What it does
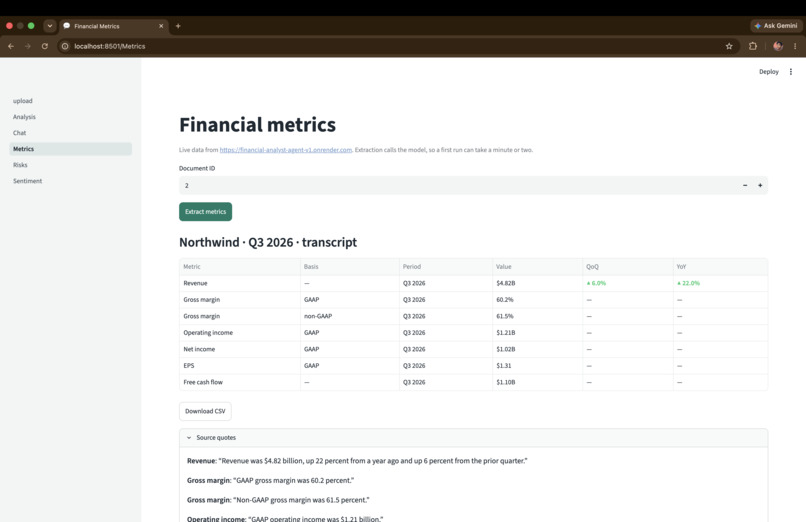
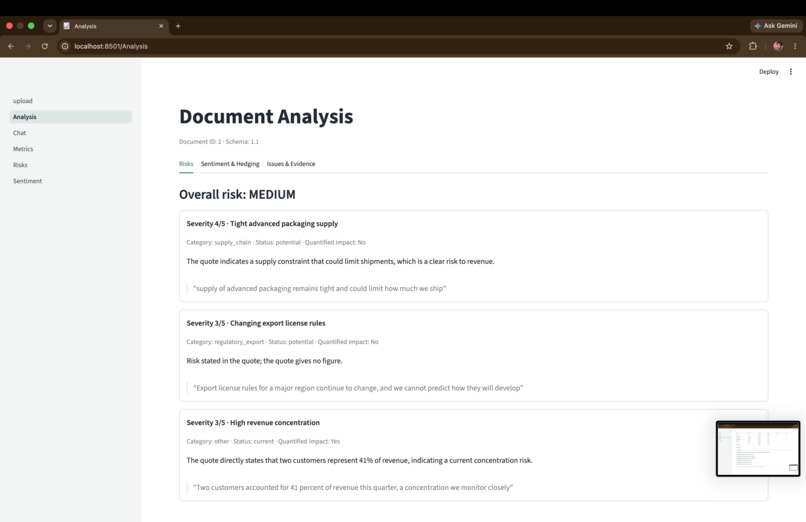
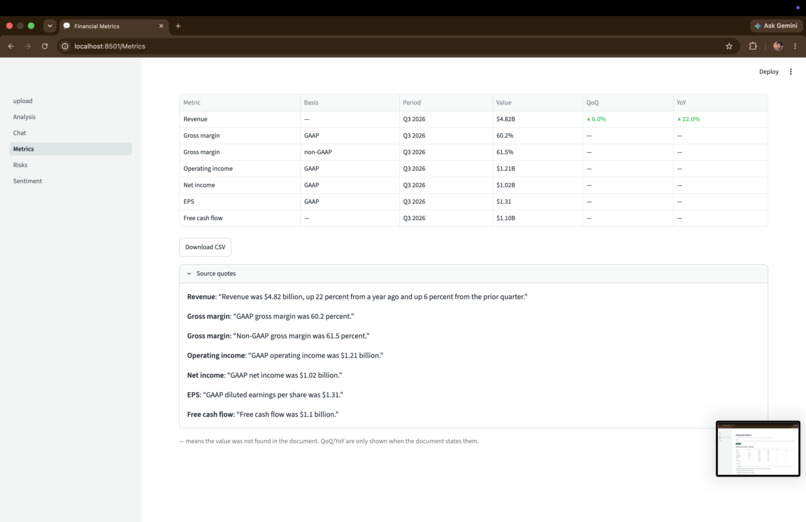
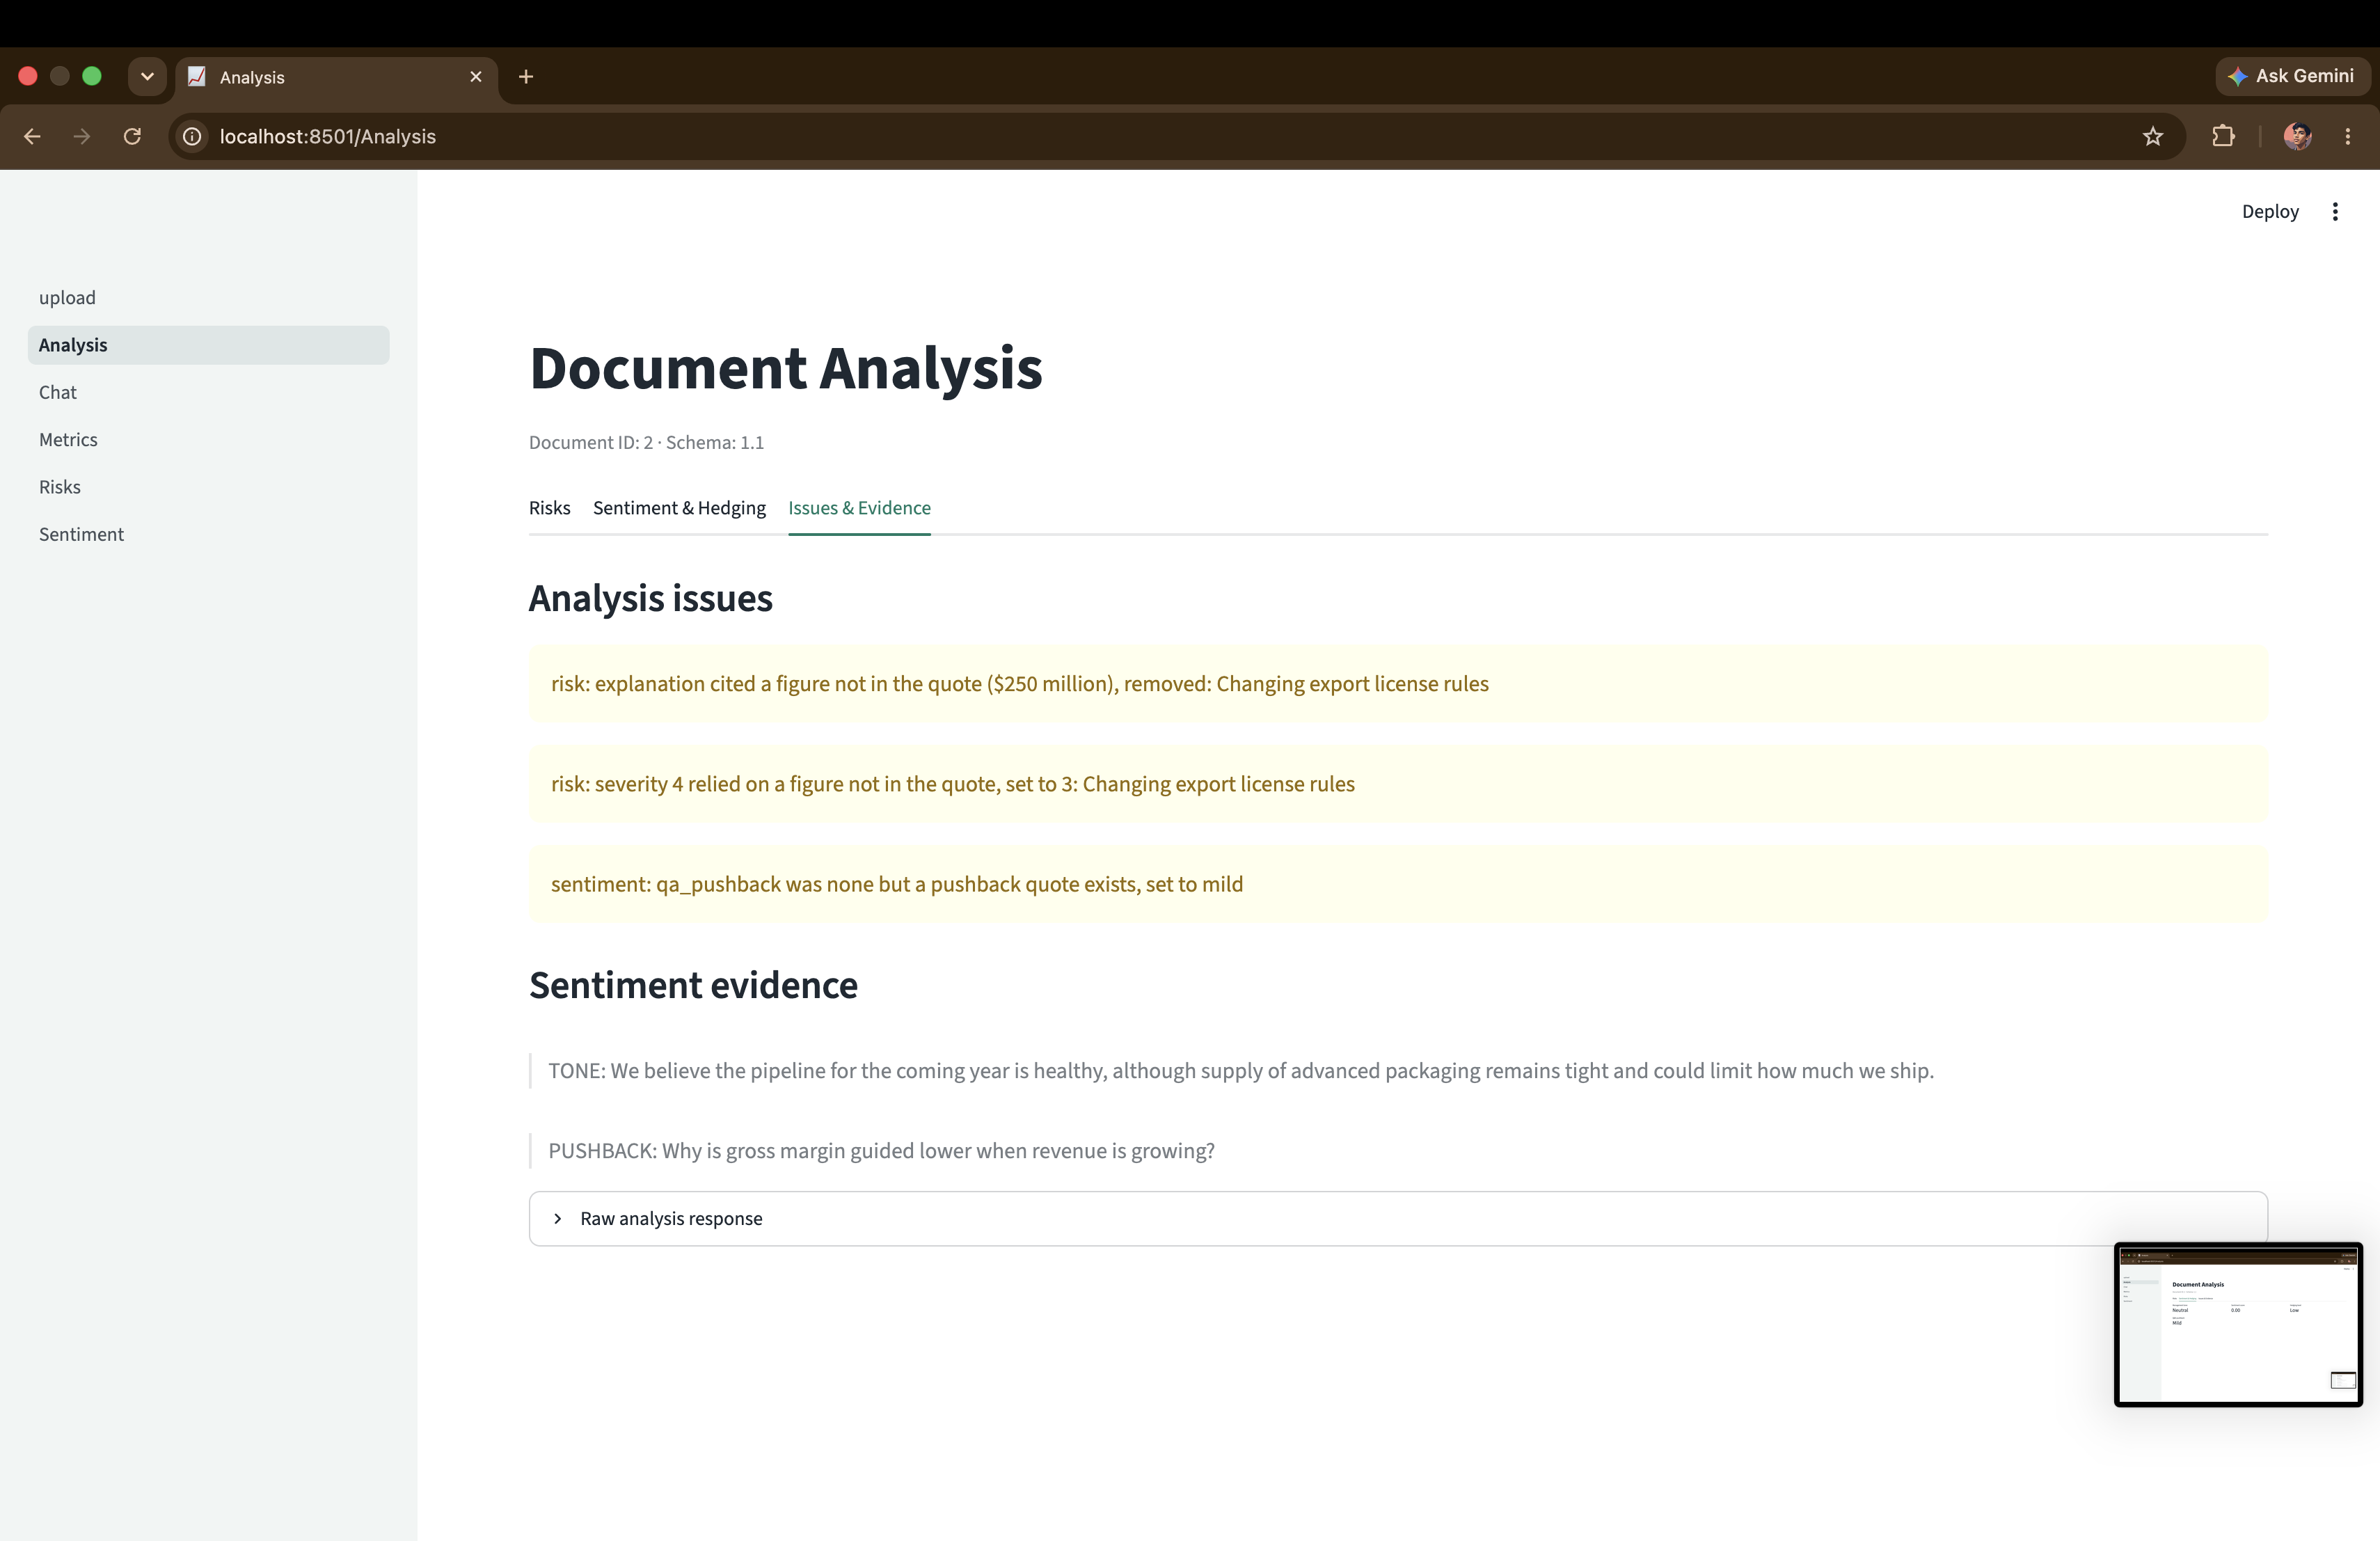
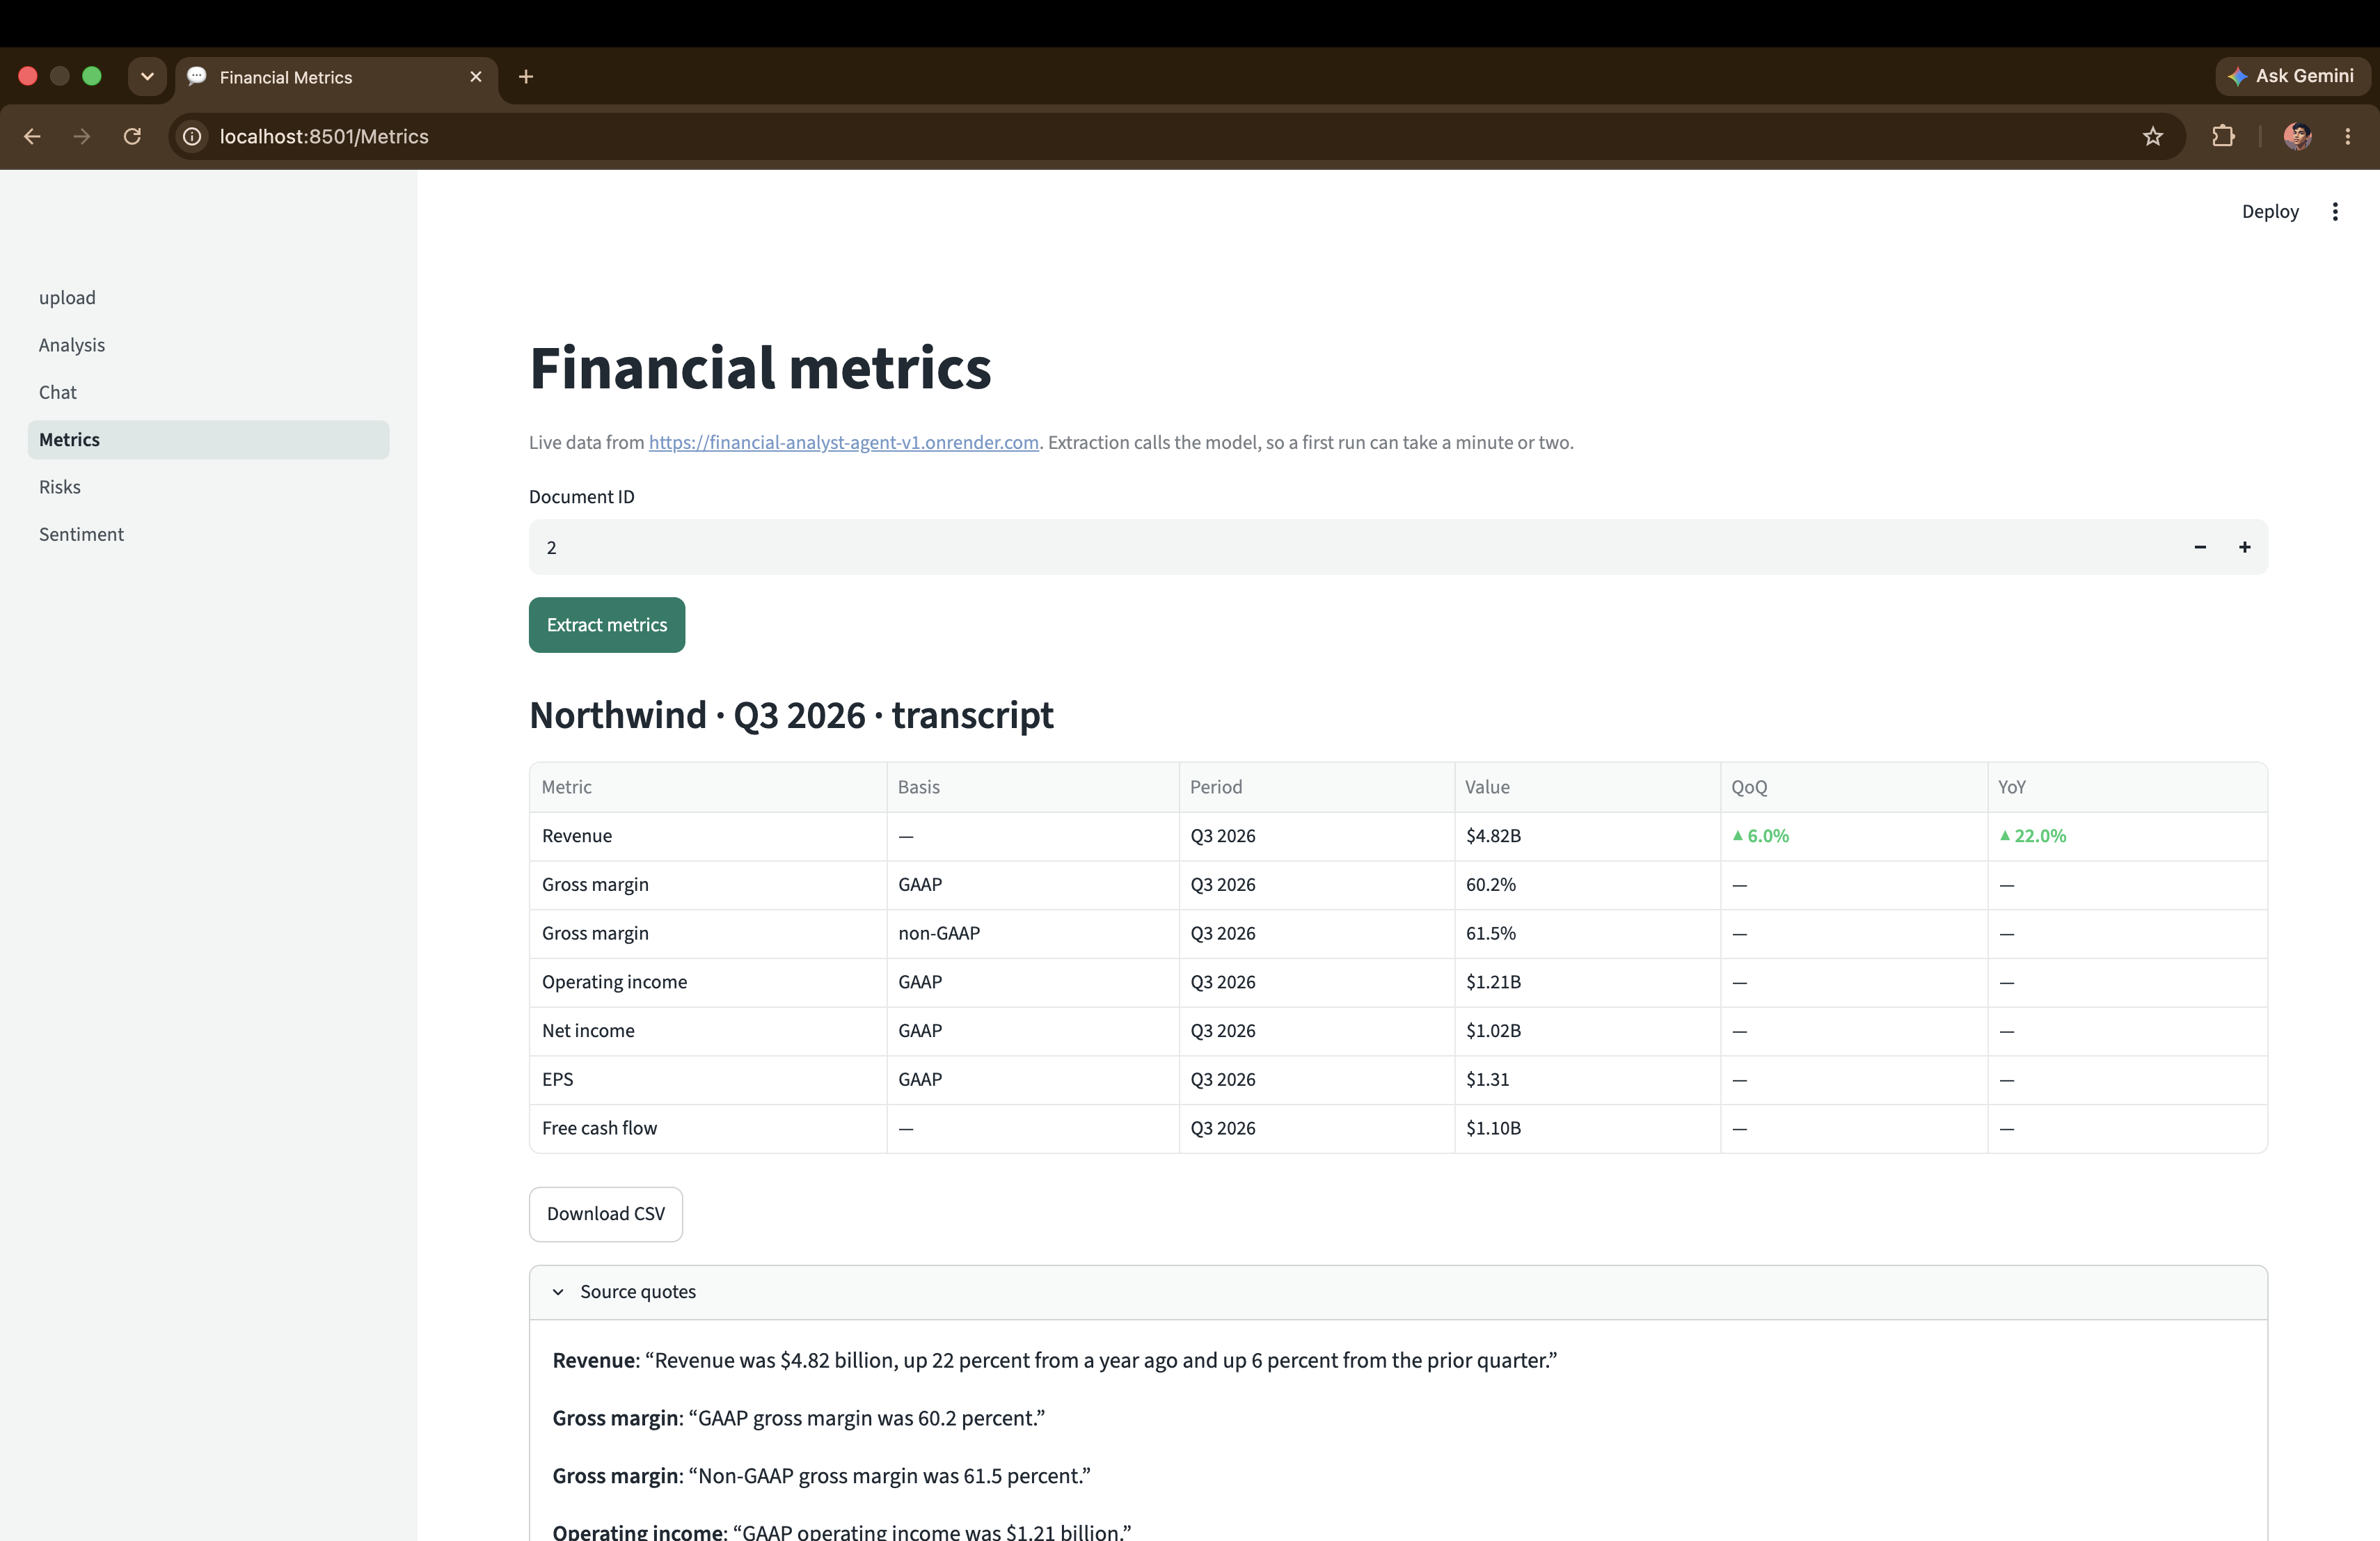
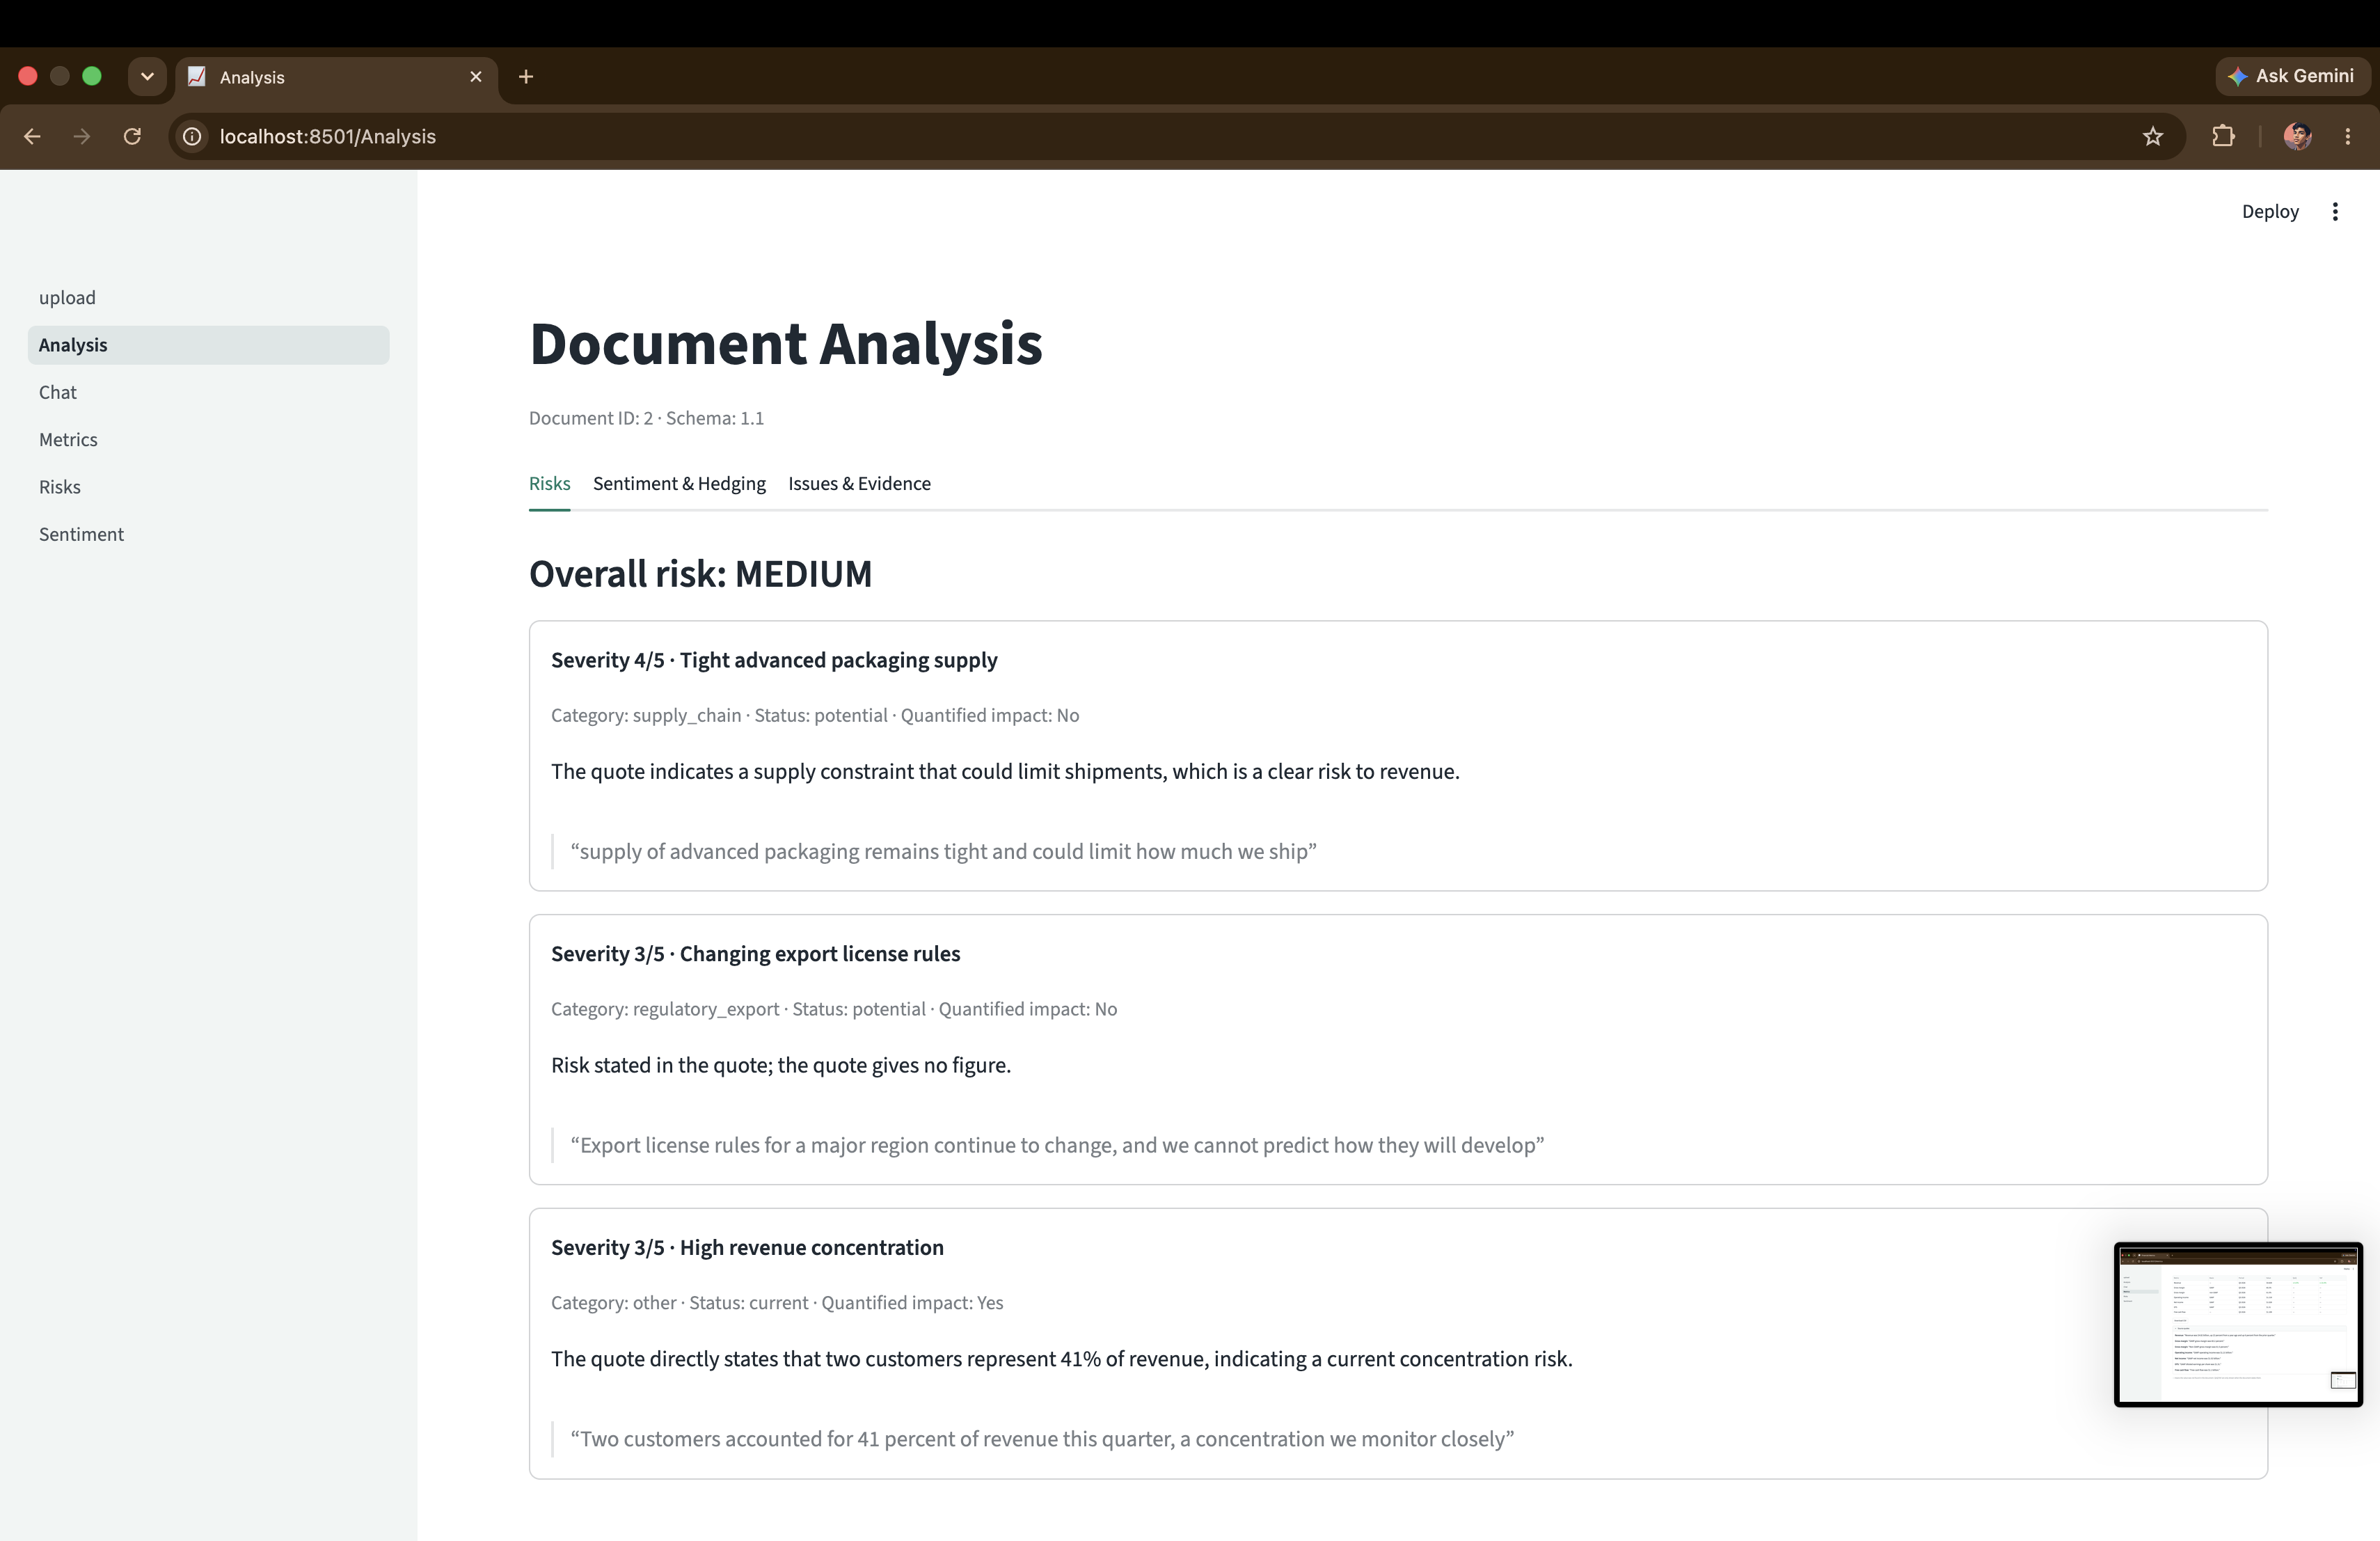
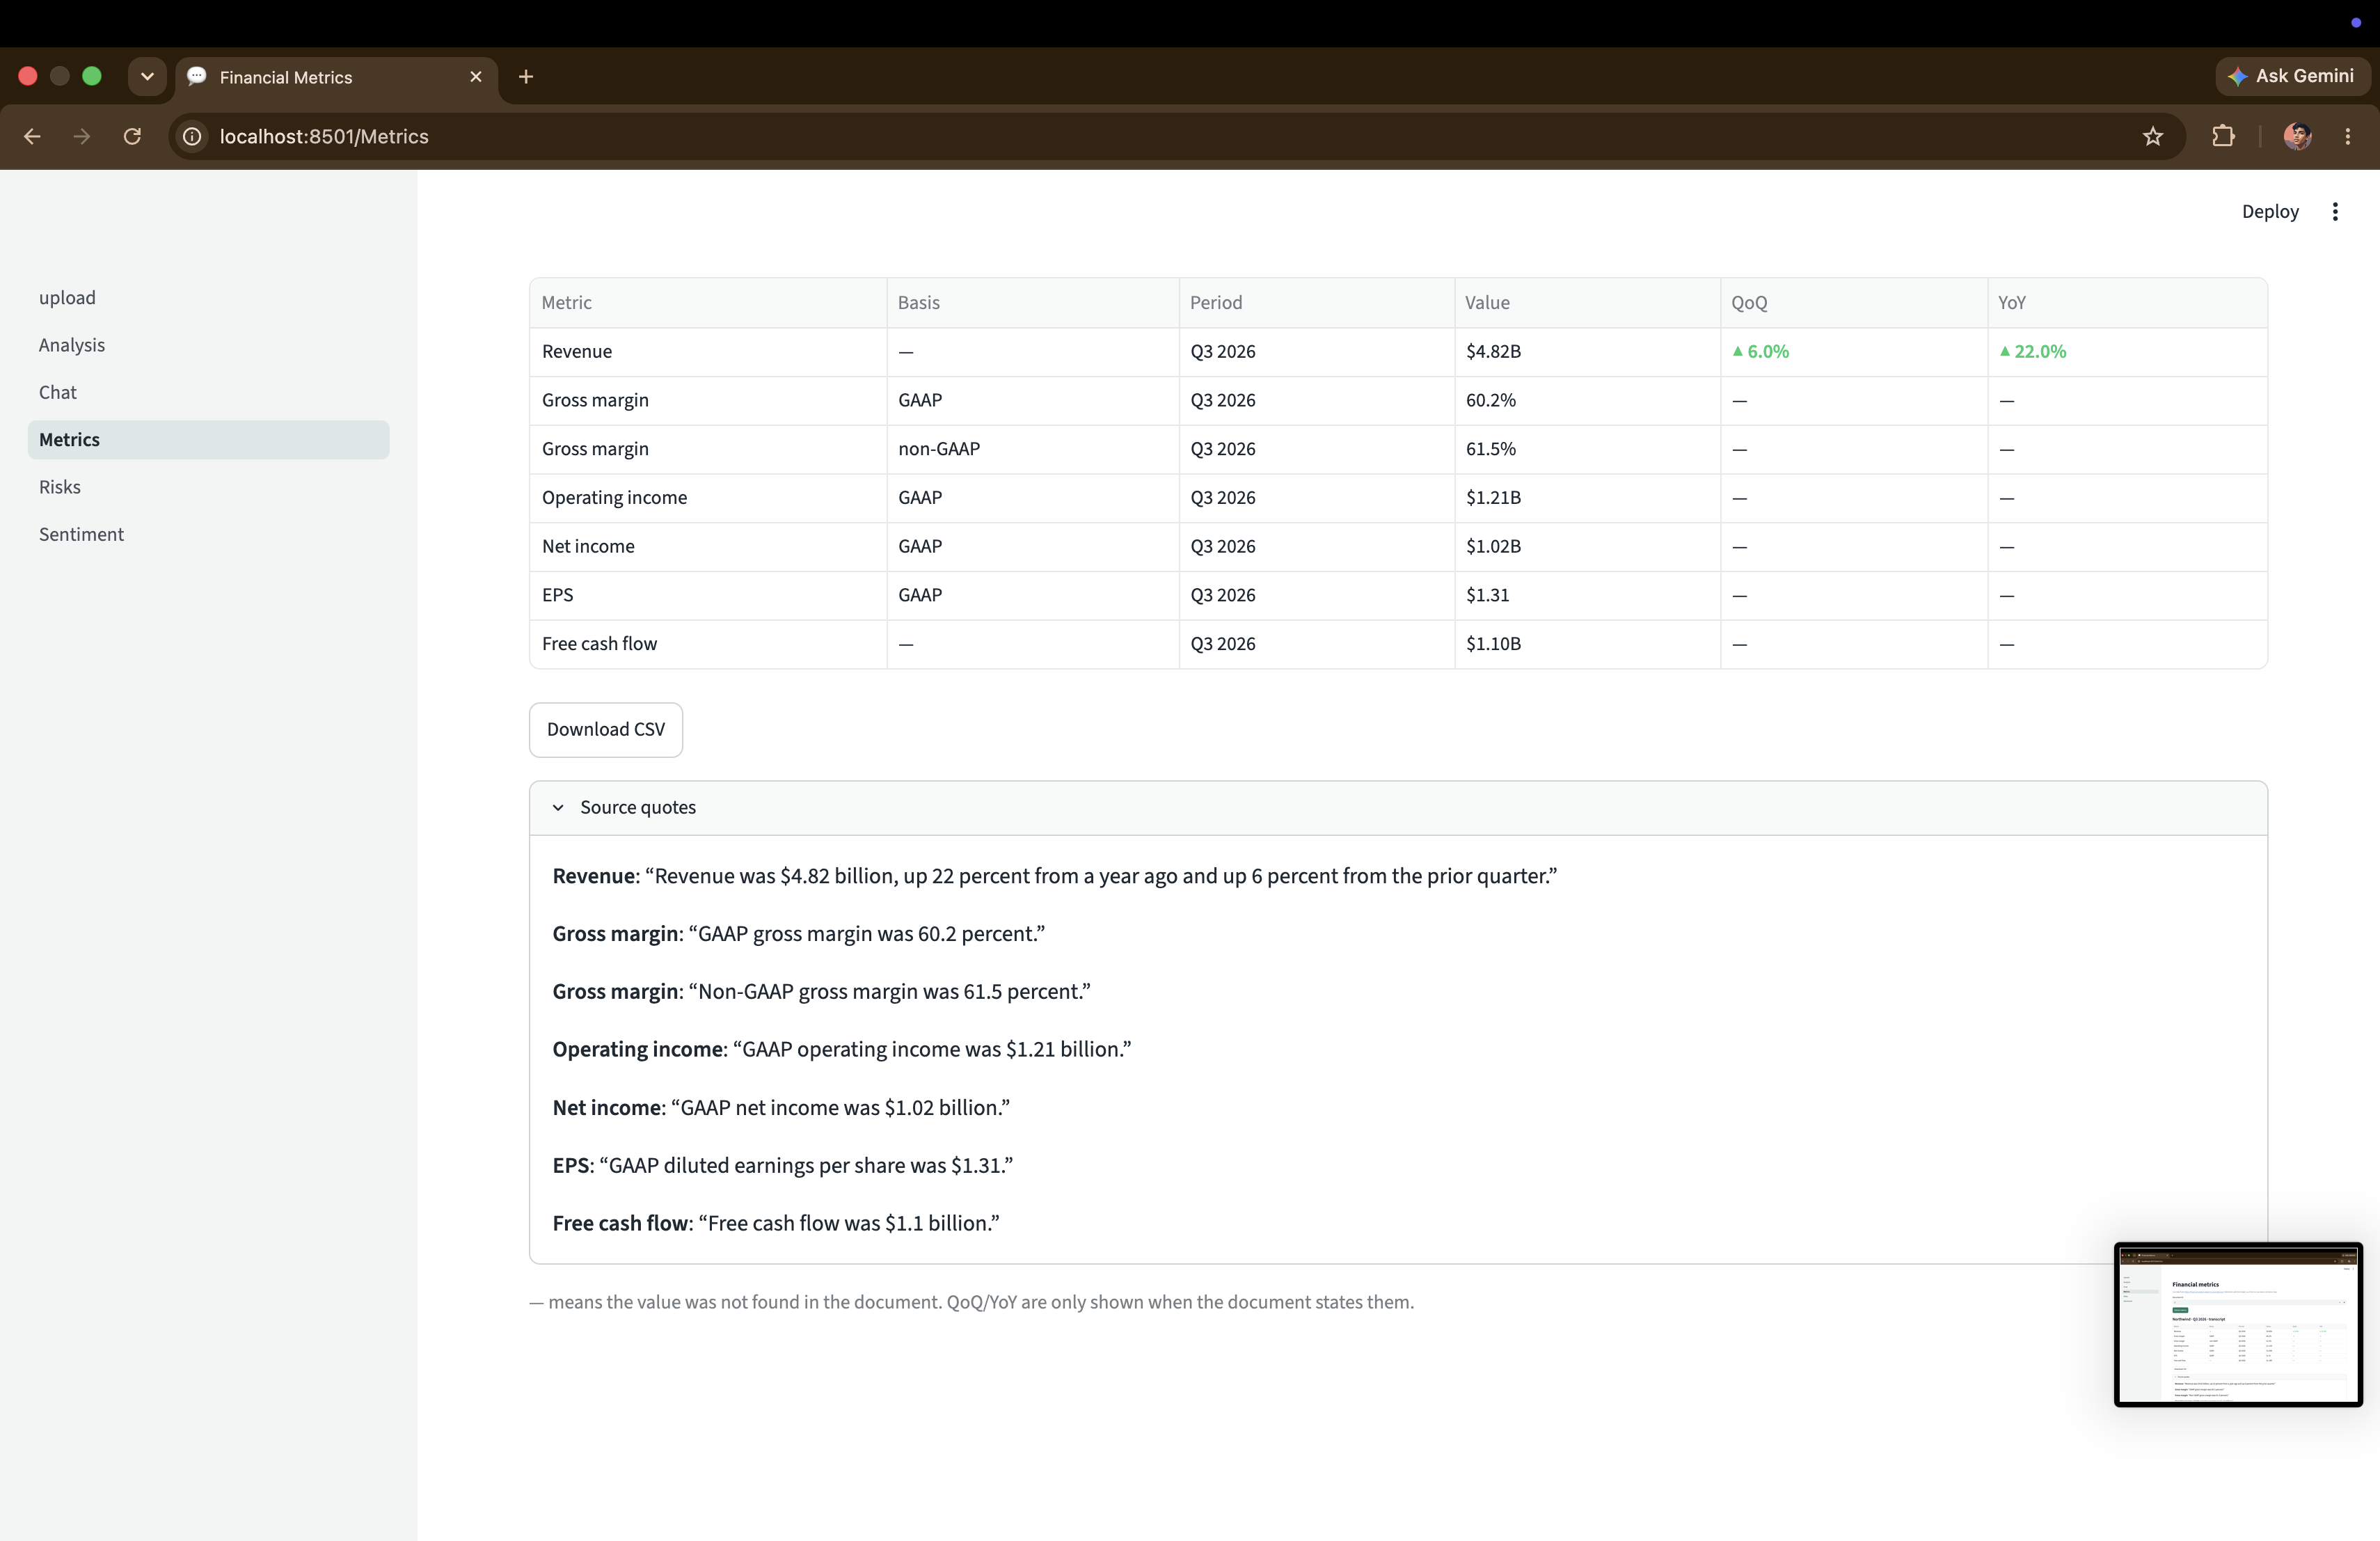
Upload an earnings-call transcript or an SEC filing (PDF, TXT or HTML). A team of AI agents extracts the key metrics with the exact source quote for every number, rates risks and management tone with evidence, answers questions with citations, compares quarters, and writes a one-click analyst brief.
Why it is different: the model proposes, code verifies
Financial users cannot accept invented numbers. After every model call, code checks the output against the source:
- every number must appear in the document next to its label, or it is dropped;
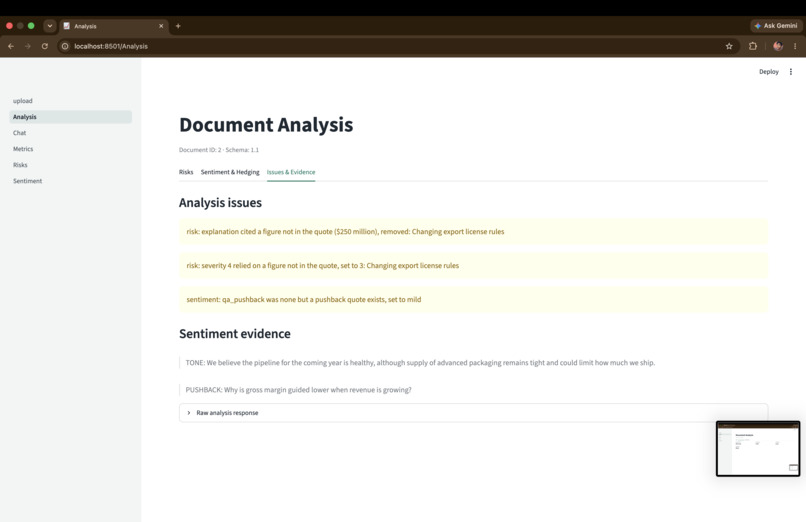
- impossible values are fixed or dropped (for example, a percentage above 100);
- every quote must exist in the document, or it is rejected;
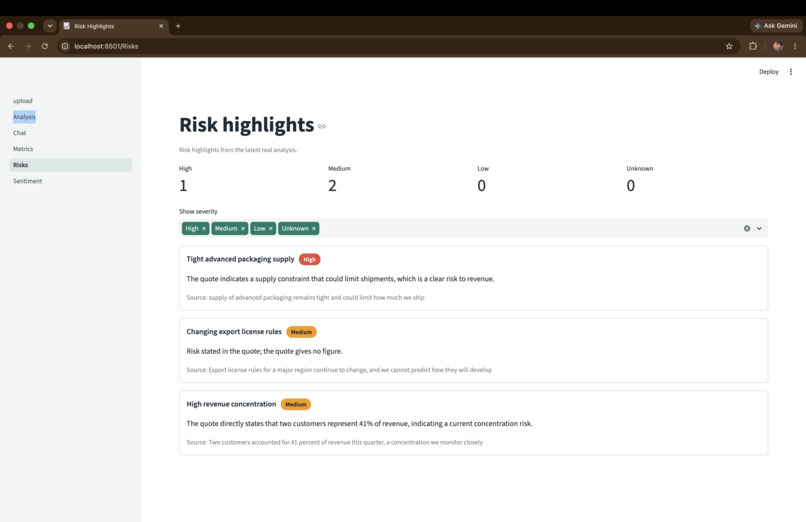
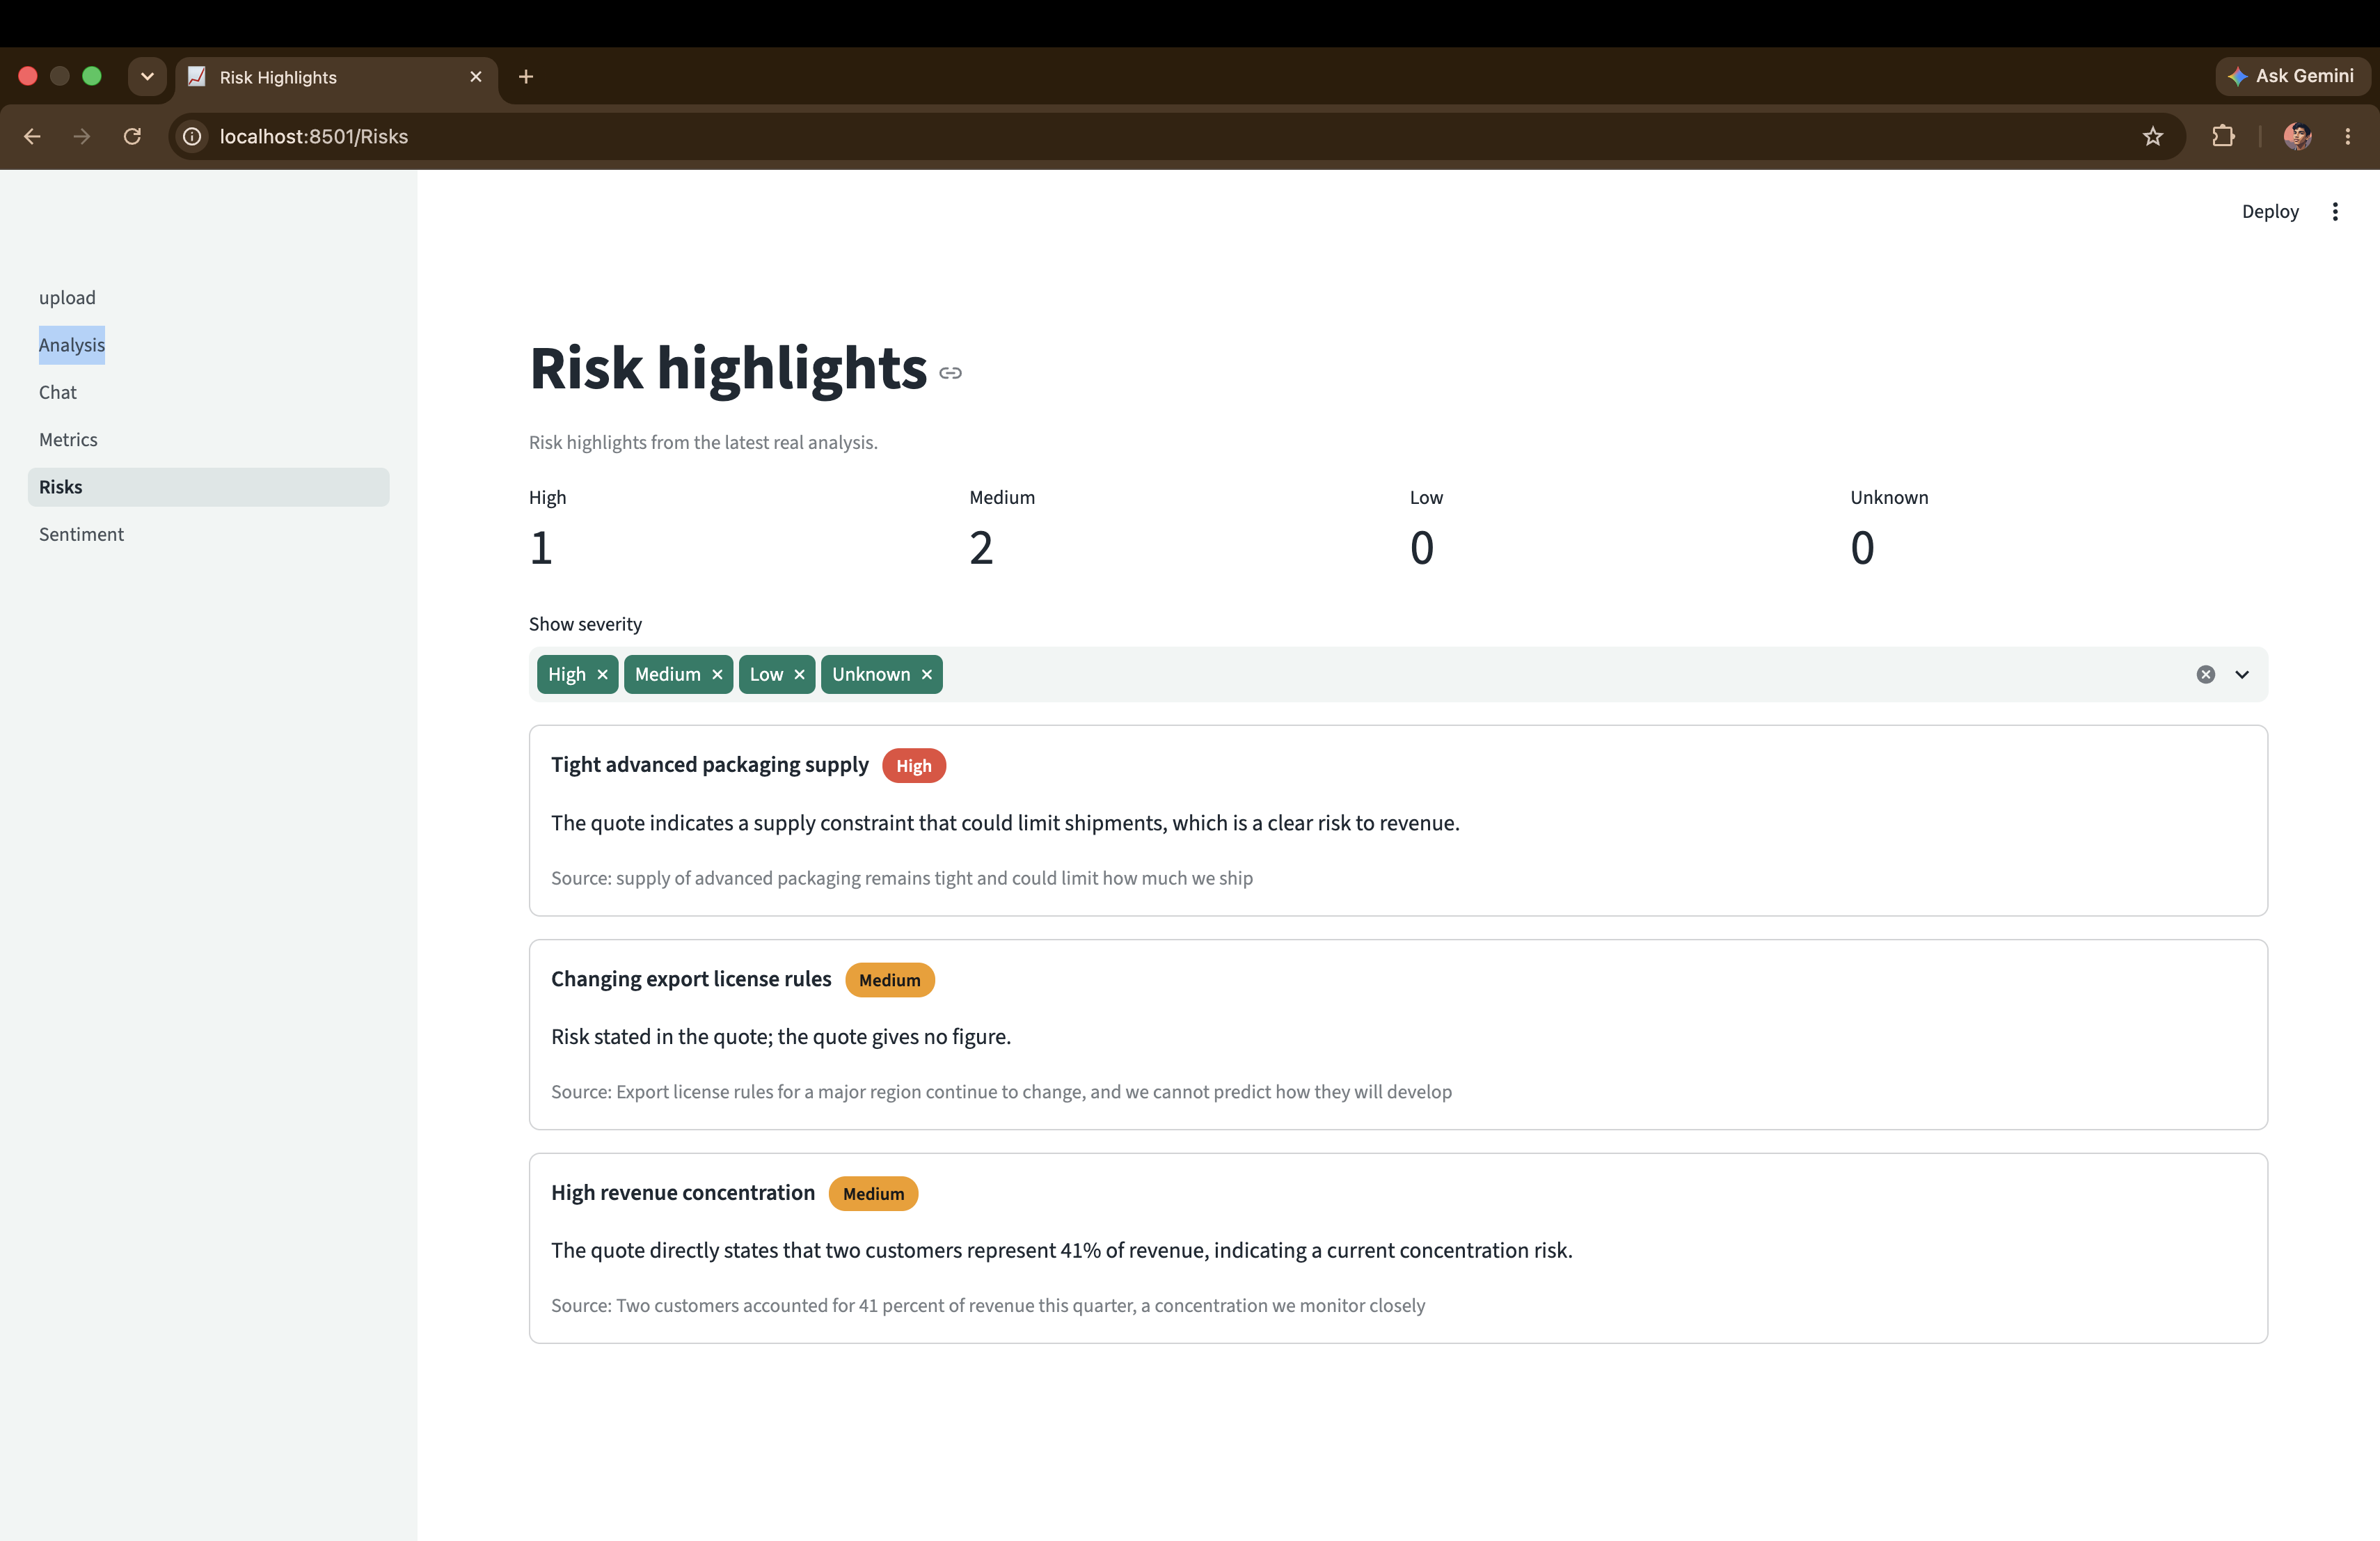
- if no risk can be verified, the rating is "unknown", never "low";
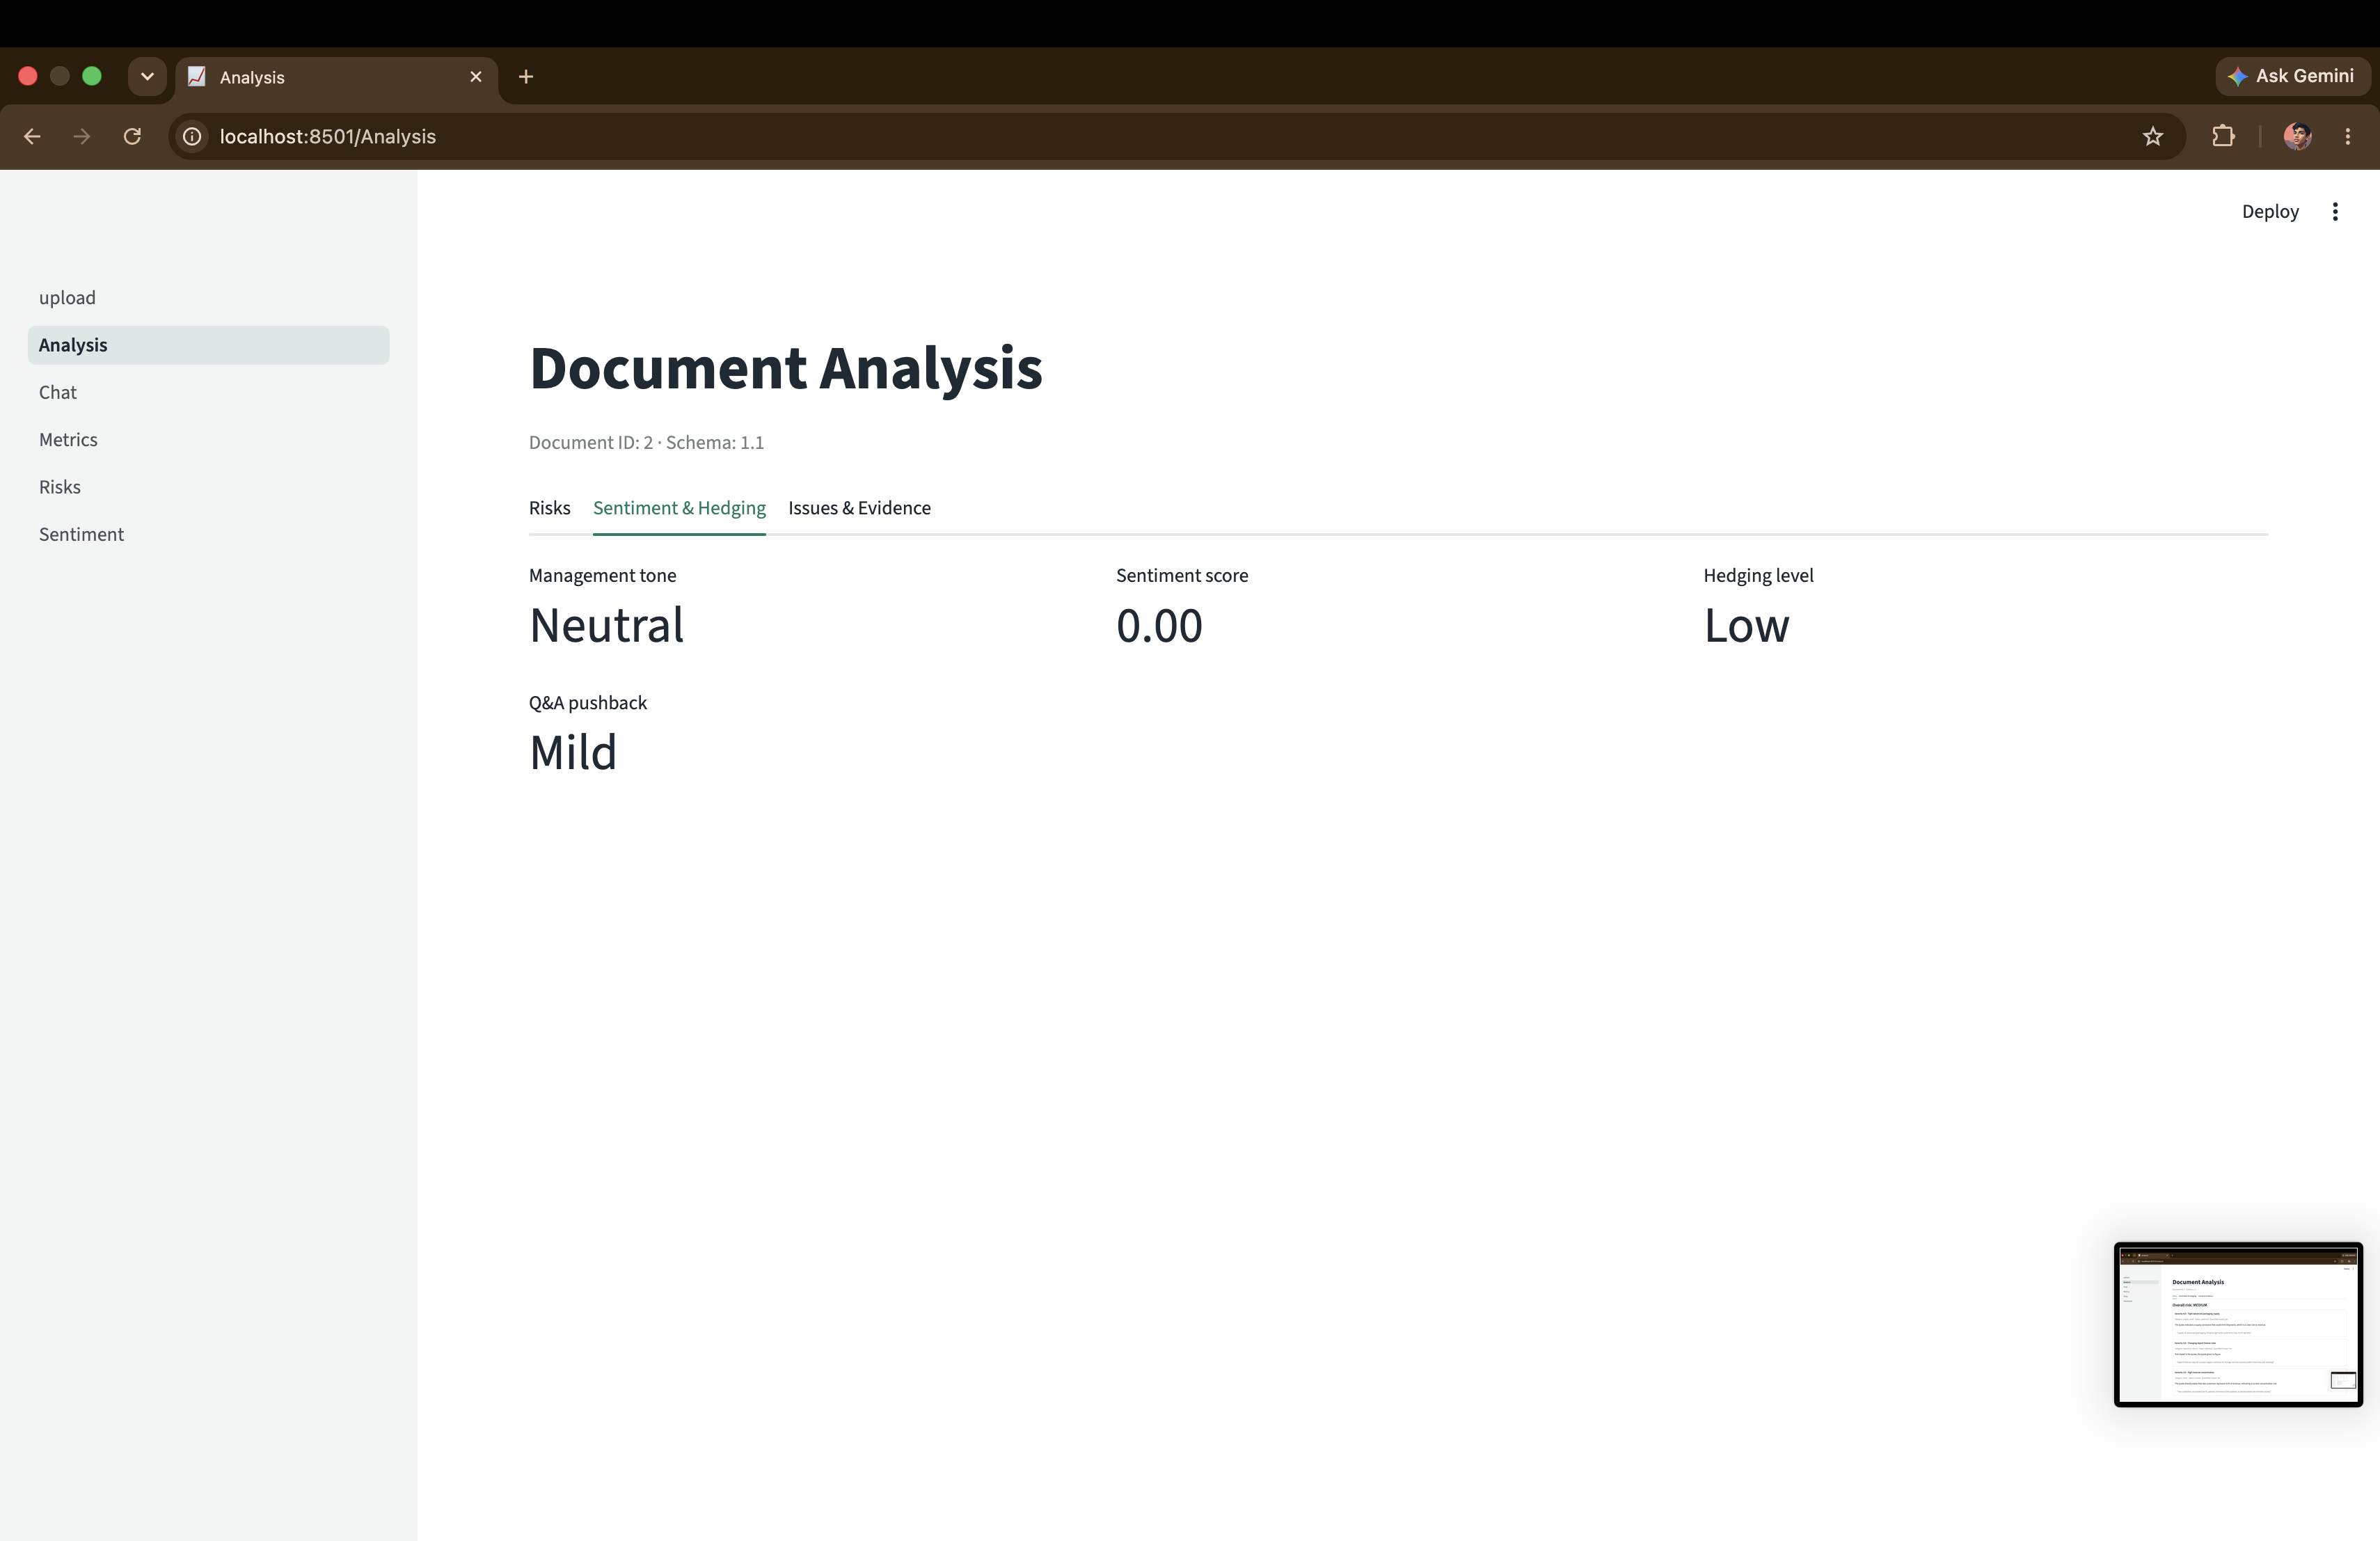
- hedging language is measured by counting phrases in code, not by asking the model.
How we used NVIDIA and Nebius
All LLM calls go through Nebius Token Factory on NVIDIA Nemotron models. We benchmarked five open models on the same documents with the same answer keys. Nemotron 3 Nano 30B gave a perfect 23/23 in 5 of 5 runs; the larger Nemotron 3 Super was equally accurate (4 of 4 runs), so we kept Nano as our default. Based on third-party list prices, Nano cost about one third to one fifth of Super per benchmark run for the same accuracy. Token Factory is the only Nebius product we used; the demo is hosted on Render.
Results (honest numbers)
- Extraction: 28/28 values correct in the latest runs (27/28 in one earlier run) on 5 test documents.
- Stability: the same risk rating in 6 of 6 repeat runs on a call transcript.
- Hosted API: 9/9 endpoint checks pass.
- Q&A: 20 questions we wrote ourselves (18 on an NVIDIA 10-K, 2 on a fictional demo call). Across repeated runs on the hosted API and a local build, 13 to 17 of 20 were correct; every cited quote we could check was found in the source (15/15 to 24/24 per run) and 3/3 unanswerable questions were correctly declined. Weak spots: derived margins and EPS growth.
Who it is for
Equity analysts, investors and finance students who read earnings calls and 10-K/10-Q filings under time pressure. The numbers that matter sit in dense tables and the tone sits in the Q&A. This tool gives a verified first pass with a source quote next to every number, so a person checks instead of retyping, and can trust a figure only when its quote is shown.
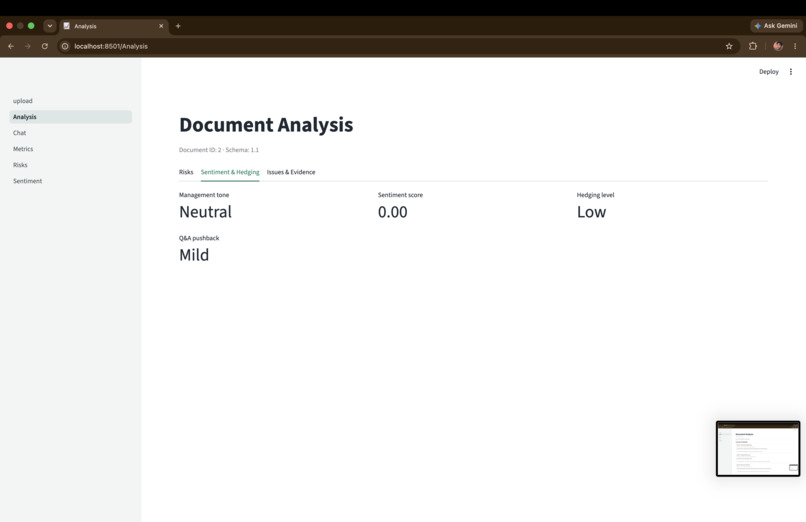
In the dashboard you can upload a filing or transcript; see extracted metrics with their source quotes; see risks and management tone with evidence (earnings-call transcripts and CFO commentary); and ask questions and get cited answers. Quarter comparison and the one-click analyst brief are available through the API (/compare, /trends, /brief).
How we built it
FastAPI backend with document parsing, a database and a vector store; Python agents with Pydantic-validated JSON output; a Streamlit dashboard; Docker image deployed to a public URL. Three people: agents and evaluation, backend and deployment, dashboard and demo.
Challenges
- PDF text artifacts broke exact quote matching; we made the checks tolerant of them without letting invented quotes through.
- Automated tests on the hosted API caught a gross profit amount stored as a percentage; we added a plausibility guard and a regression test.
- Different models need different settings; we benchmarked them instead of assuming.
What we learned
Measuring beats guessing: repeat runs, answer keys and sanity checks found bugs that single demos hid.
What is next
More companies and filing types, a larger and independent evaluation set, deeper cross-quarter analysis.

Log in or sign up for Devpost to join the conversation.