-
-
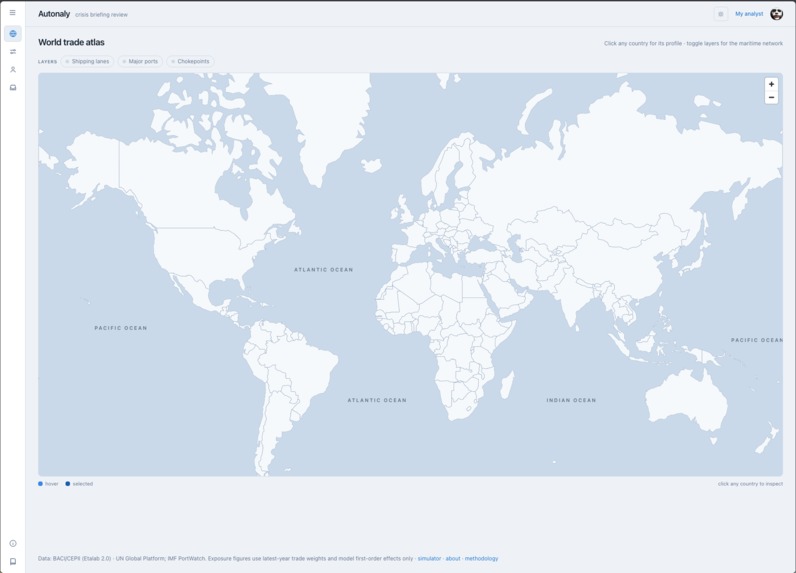
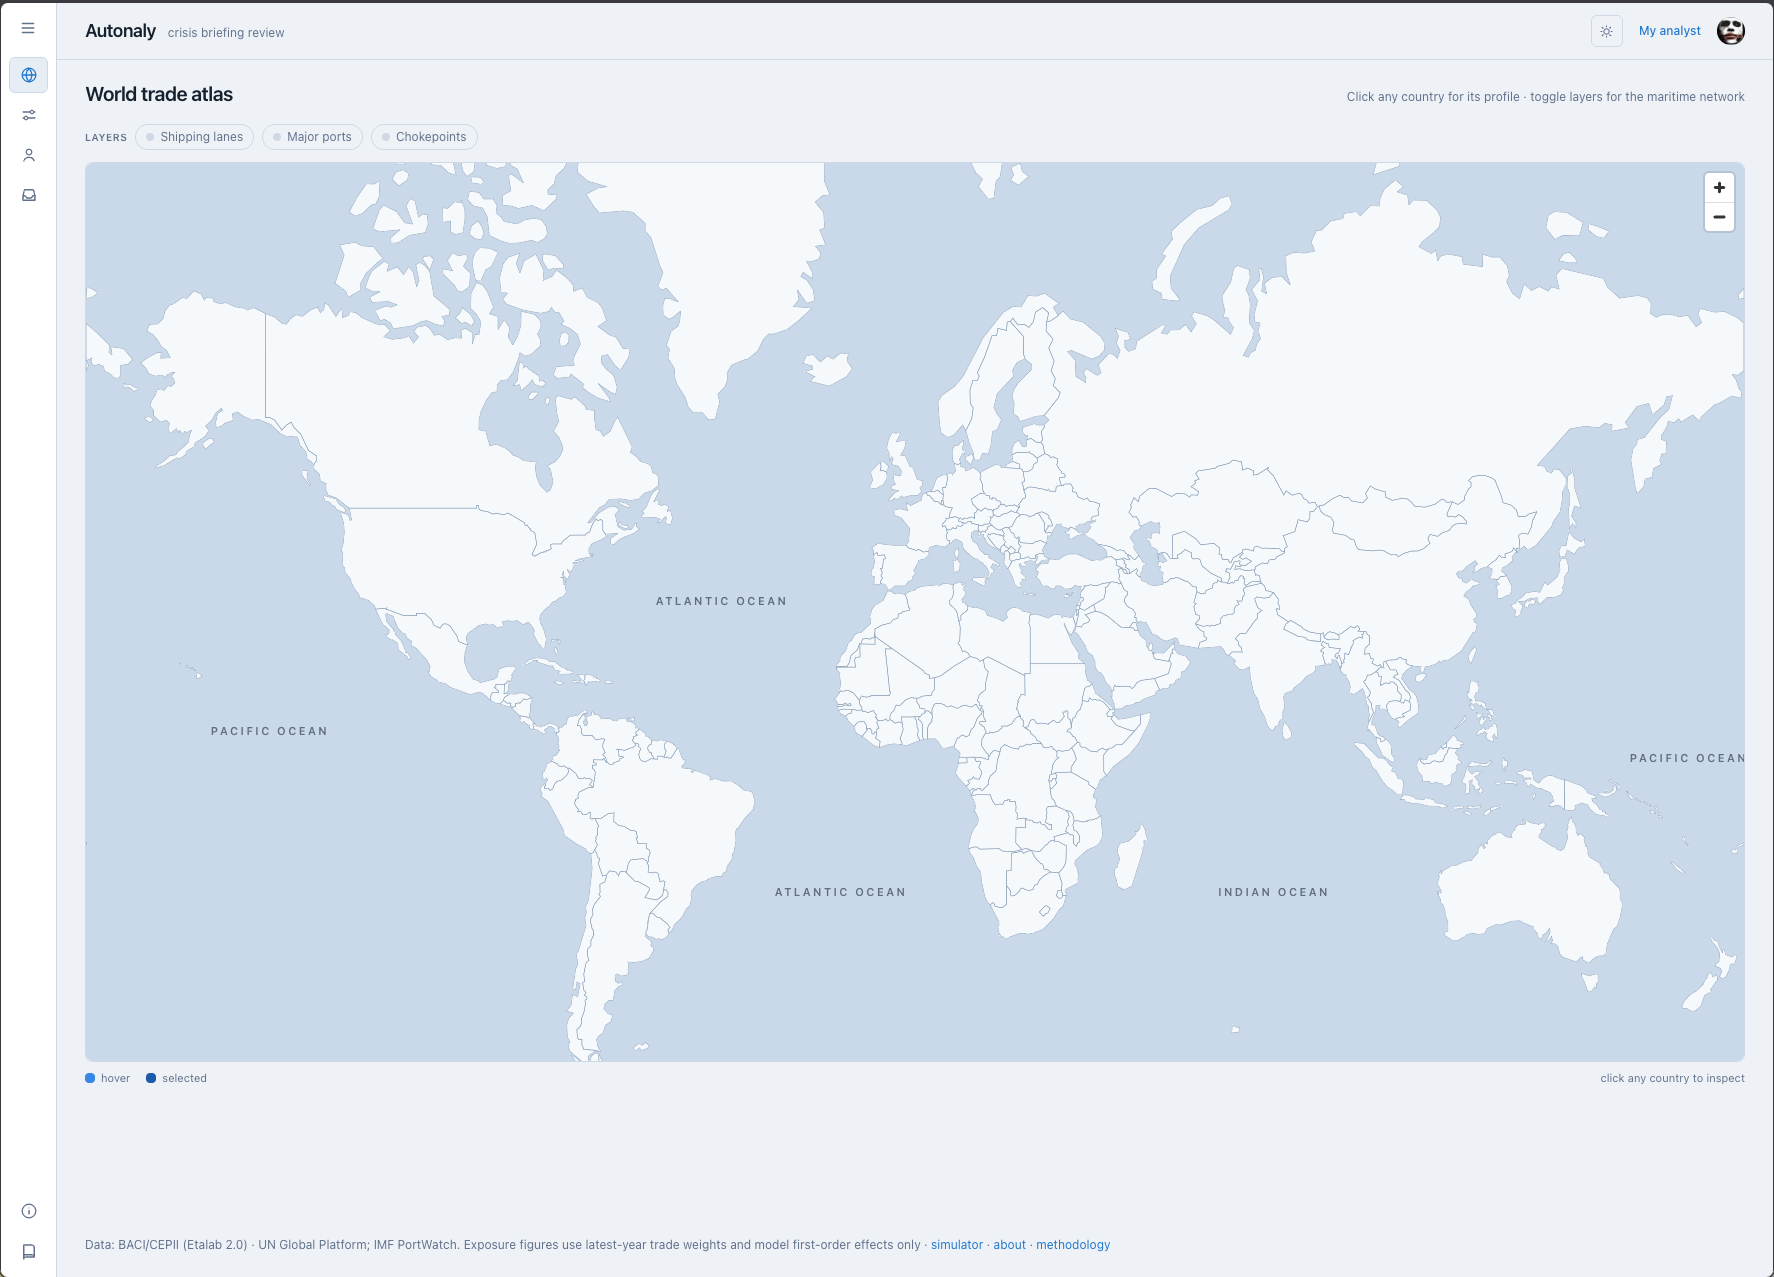
Atlas Page
-
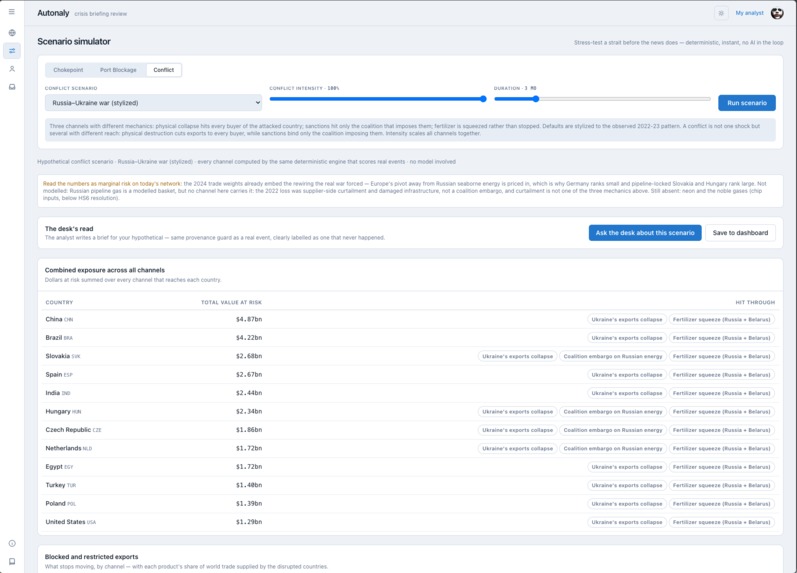
Simulation Page
-
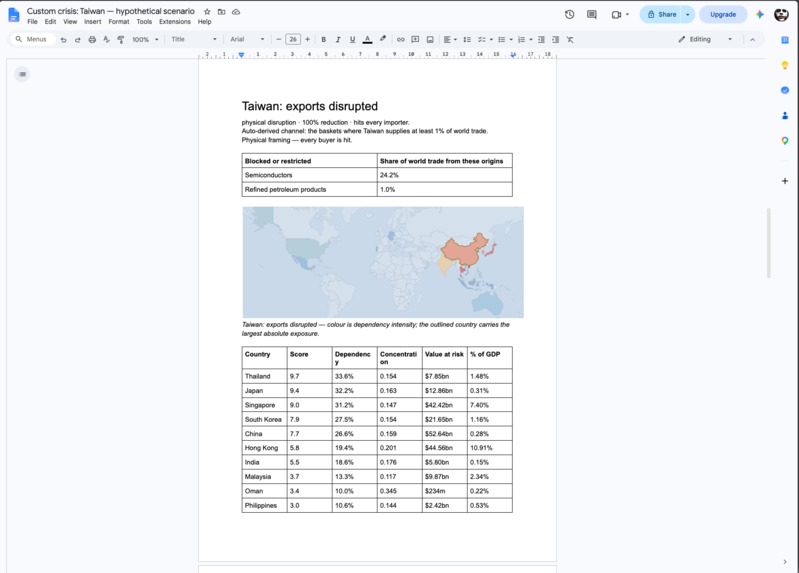
Report Example
-
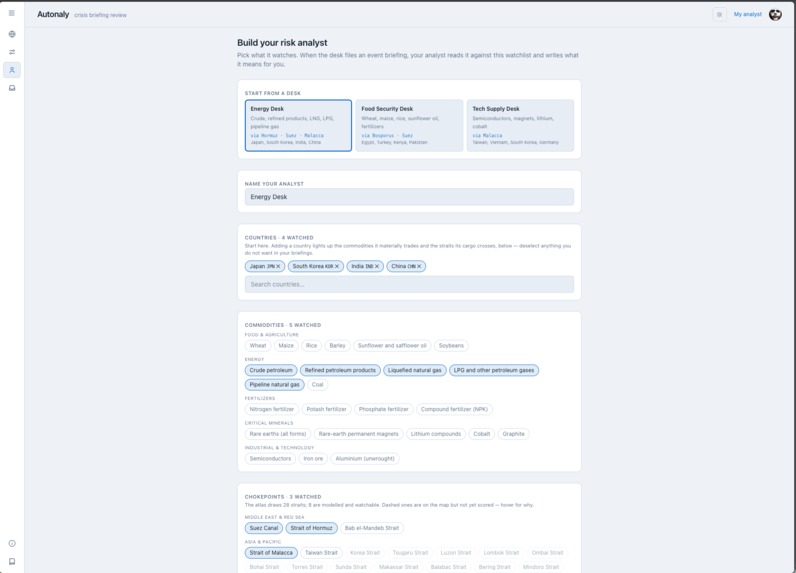
Dashboard
-
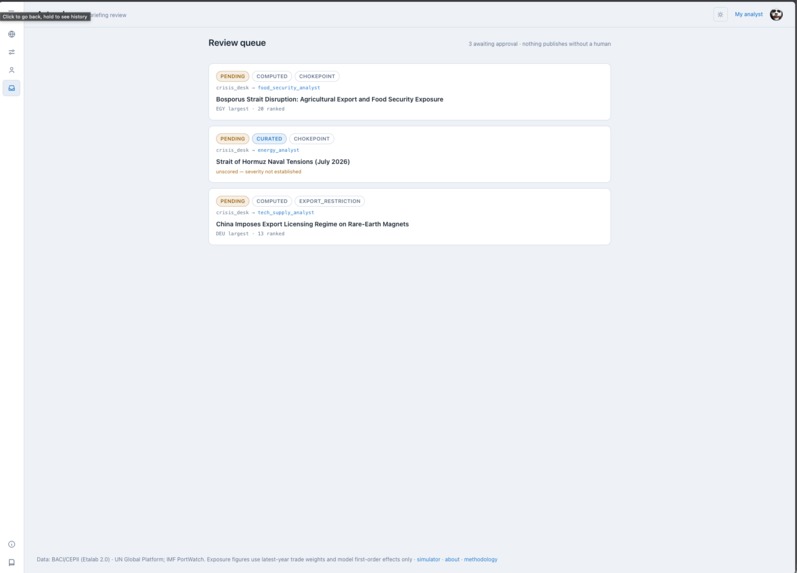
Review Page
-
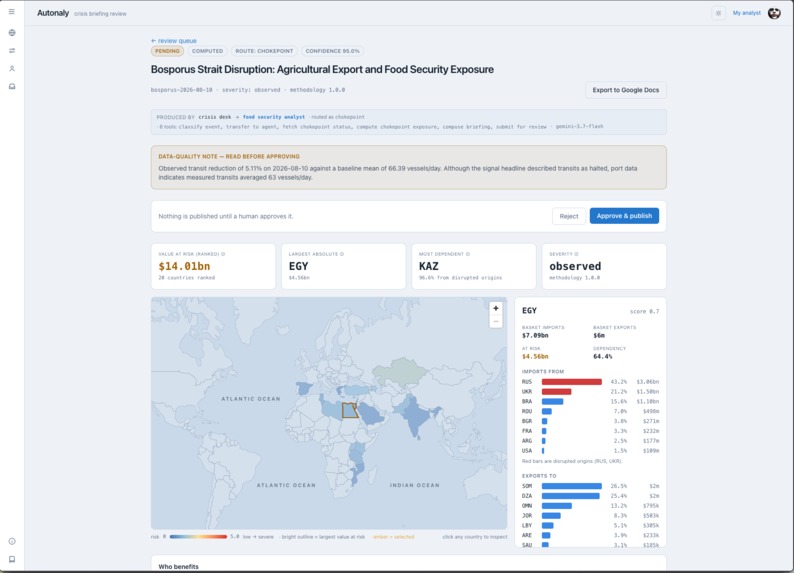
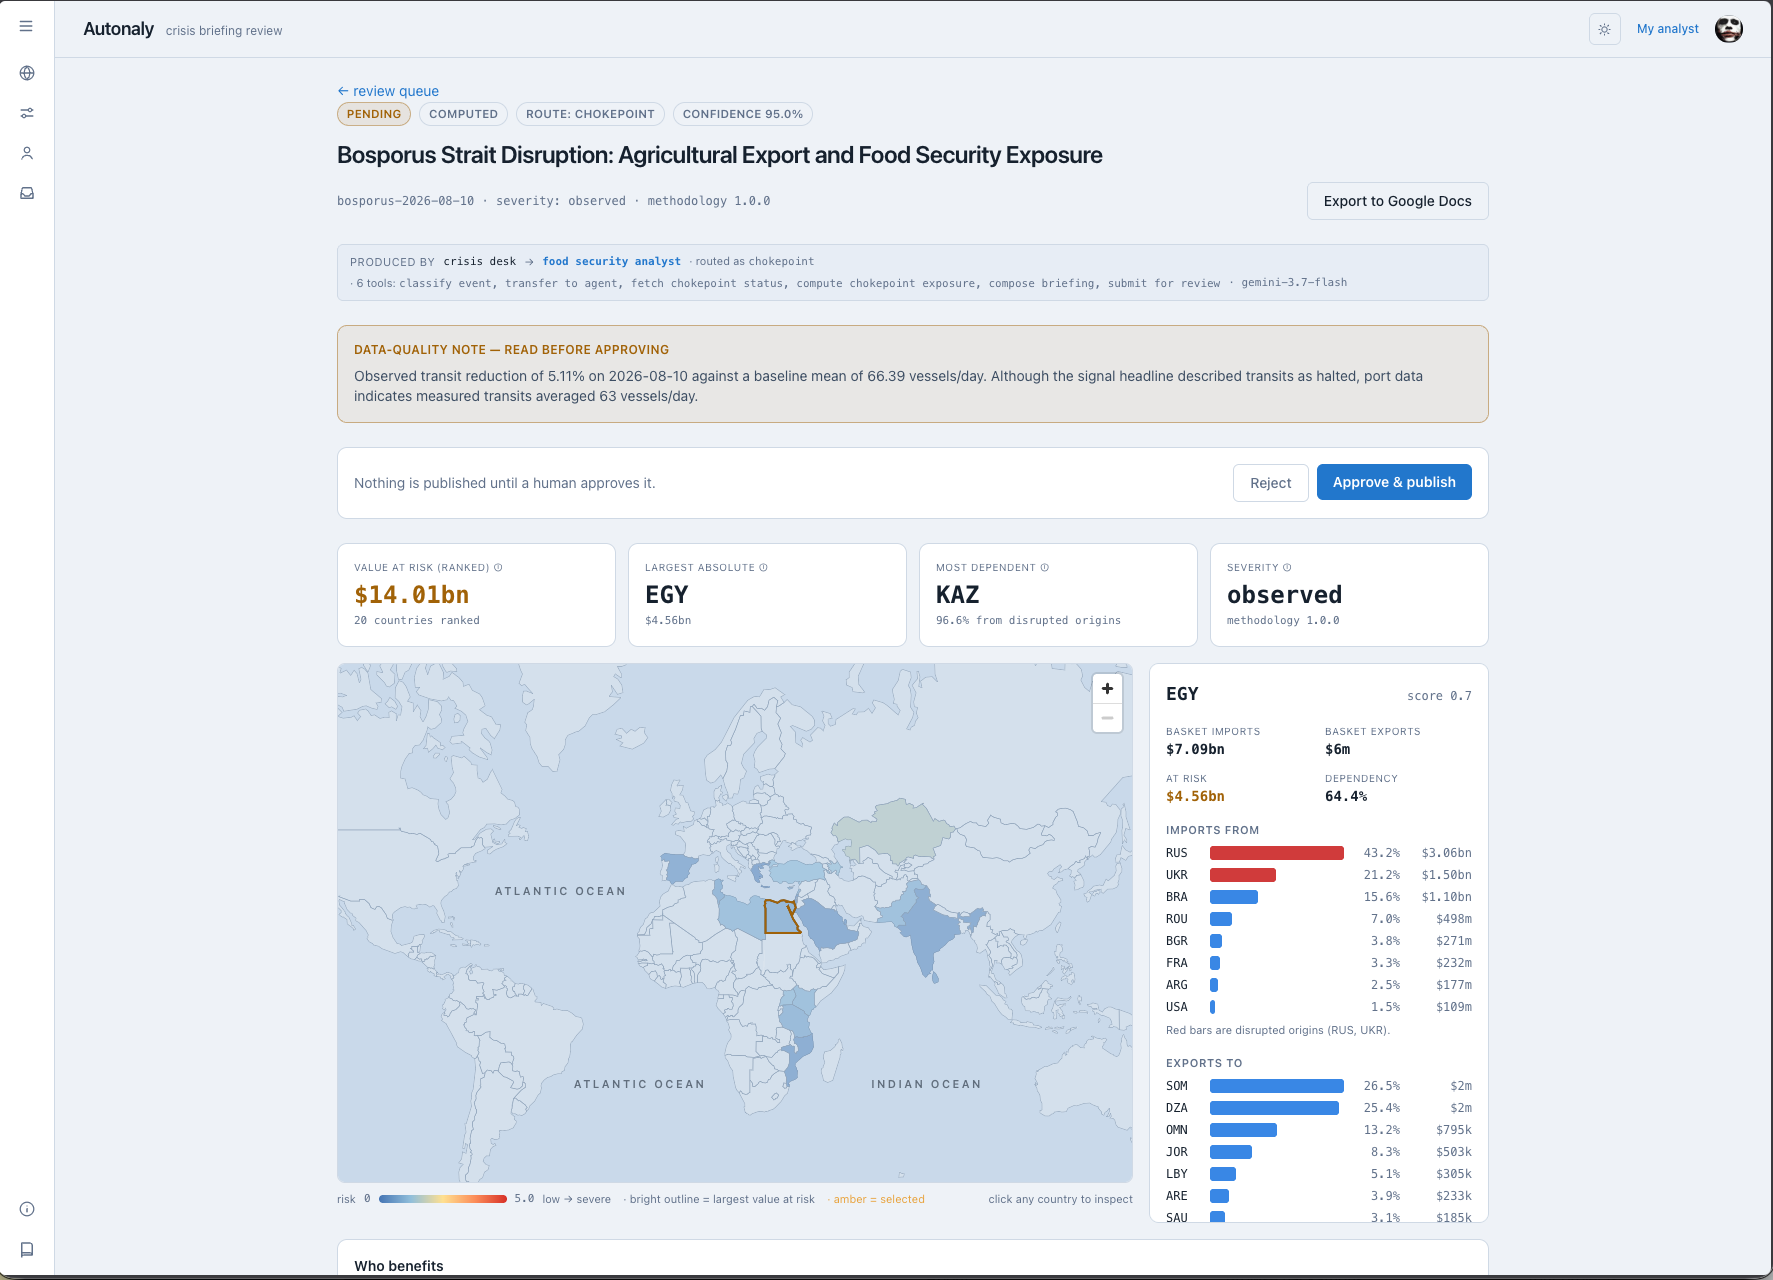
Report for review
-
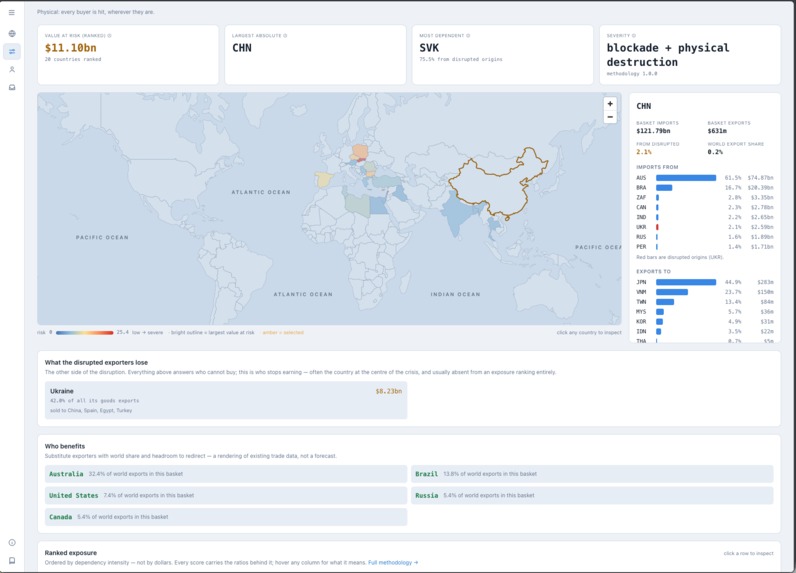
Analysis Breakdown
Inspiration
When the Ever Given wedged itself across the Suez Canal, every outlet ran the same story: global trade paralysed. Almost none of them answered the question a person actually has, which is who gets hurt, and how badly.
That answer takes an analyst hours of pulling customs data and working out who depends on whom — and most published answers never get that far, so they stay qualitative. "Severe disruption to European supply chains" is not a number anyone can act on.
We also noticed something worse. Ask a general-purpose model what happens if Hormuz closes and it will give you a confident, plausible, completely unverifiable answer. The failure mode of AI in this domain isn't refusing to help — it's answering too well.
So we built the opposite: an agent that decides what kind of question this is and which desk should own it, hands the arithmetic to something that cannot hallucinate, and refuses outright when the data won't support an answer.
What it does
A wire signal lands on an event stream — a canal blocked, a strait threatened, an export ban announced. Nobody pushes a button.
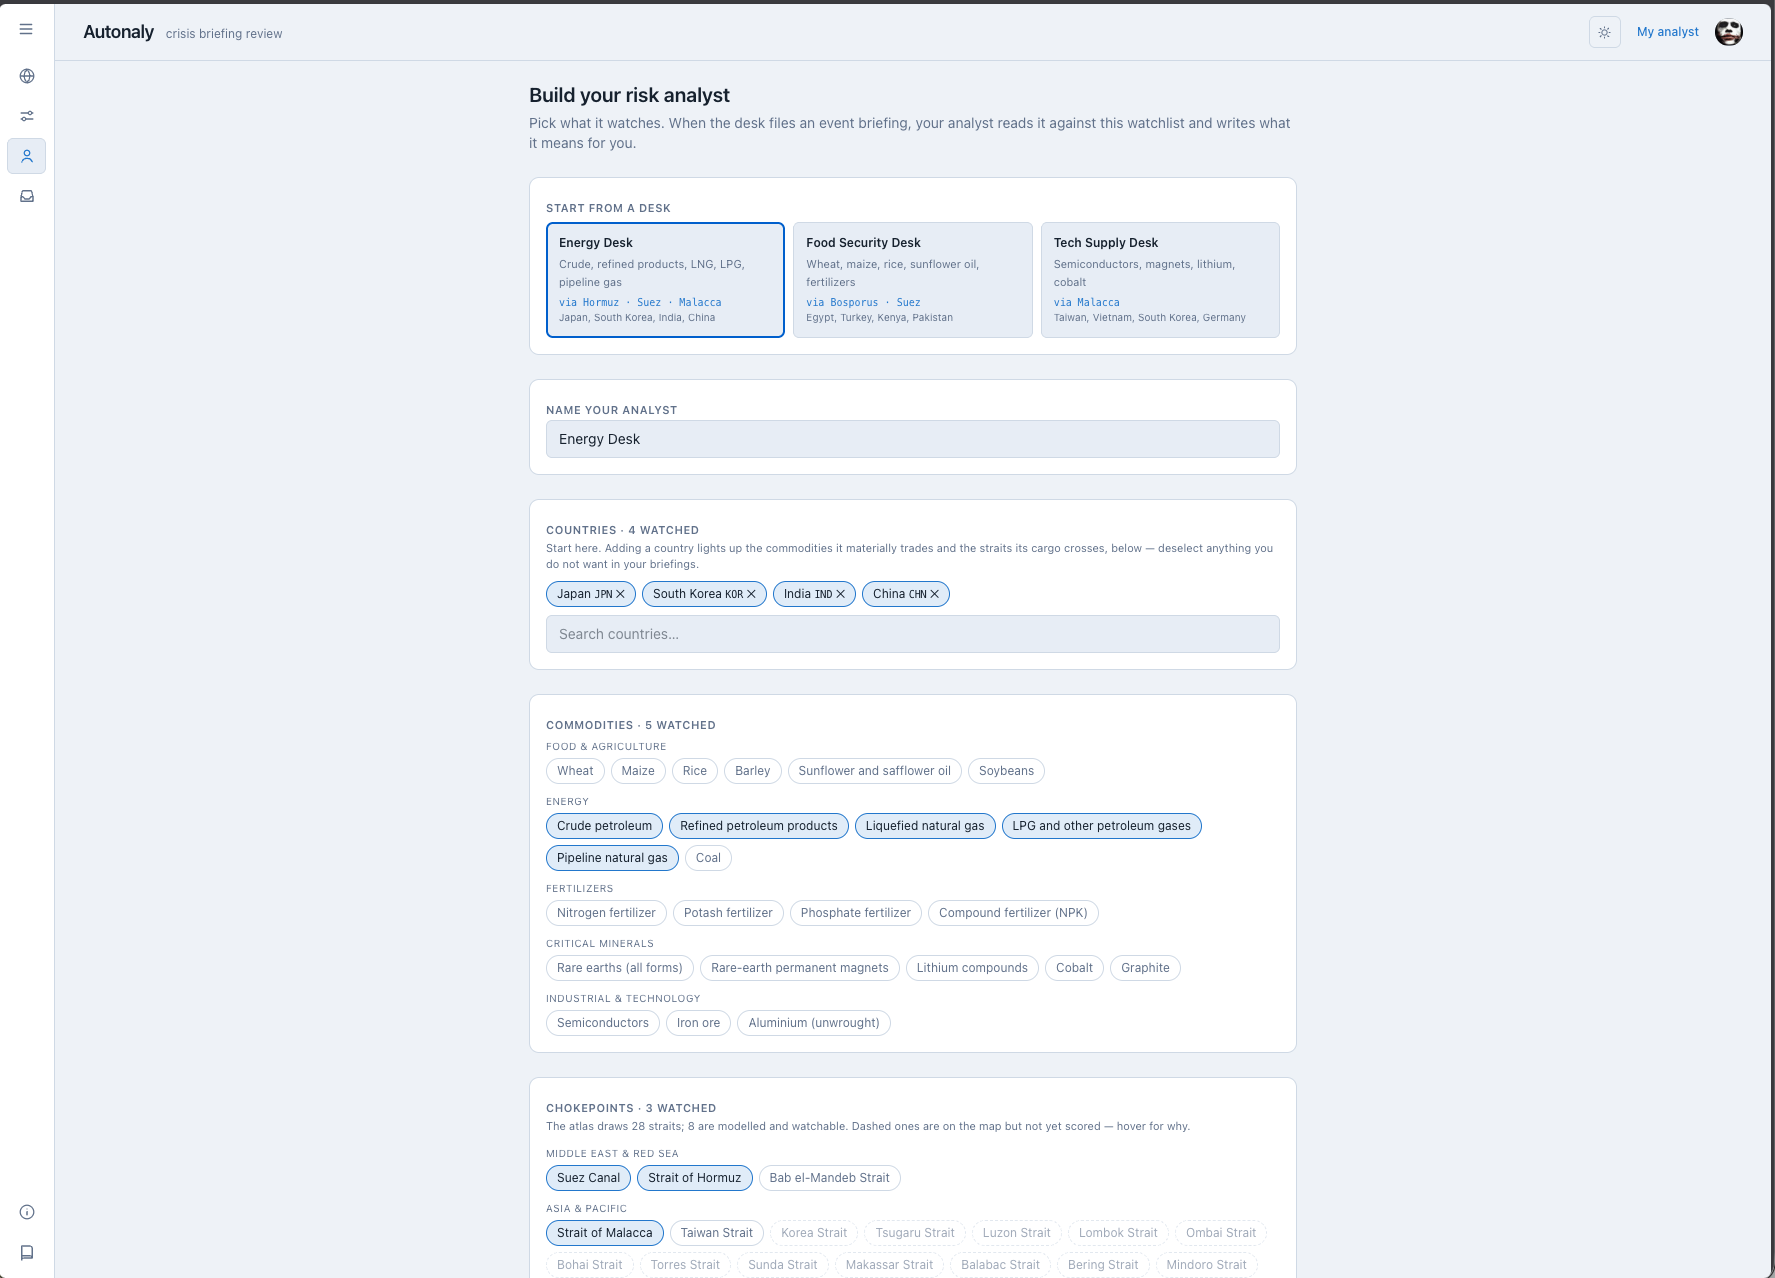
A coordinator agent classifies the event and transfers it to one of three specialists — energy, food security, or technology supply. That hand-off is the consequential decision, because a different classification consults a different data source. Financial crises are refused outright: they transmit through capital flows, which customs data cannot see.
The specialist gathers its own evidence. For a chokepoint event it reads real vessel transits from IMF PortWatch — so when a headline says "halted" and the ships say a 17% reduction, the ships win. Severity is measured, never assumed.
A deterministic engine then computes exposure over 11.25 million bilateral trade rows from CEPII BACI: dependency ratios, supplier concentration, dollars at risk, and what that is worth against each country's GDP. Nothing publishes without a human clicking approve.
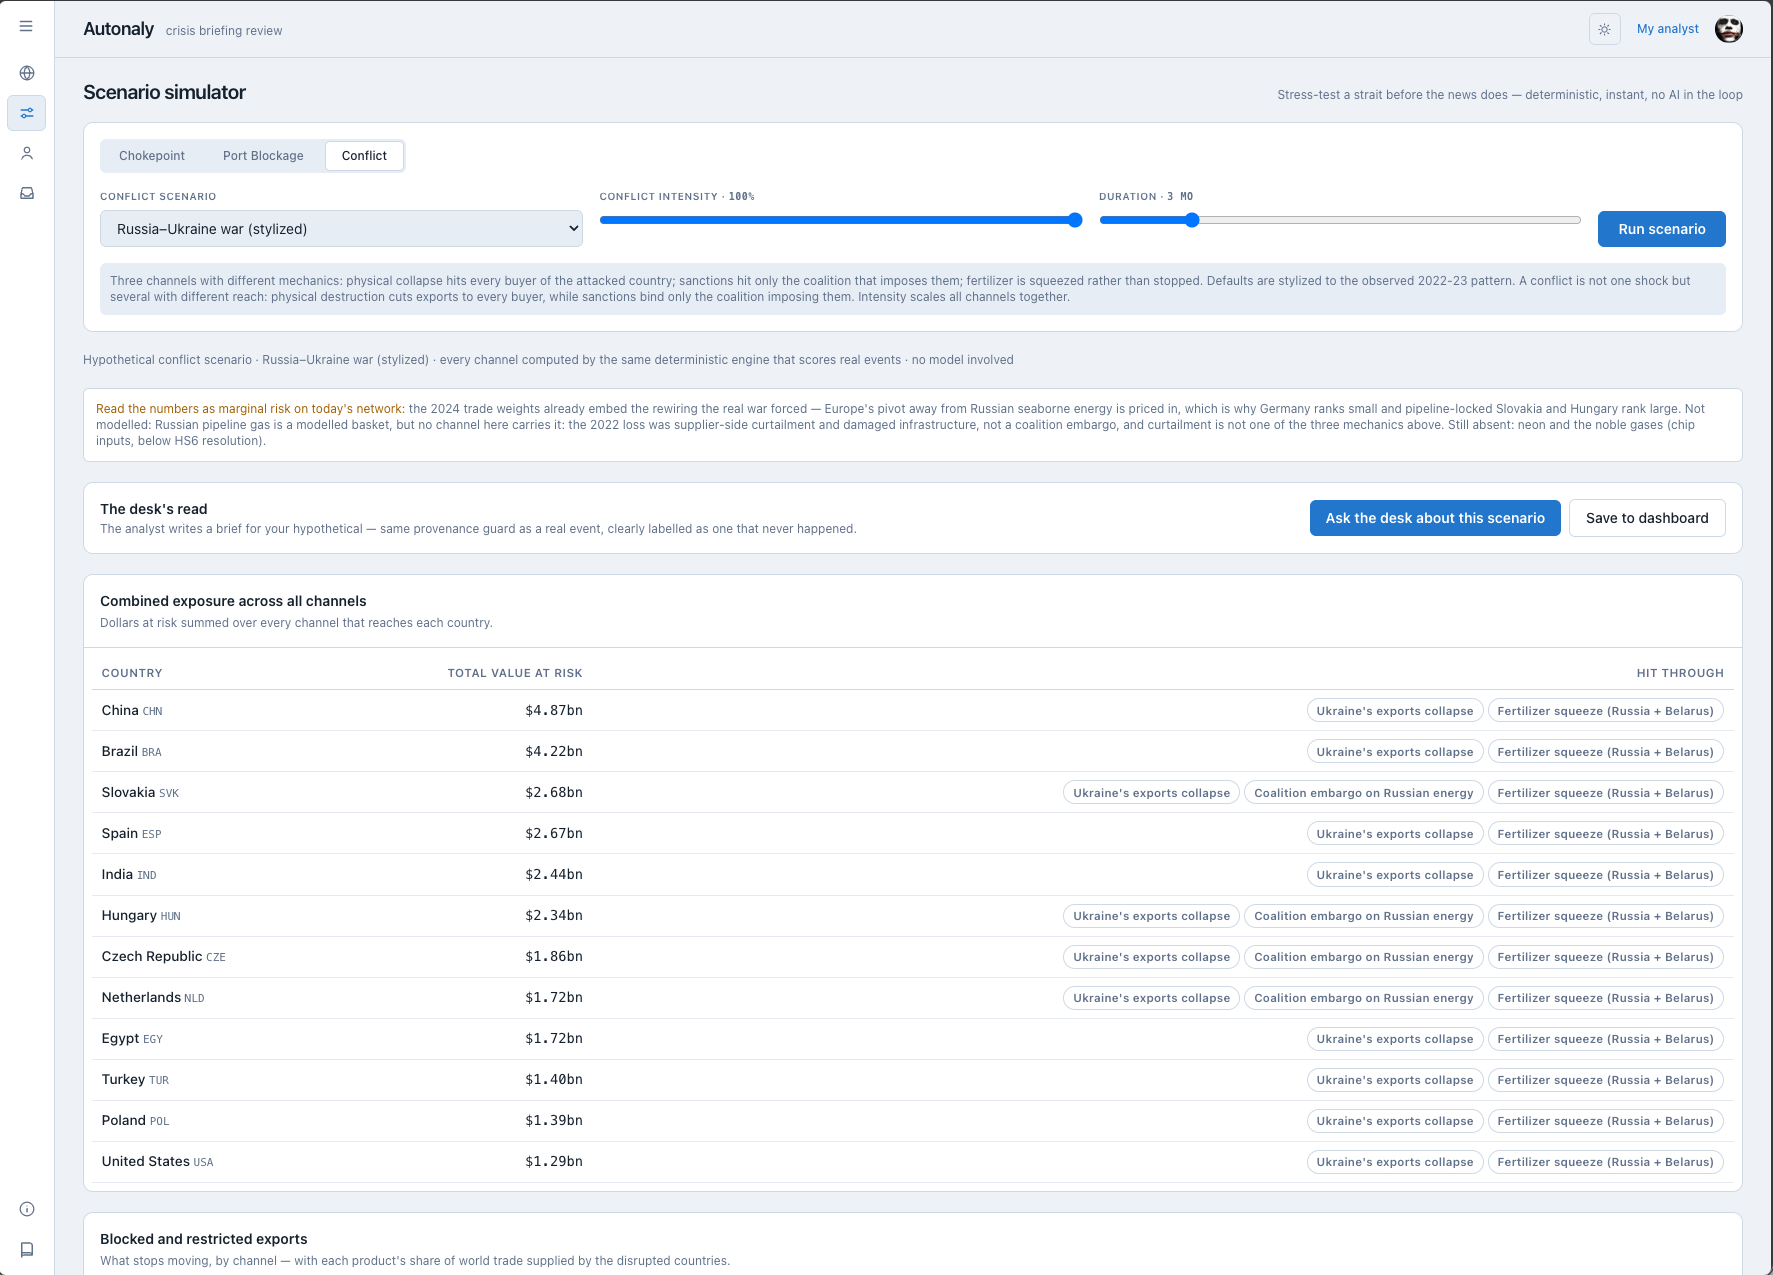
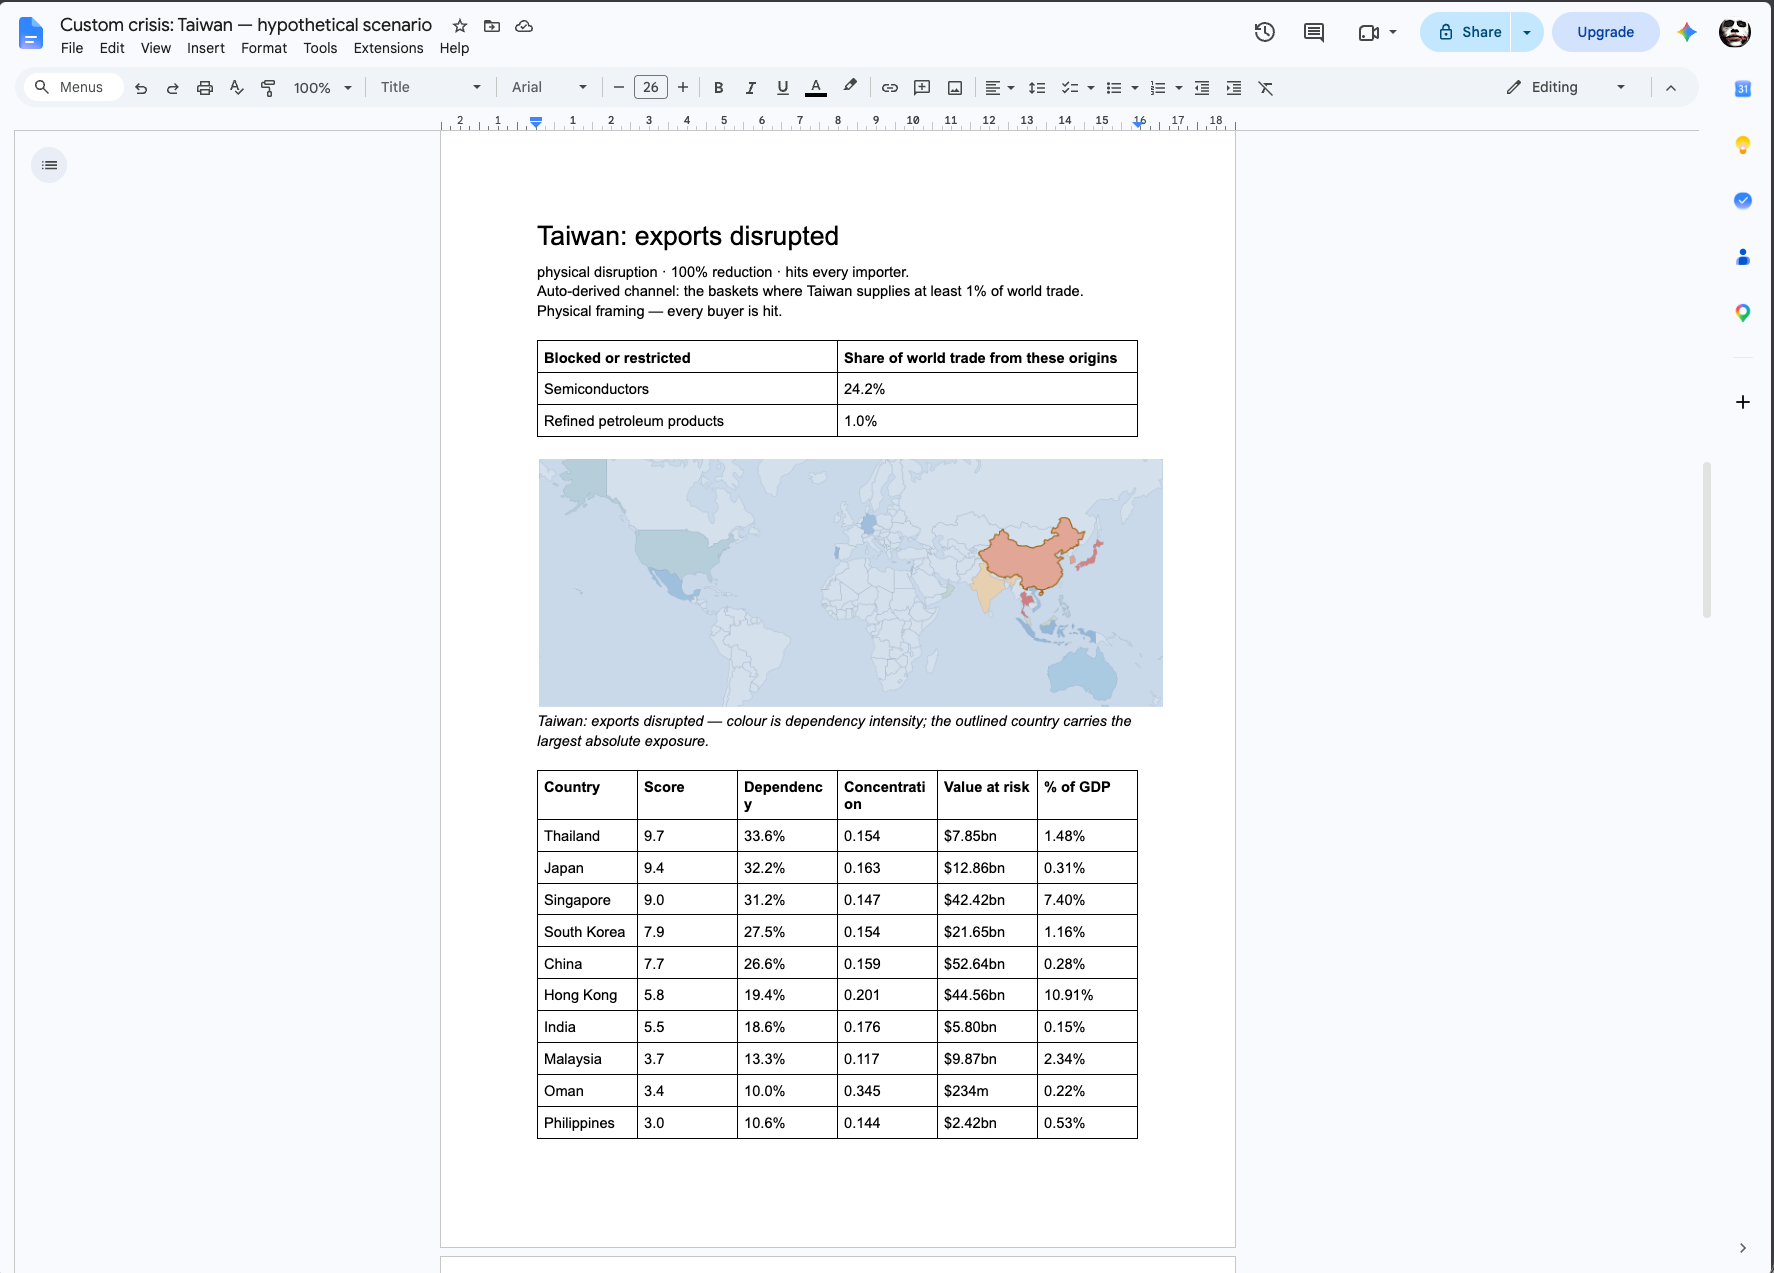
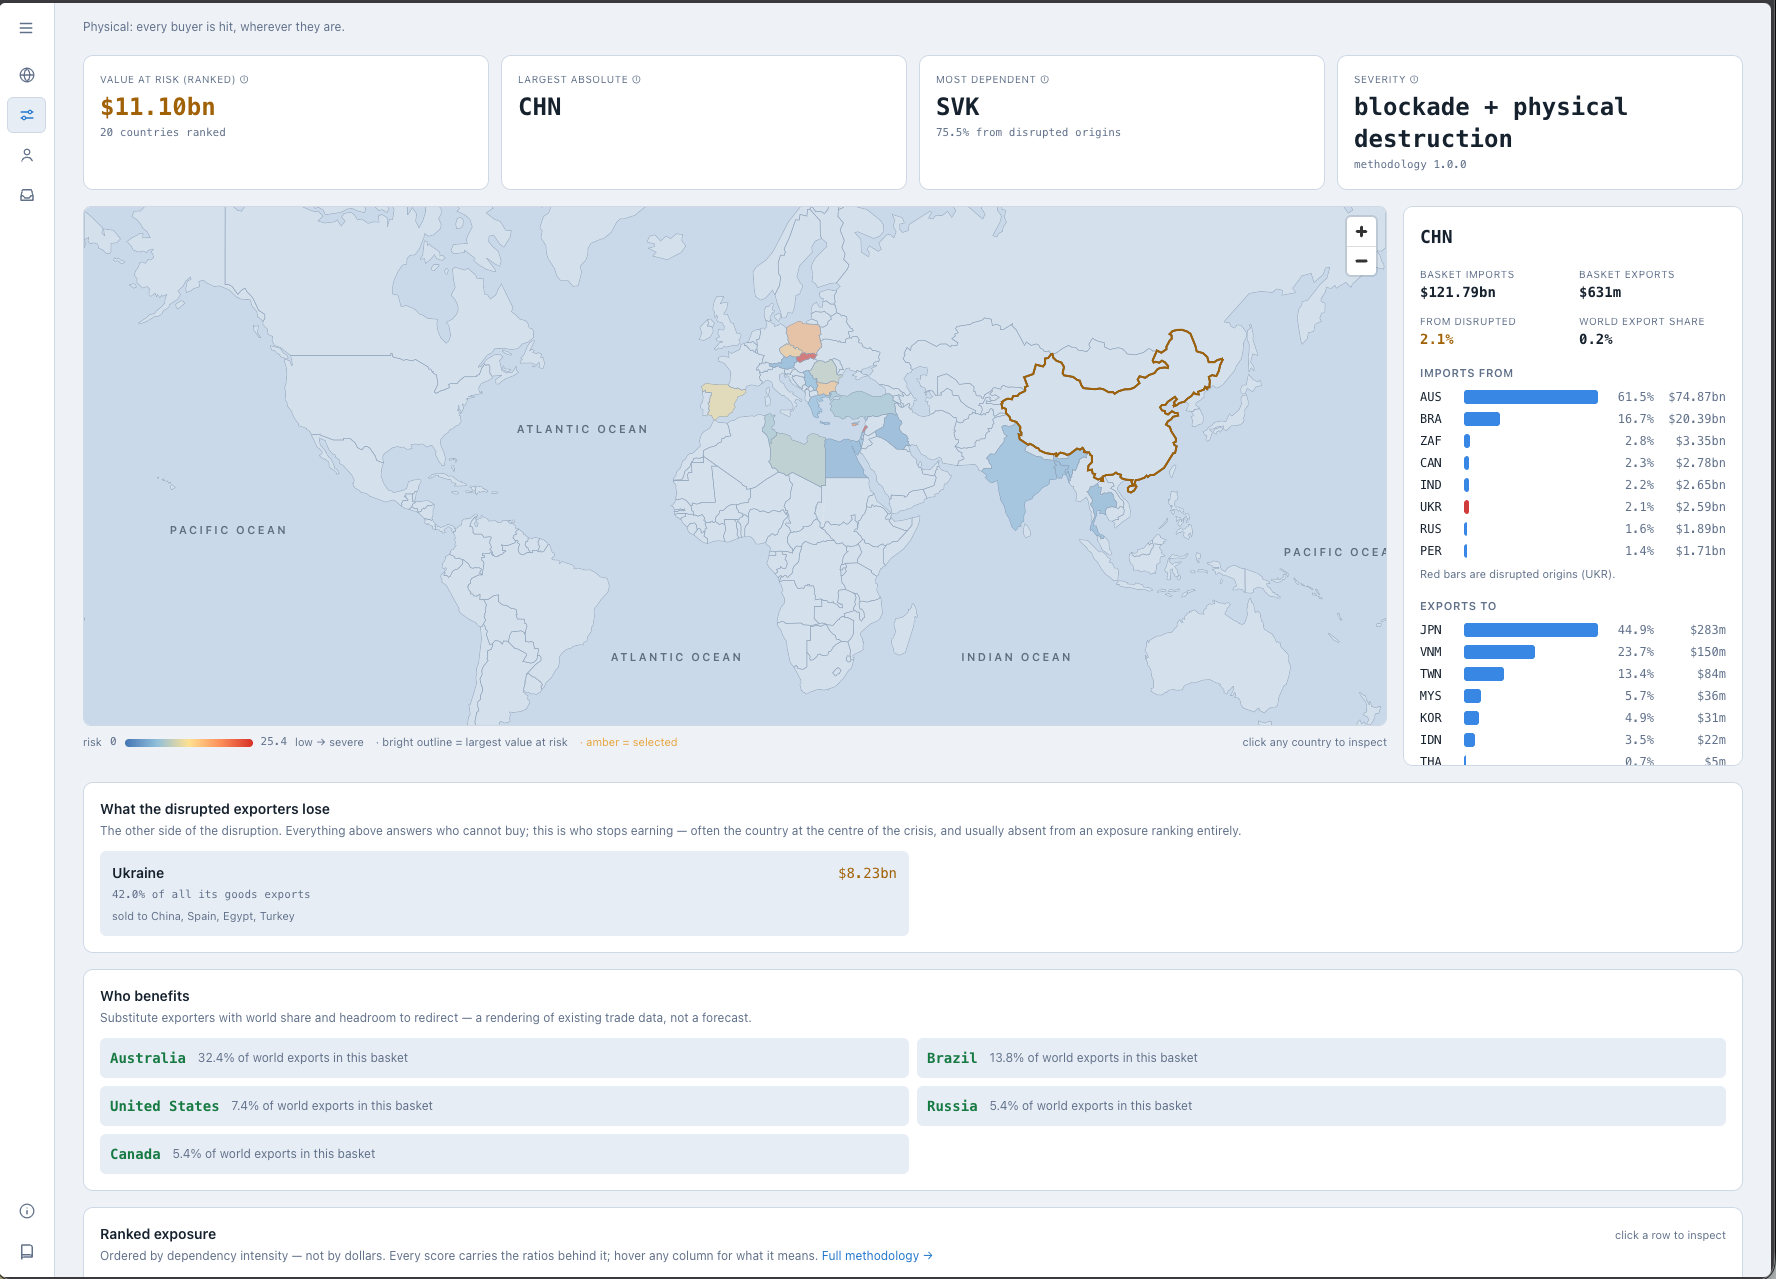
Alongside the reactive desk, an analyst can speculate: pick any of 88 countries and the simulator builds the crisis from the trade data itself — every commodity where that country supplies at least 1% of world trade becomes a disruption channel. The finished read exports as a real Google Doc in your own Drive, with a map per channel, both sides of the disruption, a historical reference class, and a glossary defining every measure.
How we built it
Gemini reasons and routes. A deterministic engine computes. A human approves. The model never generates a number, and that is enforced in three separate ways rather than promised:
- The engine's container image has no
google-genaiin it at all. - Its service account has no Vertex permission.
- A provenance guard checks every numeral in the narrative against the engine's output and rejects the draft if one doesn't appear.
The stack:
- Google ADK with a coordinator and three sub-agents — a transfer between them is the routing decision, and it appears in the trail on every briefing
- Gemini 3.7 Flash on Vertex AI
- Cloud Run ×4 — engine, agent API, an always-on Pub/Sub subscriber, and the UI
- Pub/Sub with a dead-letter topic: five delivery attempts, then the DLQ, with idempotency keyed on a content hash
- Firestore for briefings, analyst profiles and saved scenarios
- DuckDB over Parquet on GCS, mounted as a volume — 11.25M rows scanned in-process, no warehouse to operate
- Next.js 16 + MapLibre GL for the atlas, simulator and review queue
- Google Docs API with the
drive.filescope — it can create documents and cannot read the Drive it writes into - MCP server exposing eight tools over the same engine, so other agents can query it
The data refinery turns raw customs records into 24 curated commodity baskets across 74 HS6 codes, with seven data-quality gates that must pass before an artifact is written. 8 maritime chokepoints are modelled and scored; the other 20 the atlas draws are shown inert, each carrying why it isn't scored yet. 222 tests, including golden-case regressions that encode known history — if a data refresh ever broke the 1973 oil embargo rankings, CI fails.
Challenges we ran into
A rate limit became a permanent failure. Vertex returned 429, the worker nacked, Pub/Sub redelivered immediately, and the retry re-ran the entire agent against quota that was still exhausted. Five attempts in nine minutes, and a perfectly valid signal dead-lettered over a condition that clears itself in about a minute. A rate limit is the model saying not right now, which isn't what a delivery-attempt budget is for — it's now waited out in place without spending an attempt.
Every exported map was a fully transparent PNG. MapLibre 6 reads preserveDrawingBuffer from canvasContextAttributes and ignores a top-level one without warning, so the live context reported false and the drawing buffer was gone by the time we read it. It survived review because our blank-image guard rejected anything under 5KB — and a transparent 1002×518 PNG still compresses to 17KB. The guard and the bug shared a blind spot.
Then the maps were identical. A conflict runs three channels and one picture of one of them would be a lie, so the exporter walks them. But a map paints its base world before the choropleth arrives, and that base is fully opaque — so a visible-pixels check passes happily on a world map with no data on it. Waiting for two identical consecutive frames fixed it.
Documents stopped exporting entirely. The report grew and the Docs API's per-minute write quota ran out: the old exporter appended block by block, reading the document back before each one to find the end index. Composing the whole document first means every character offset is known in advance, so tables and images go in by arithmetic, inserted furthest-first. Six calls instead of forty.
A briefing existed and its page 404'd. The event key is written by the model, and one run reached for the signal's source and filed replay:2021-suez. A leading replay: reads as a URI scheme, so the URL resolved to nothing whether the colon was encoded or not. Ids are slugified now.
Accomplishments that we're proud of
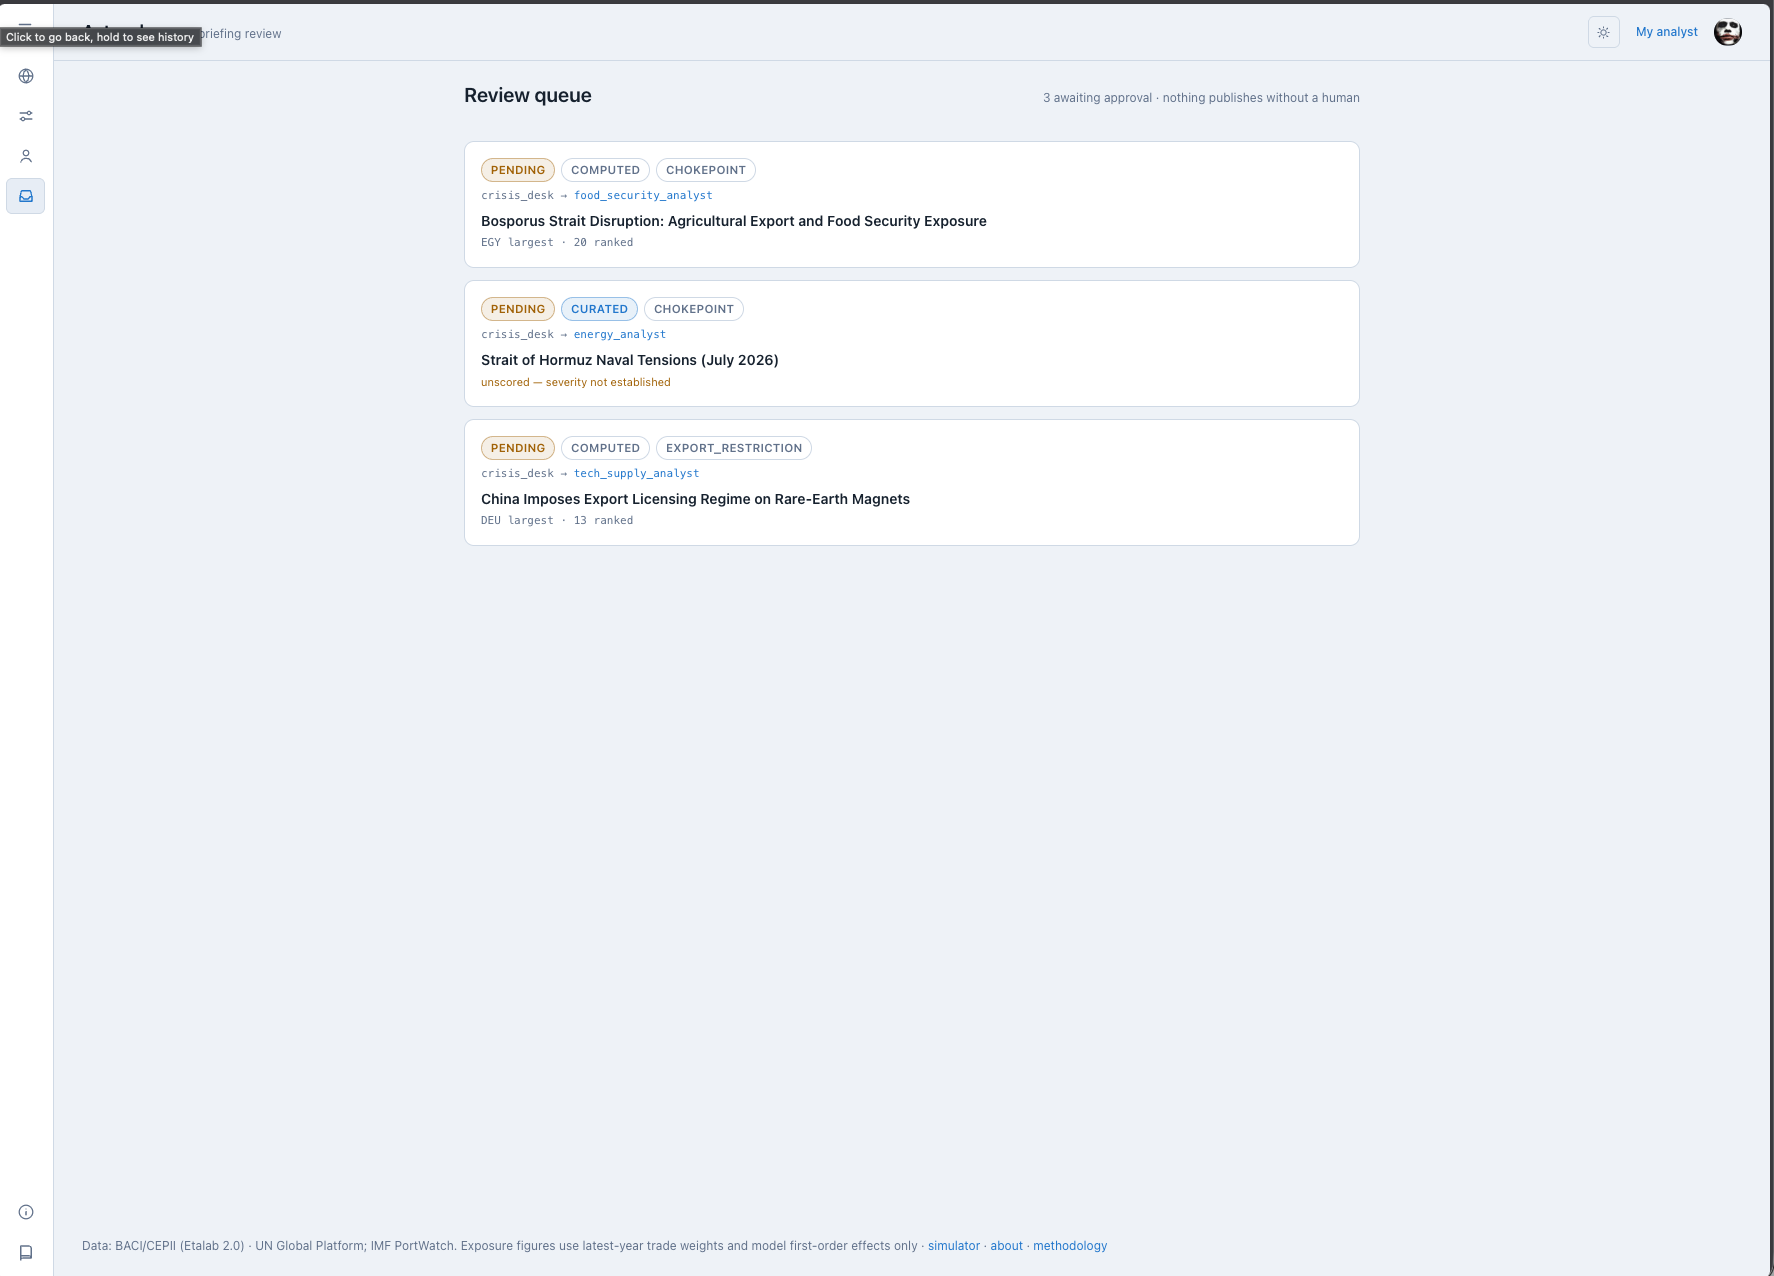
The agent refuses. Fetching vessel transits for the Strait of Hormuz, it found a baseline of 13.4/day against a long-run 90/day — either the reference period was already disrupted or the AIS feed is degraded, which is a documented problem there. So it filed the briefing unscored, quoted the reason verbatim, said what would change its mind, and escalated to a human. That briefing sits in the queue beside three scored ones, and it was produced by the live pipeline, not staged. Anyone can build an agent that always answers.
It disagrees with its own input. The Suez headline said the canal was blocked. PortWatch said transits fell 17%. The briefing says 17% and calls it a delay shock rather than a supply cutoff.
Both lenses at once. Run a Taiwan crisis and China loses the most money — $52.6bn — but only a quarter of its supply comes from Taiwan, while Thailand loses a seventh of that and a third of its supply. One is a bigger number; the other is a bigger problem. Reading only one column files a misleading report.
Reproducible, not remembered. A saved scenario stores the question, not the answer. Reopening it replays on the live engine against current data.
What we learned
Disclaimers rot faster than code. Three separate stated limits turned out to claim the model couldn't see something it had started seeing. After splitting pipeline gas into its own basket, the custom-scenario disclaimer still read "no pipeline flows" — directly above a channel showing pipeline gas at 13.4% of world trade. A product whose credibility rests on stating its limits has to test those statements like any other output.
Naming is load-bearing. A briefing tagged CURATED was read as "incomplete, needs a human to fill it in" — when it means the desk declined to publish a figure it couldn't defend. Nothing in the app defined the word until we noticed people asking.
The categories hide things. Pipeline gas was sitting inside a basket labelled "LPG", where at $157.7bn it was 61% of that basket by value. Every LPG exposure figure was mostly pipeline gas under a name that hid it. Splitting it out let the engine answer a question it could never have answered before: cut Russian pipeline gas and Slovakia shows 98.3% dependency, Hungary 65.2%.
A record can be perfect and the page still unreachable. The 404 above taught us that "it's in the database" and "a user can get to it" are different claims, and only one of them is worth anything.
What's next for Autonaly
Second-order effects. Today the engine models first-order exposure only — who buys directly from the disrupted origin. The chains that actually bite (neon → fabs → cars) need input-output tables layered onto the trade graph.
Absorption, not just exposure. Dependency says who is hit; it says nothing about who can take it. Reserves, fiscal room and substitution capacity would turn an exposure ranking into a vulnerability ranking.
Criticality where value fails. Neon is the honest gap. World trade in its HS6 code is $3.49bn and Ukraine's recorded share is about $2m — a value-weighted model can never rank it, no matter how finely we resolve the code. That needs a criticality axis sourced outside customs data, and a way to say so without pretending it's engine-verified.
Team desks. Shared watchlists and annotations, so a firm's analysts read the same event against one agreed set of interests.
More of the map. 20 of the 28 straits we draw are still unscored, each for a stated reason. Every one of them is a routing table entry and a defensible bypass assumption away from being modelled.
Built With
- duckdb
- fastapi
- firestore
- gemini
- google-adk
- google-cloud
- google-cloud-pubsub
- google-cloud-run
- google-docs-api
- google-drive-api
- mcp
- next.js
- parquet
- pydantic
- python
- typescript
- vertex-ai

Log in or sign up for Devpost to join the conversation.