--Code--
Inspiration
The aesthetic of geographic visualization and how we could make raw data more presentable and readable.
What it does
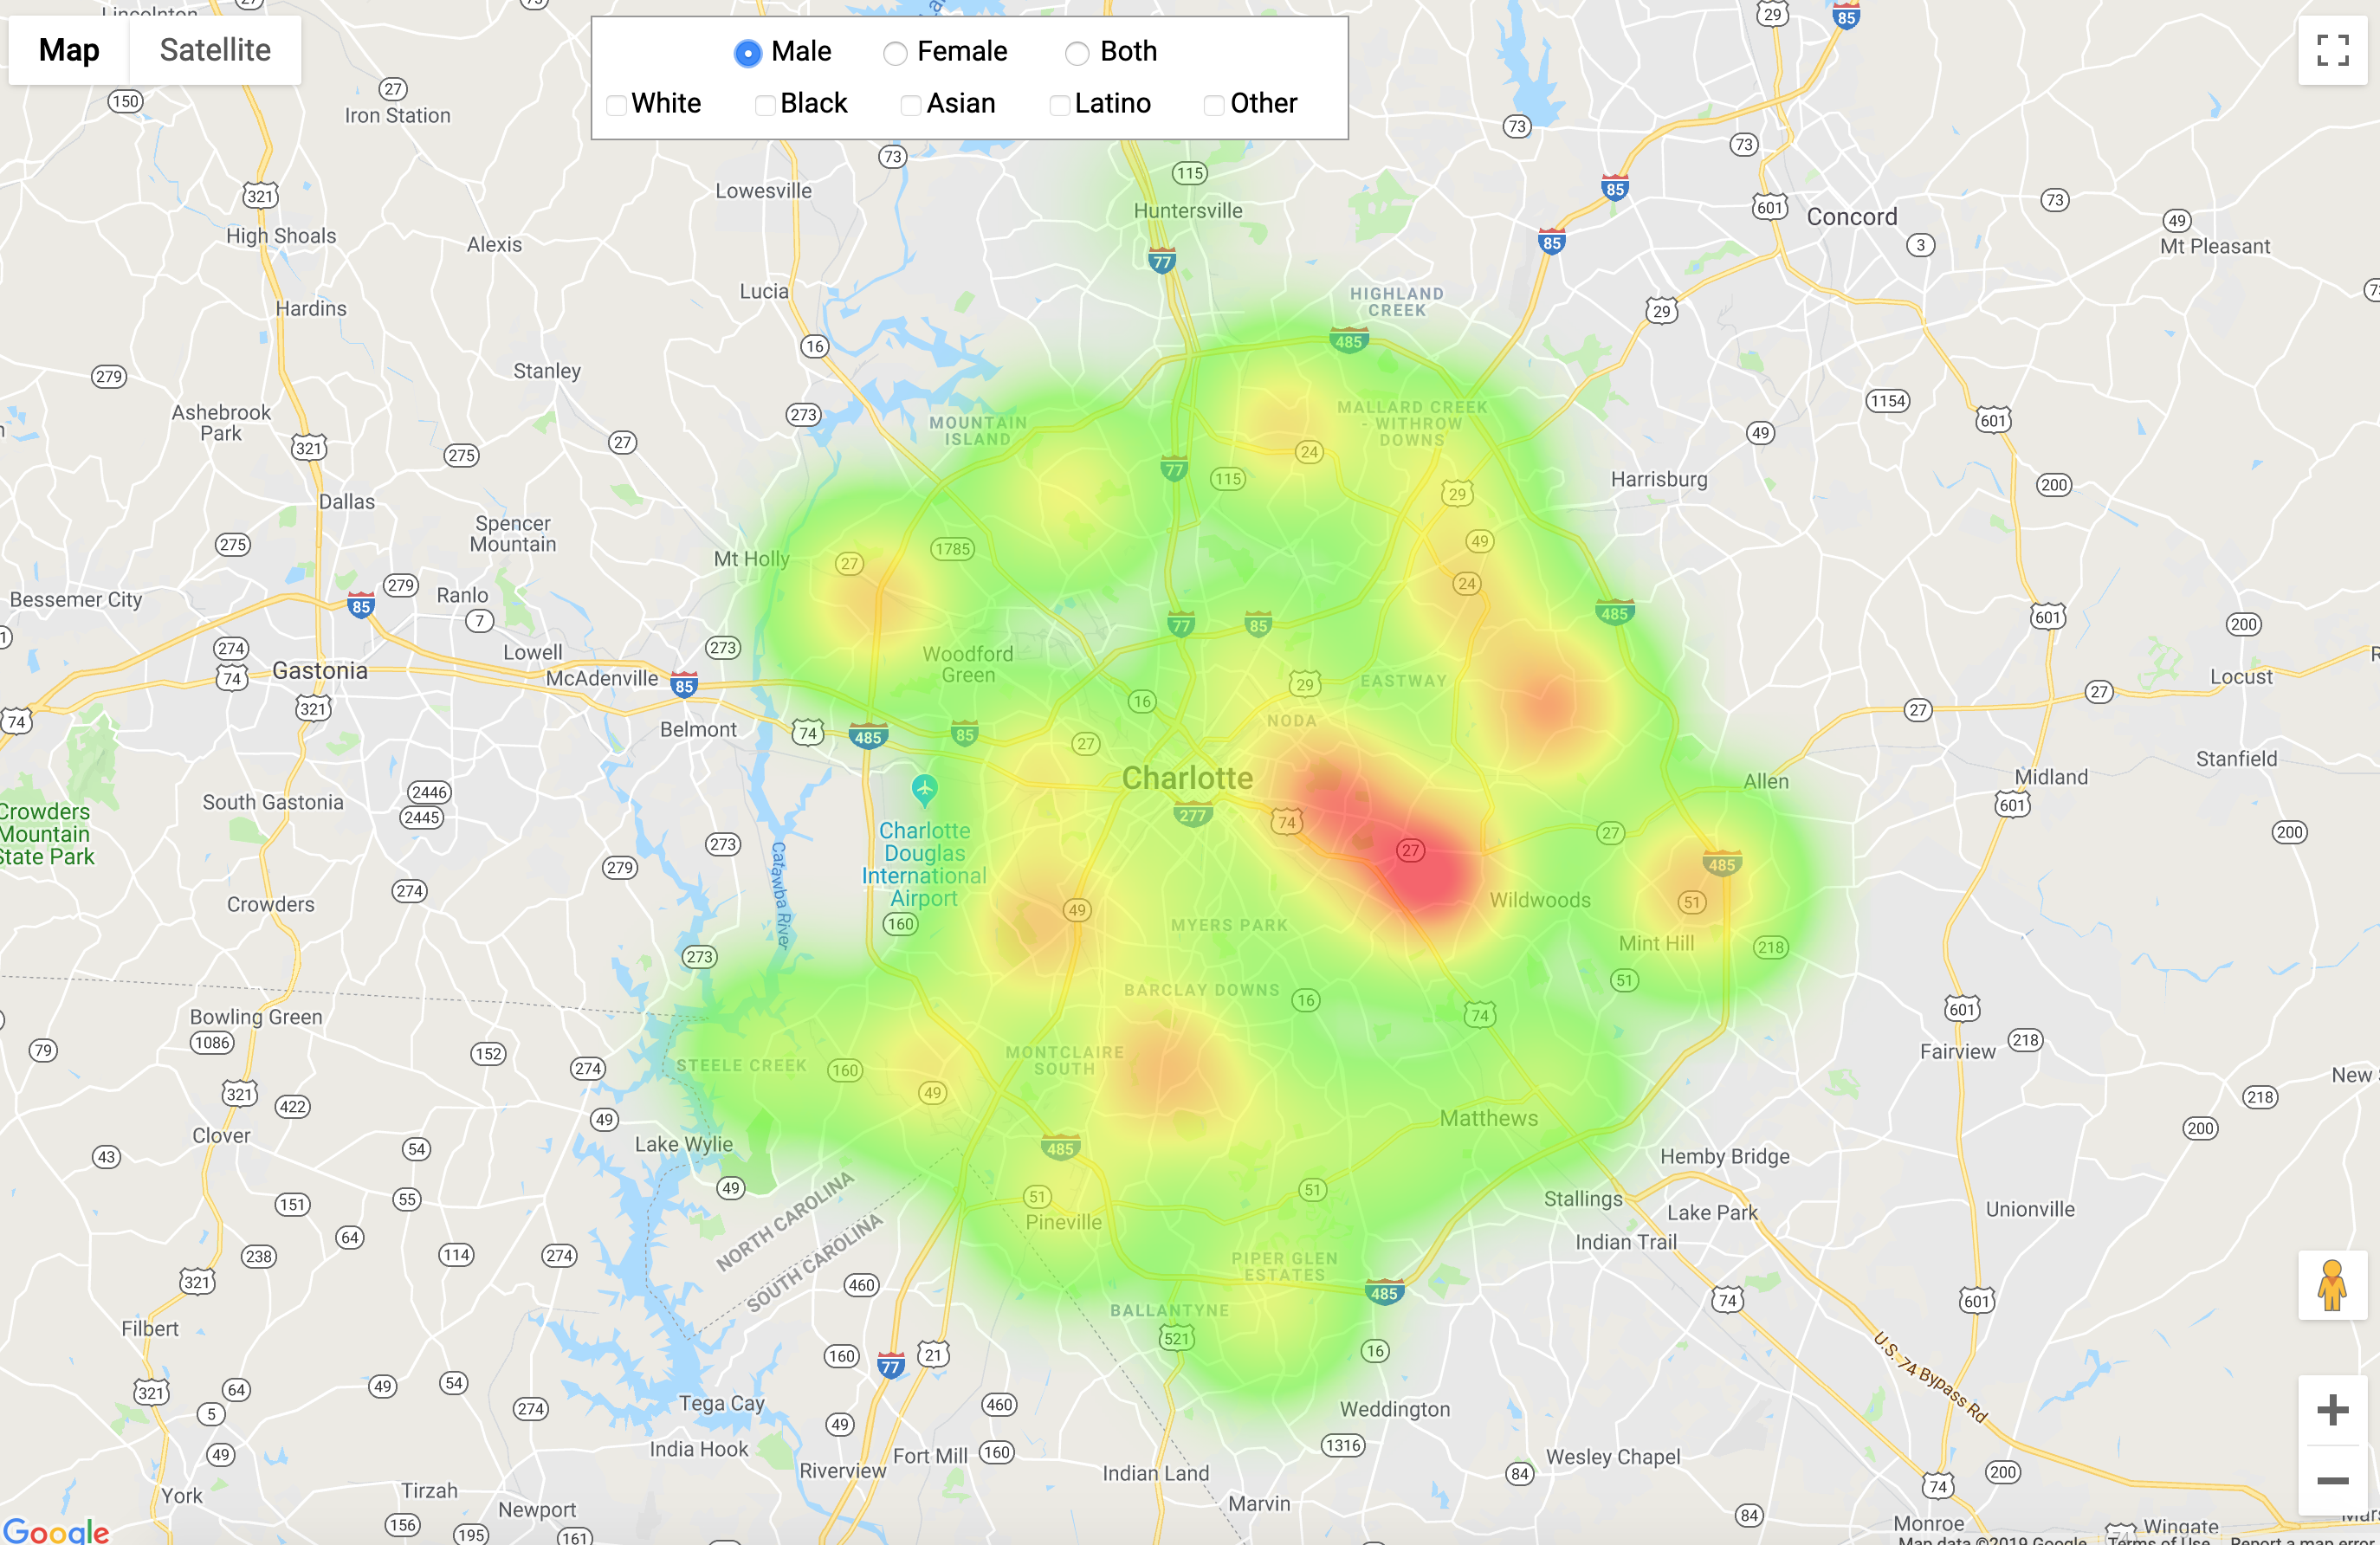
It creates a geographic visualization of where MedLink is the most active. This is accomplished through normalizing encounter data reported by two of the participating organizations.
How I built it
The project was built with a Rust background and the front end as javaScript running with google maps API.
Challenges I ran into
Finding data that complimented our design choices for the map visuals.
Accomplishments that I'm proud of
The successful implementation of the API and the scalability of the project for future use.
What I learned
We learned how to parse csv data and the benefits of computer science in our community.
What's next
Expanding the functionality to more accurately represent health care coverage.

Log in or sign up for Devpost to join the conversation.