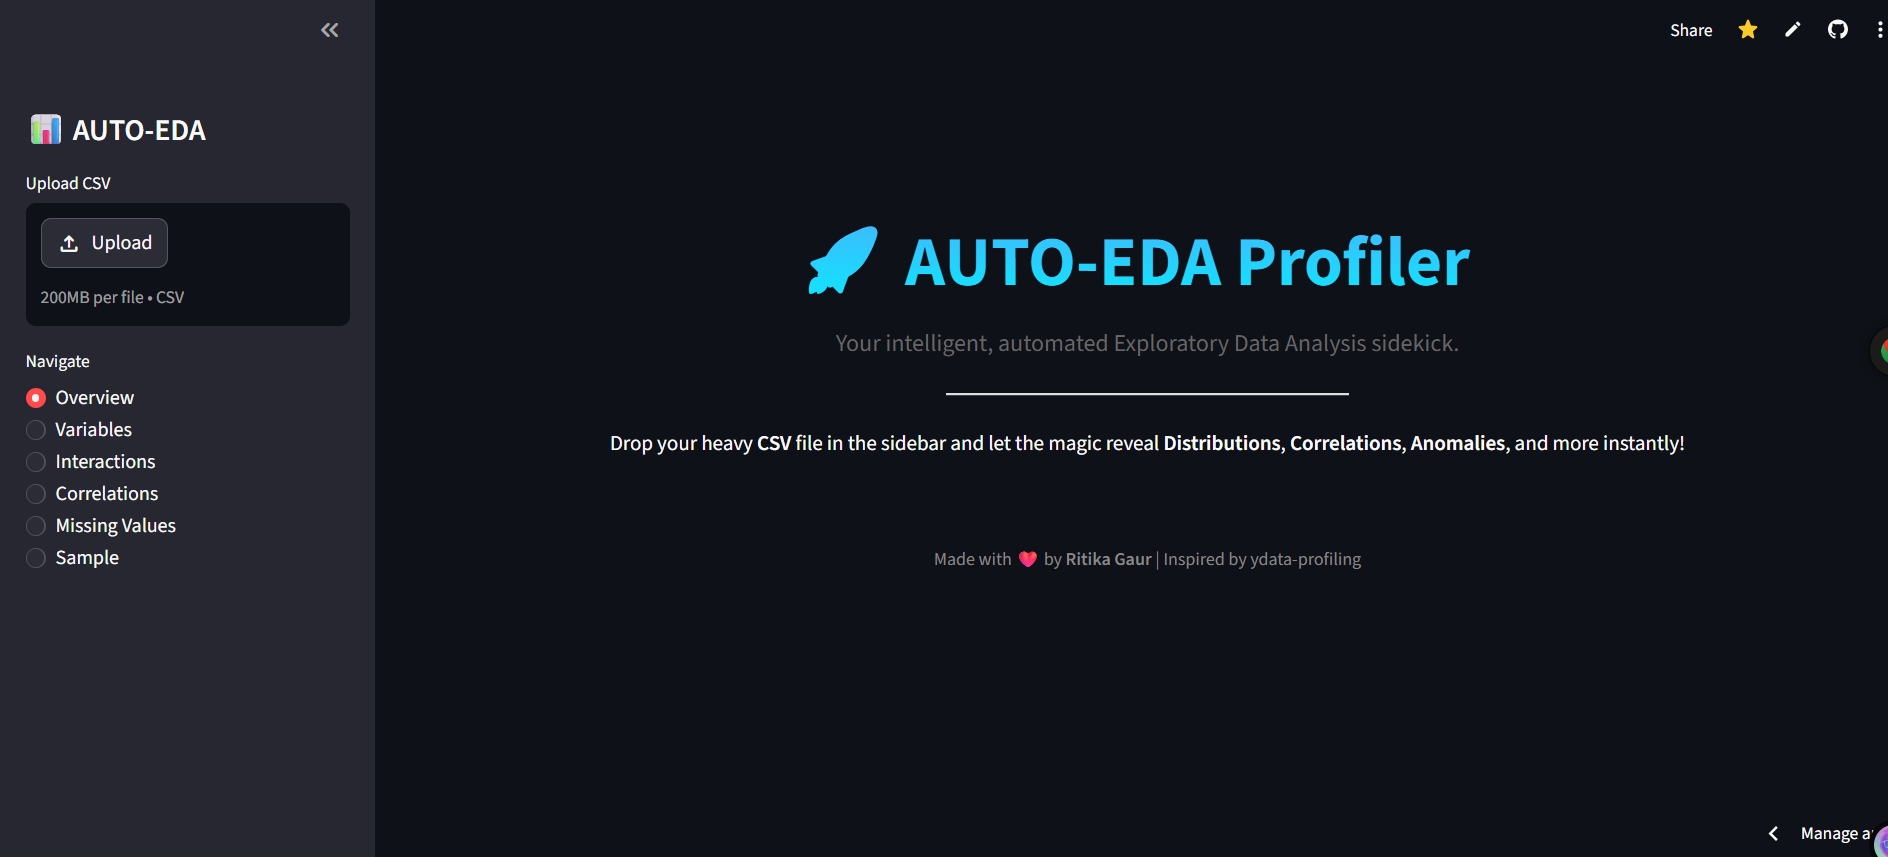
AUTOMATIC EDA is a blazing-fast dashboard built entirely in Python. It's designed to replicate and modernize the core functionality of tools like ydata-profiling inside a sleek, intuitive Streamlit web interface.
The complete workflow covers:
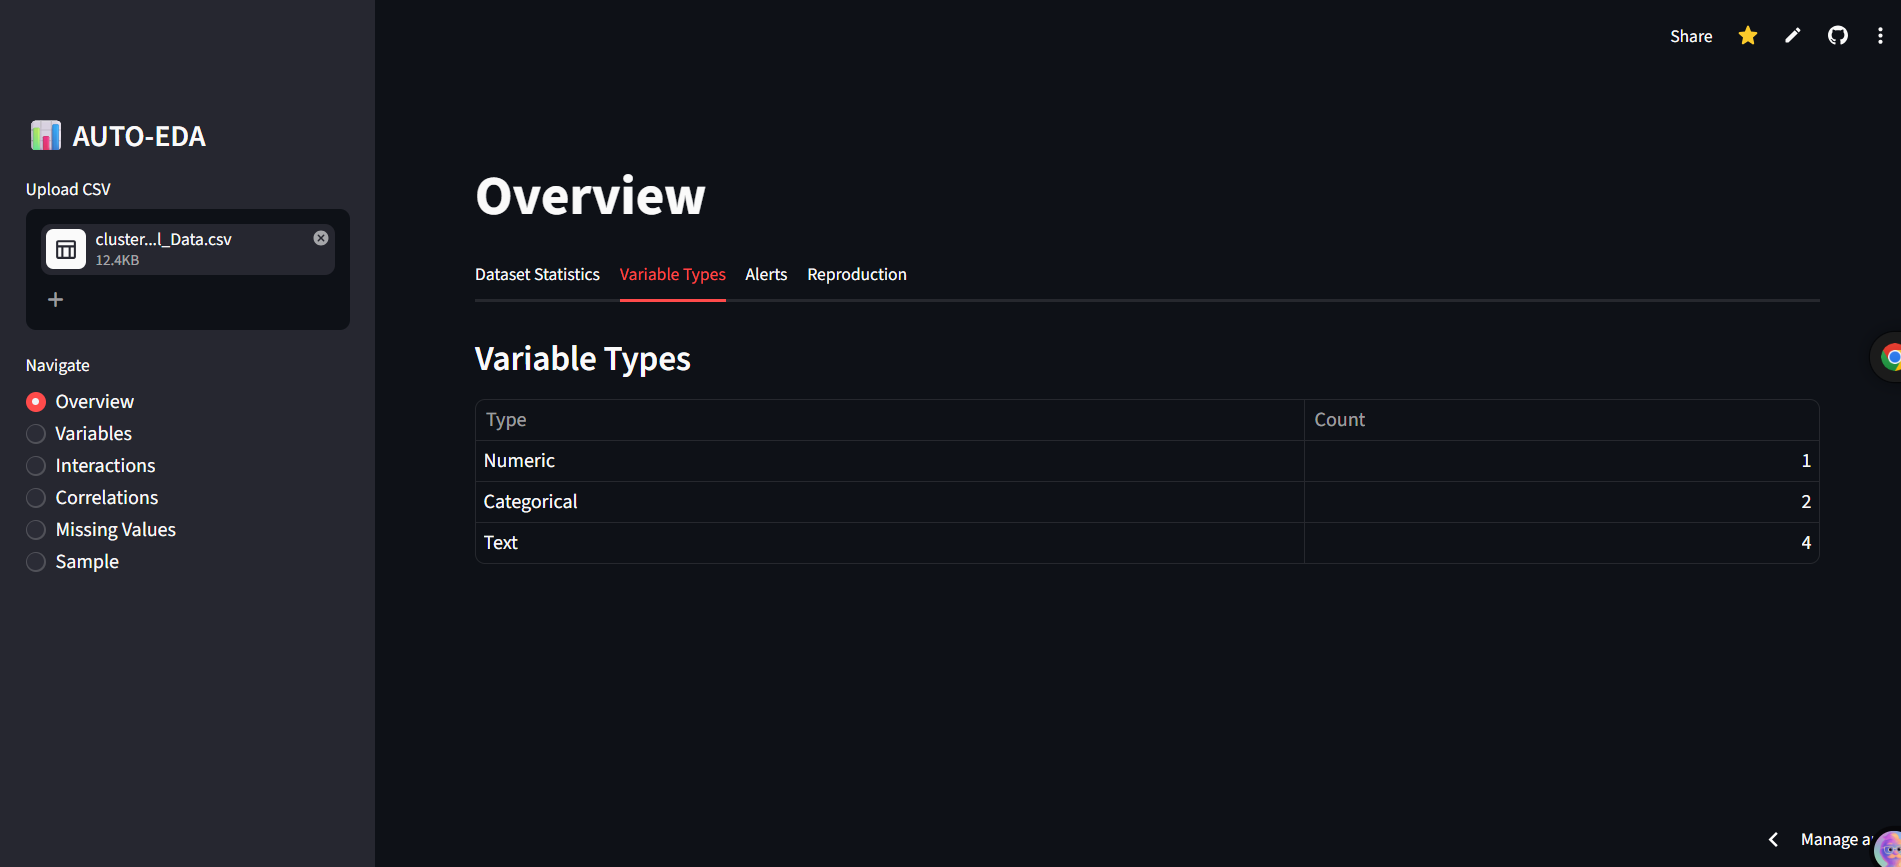
- Automatic Column Type Detection
- Deep Statistical Profiling
- Interactive Correlation Analysis
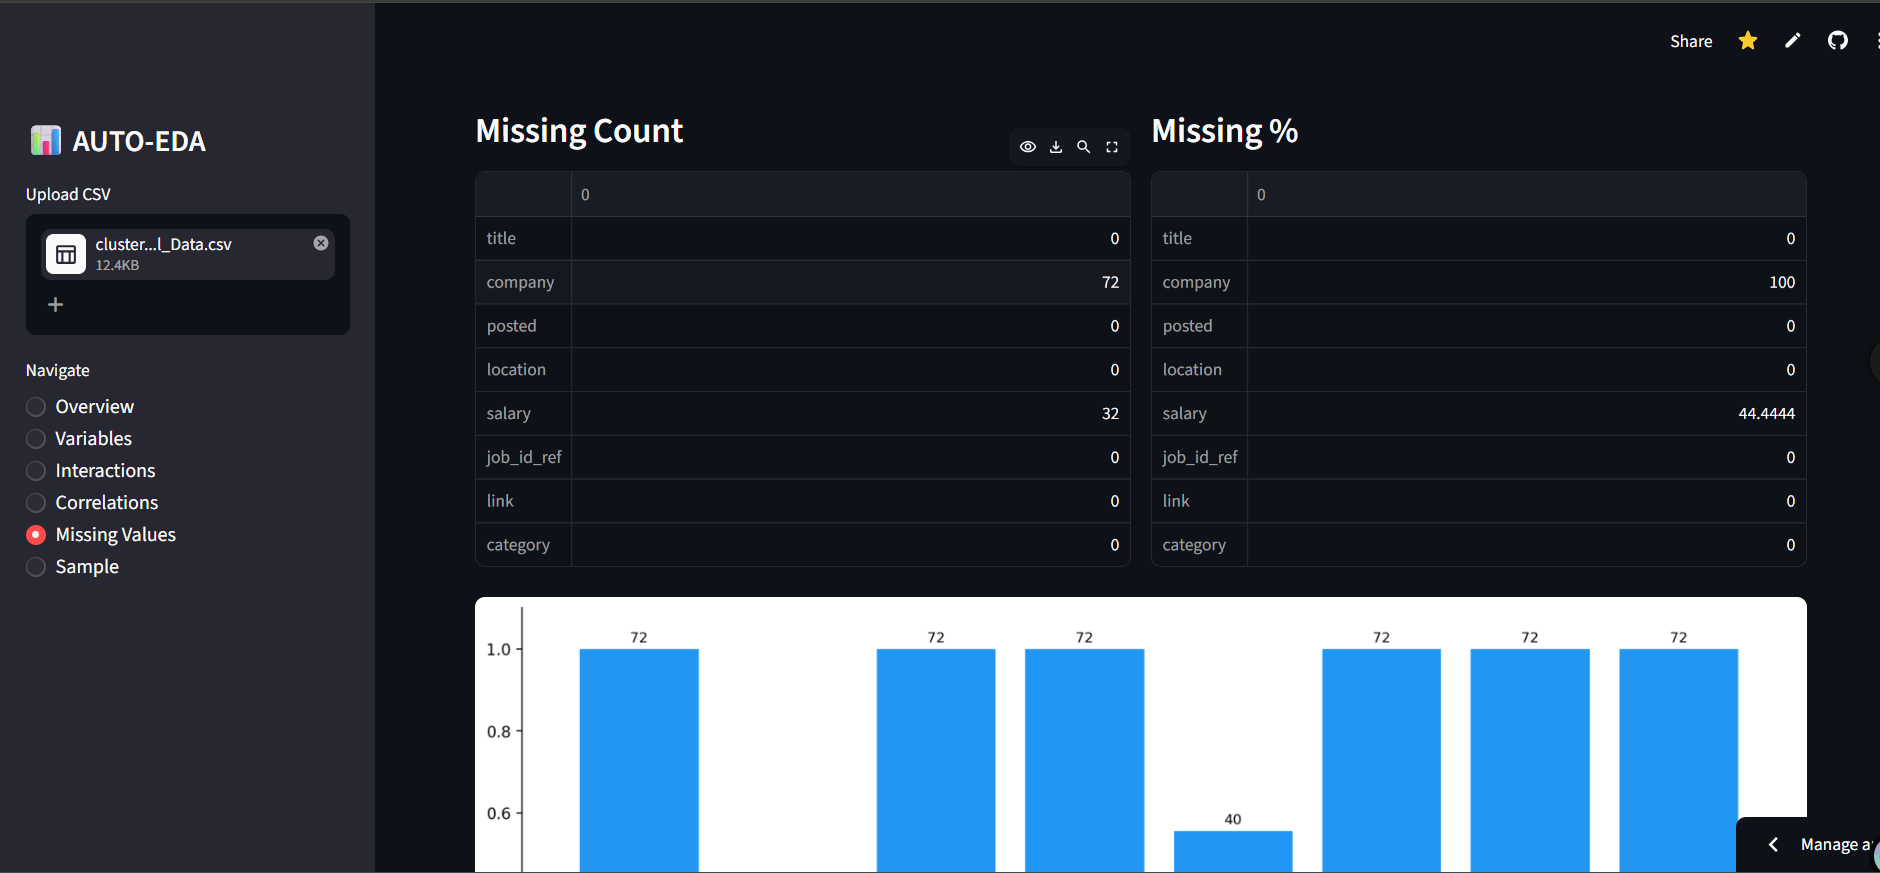
- Missing Value Detection All without writing a single line of Python code!
Analytical Features Feature Description
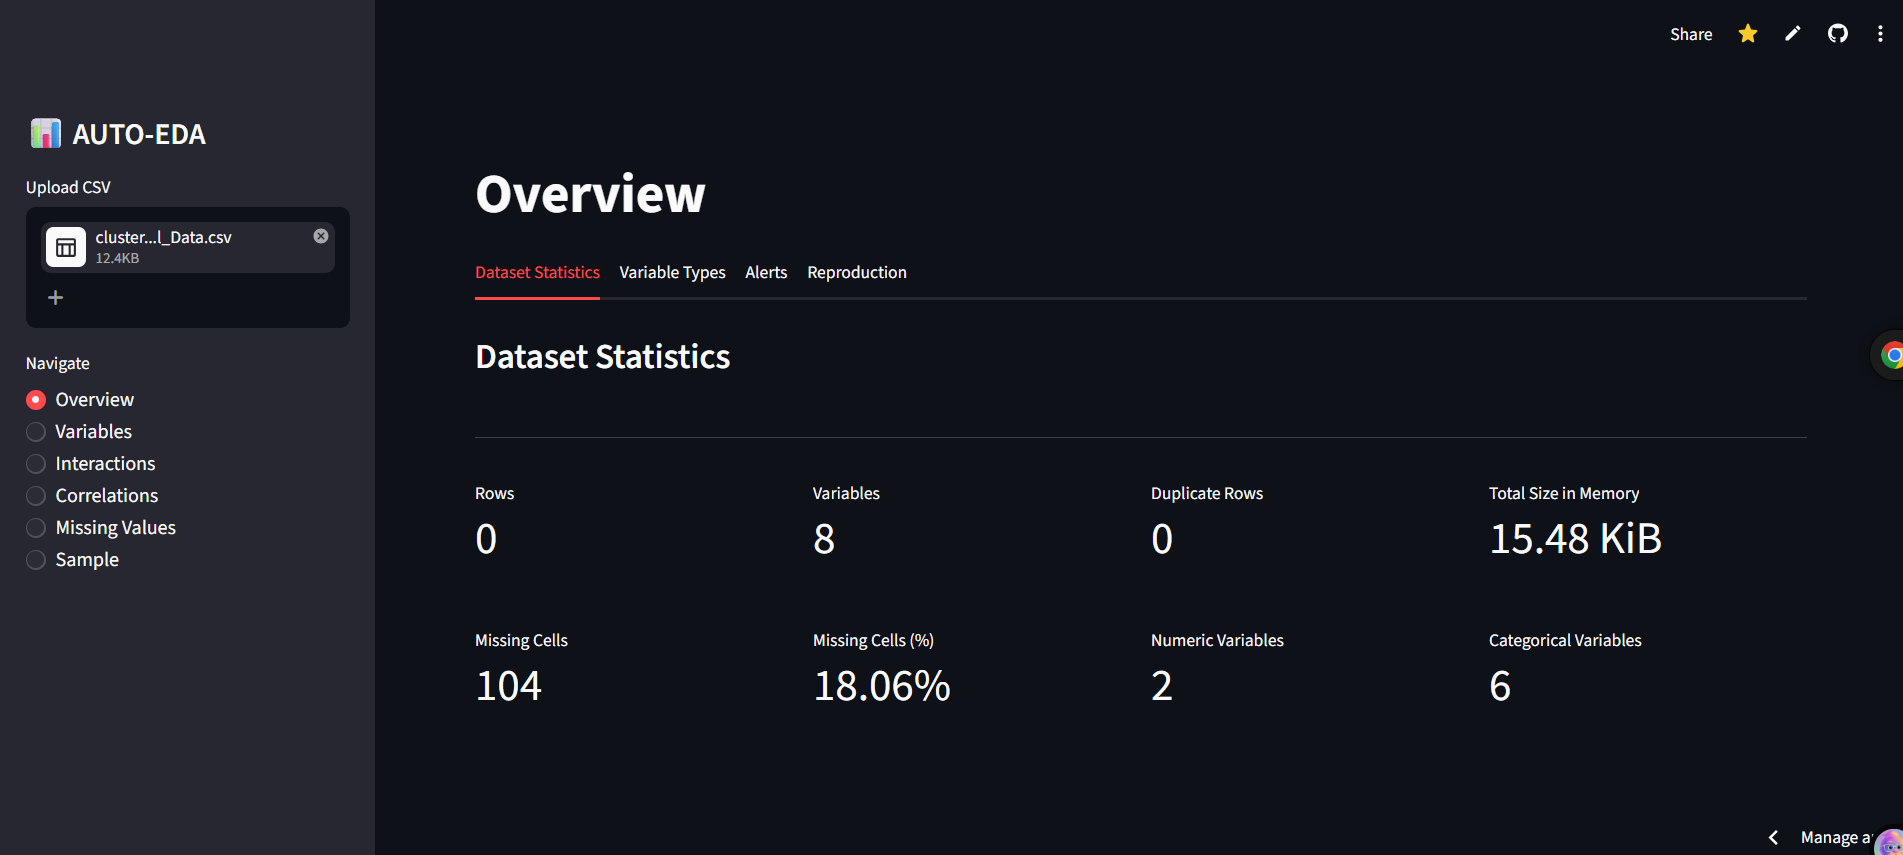
- Overview Room Bird's-eye view of your dataset. See rows, variables, duplicate row counts, and memory size at a glance.
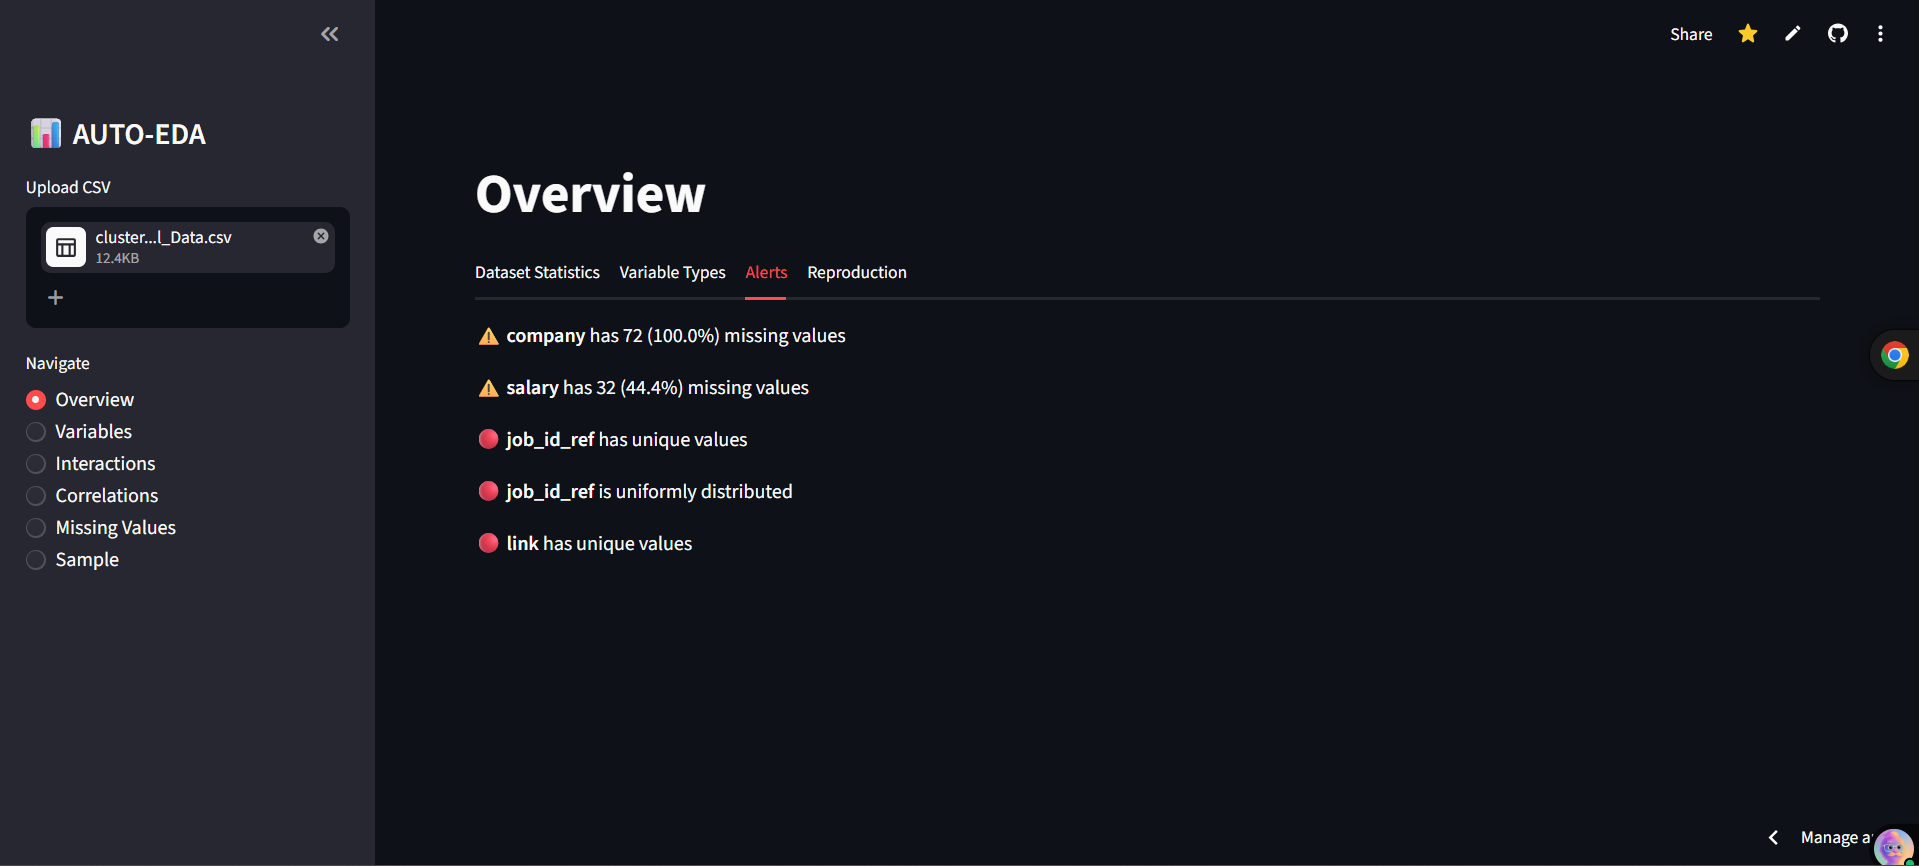
- Smart Alerts Automatically flags missing values, uniform columns, all-zero columns, and highly correlated variables (Threshold > 0.5).
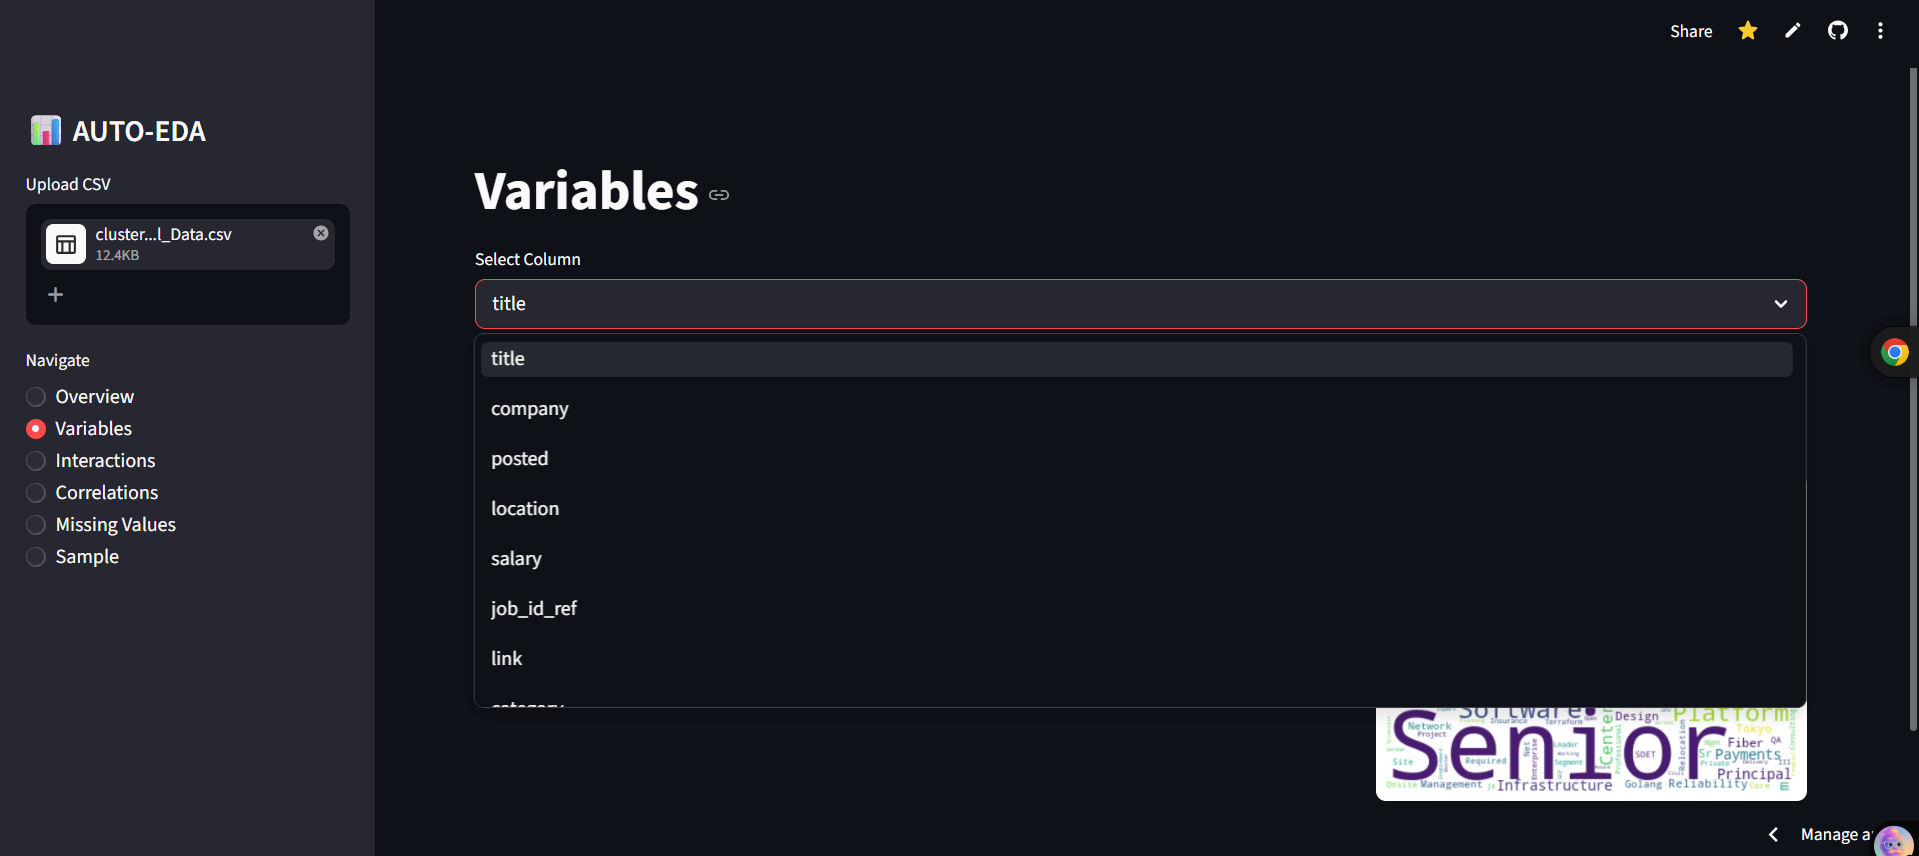
- Variable Profiling Per-column detailed dive. Generates histograms for numerics, bar charts for categorical formats, and word clouds for text data.
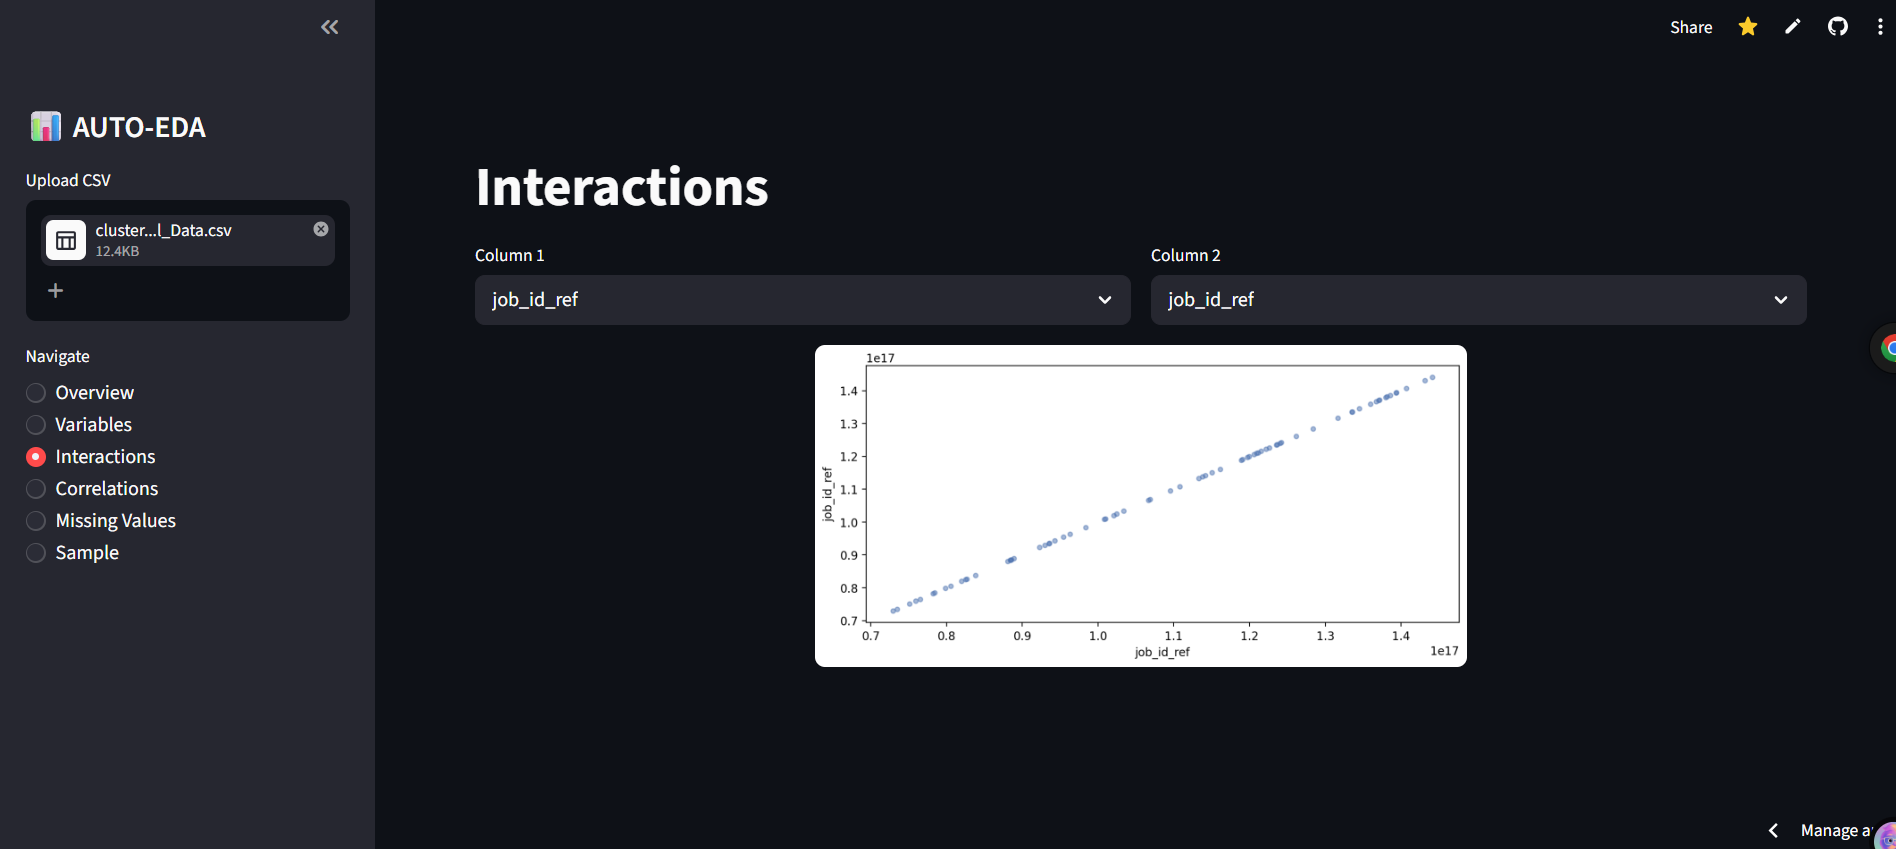
- Interactions Dynamic Scatter plot interface to visually inspect the relationship between any two numerical features.
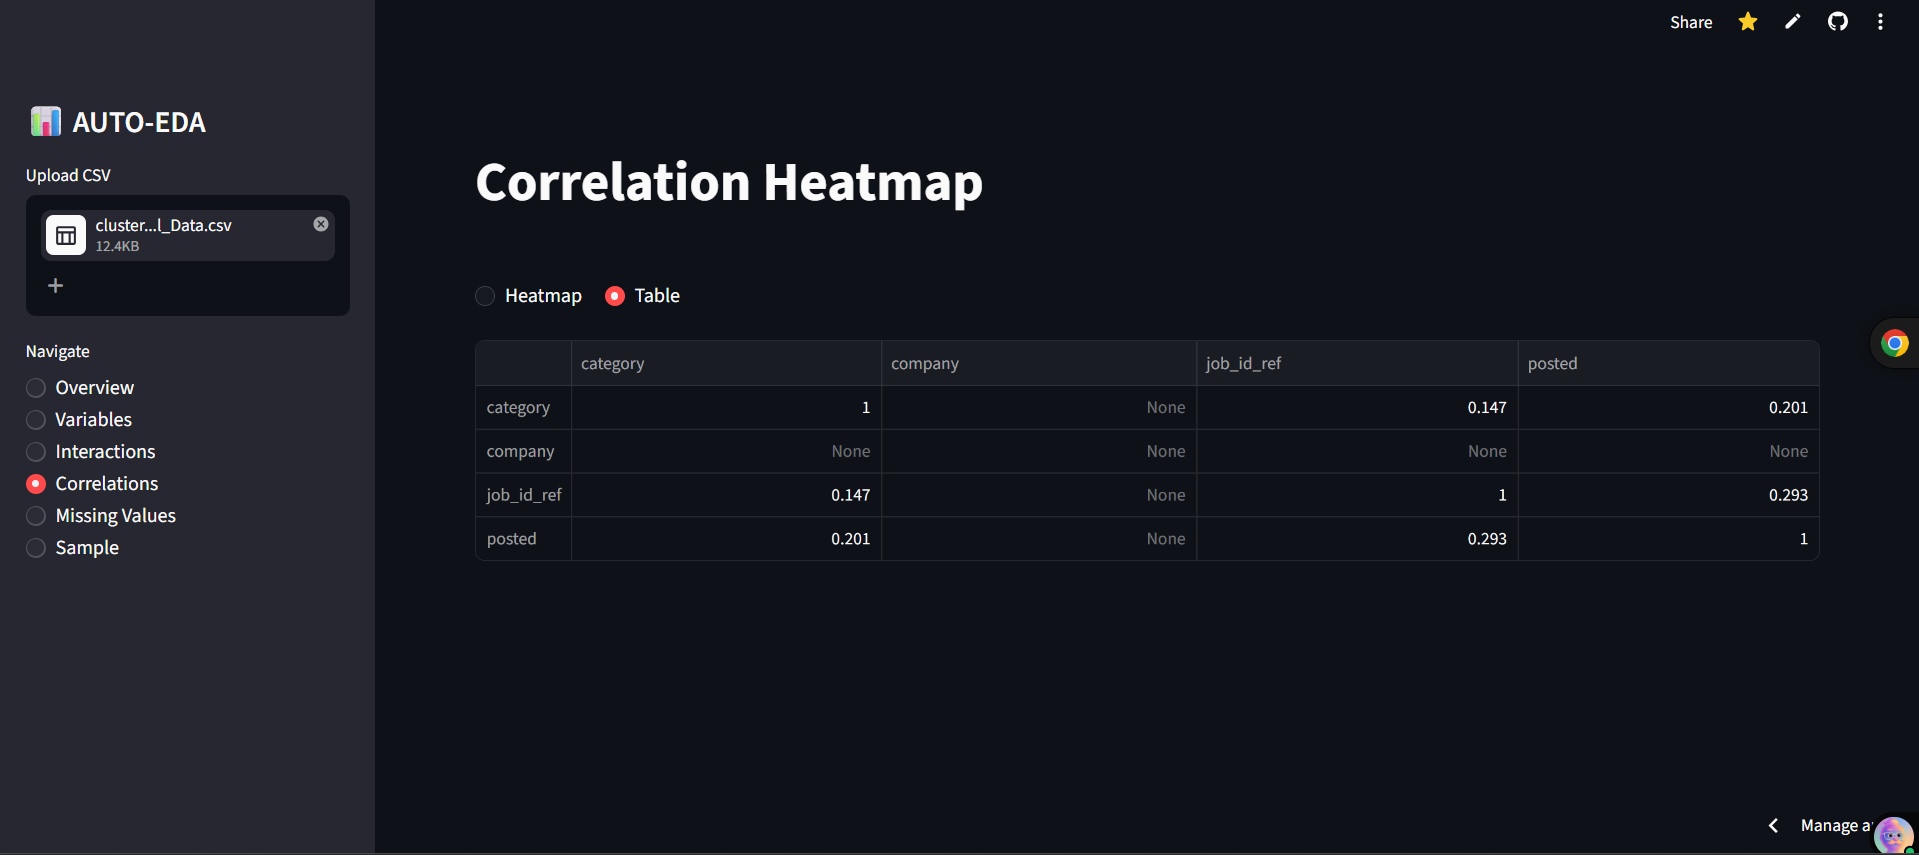
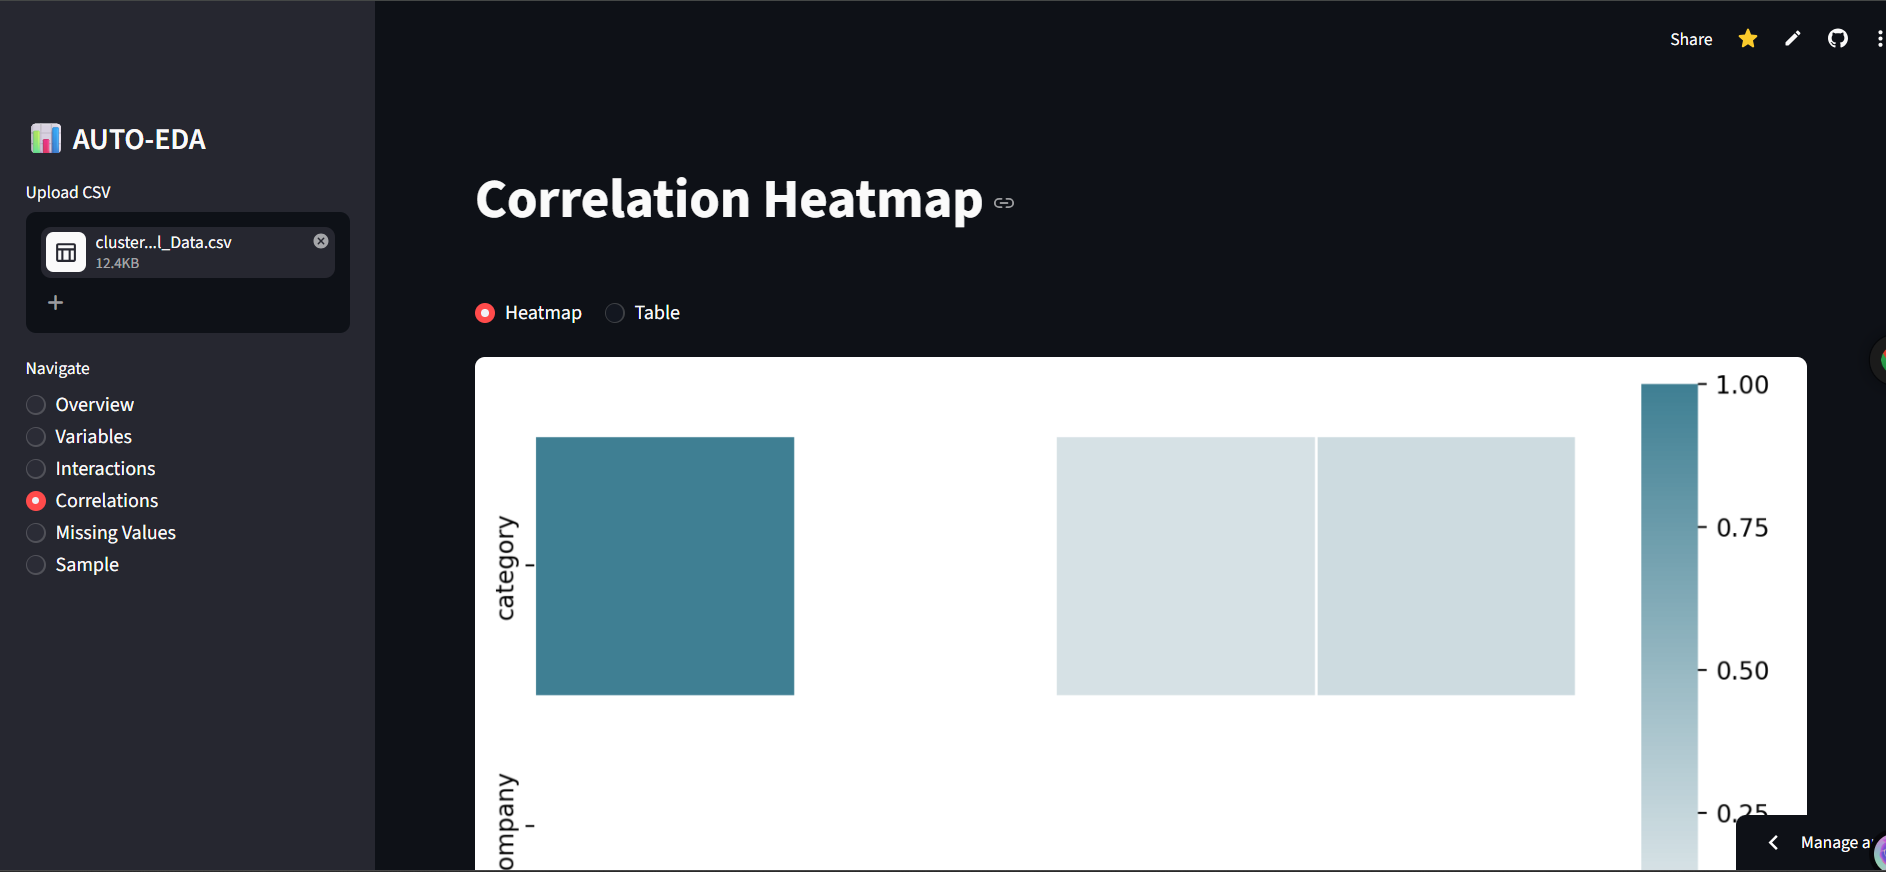
- Correlations Auto-encodes categorical data safely to render beautiful, fully-readable Heatmaps and Correlation tables.
- Missing Values Comprehensive missing data viz via Count Bar Charts, Nullity Matrices, and Nullity Heatmaps using the missingno library. Workflow Architecture
Quickstart Guide
- Requirements Before running the app locally, ensure you have Python 3.8+ deployed on your system.
Clone this repository git clone https://github.com/GaurRitika/automatic_eda_platform
Install the dependencies
pip install -r requirements.txt
- Run the App # Start your local Streamlit server streamlit run app.py
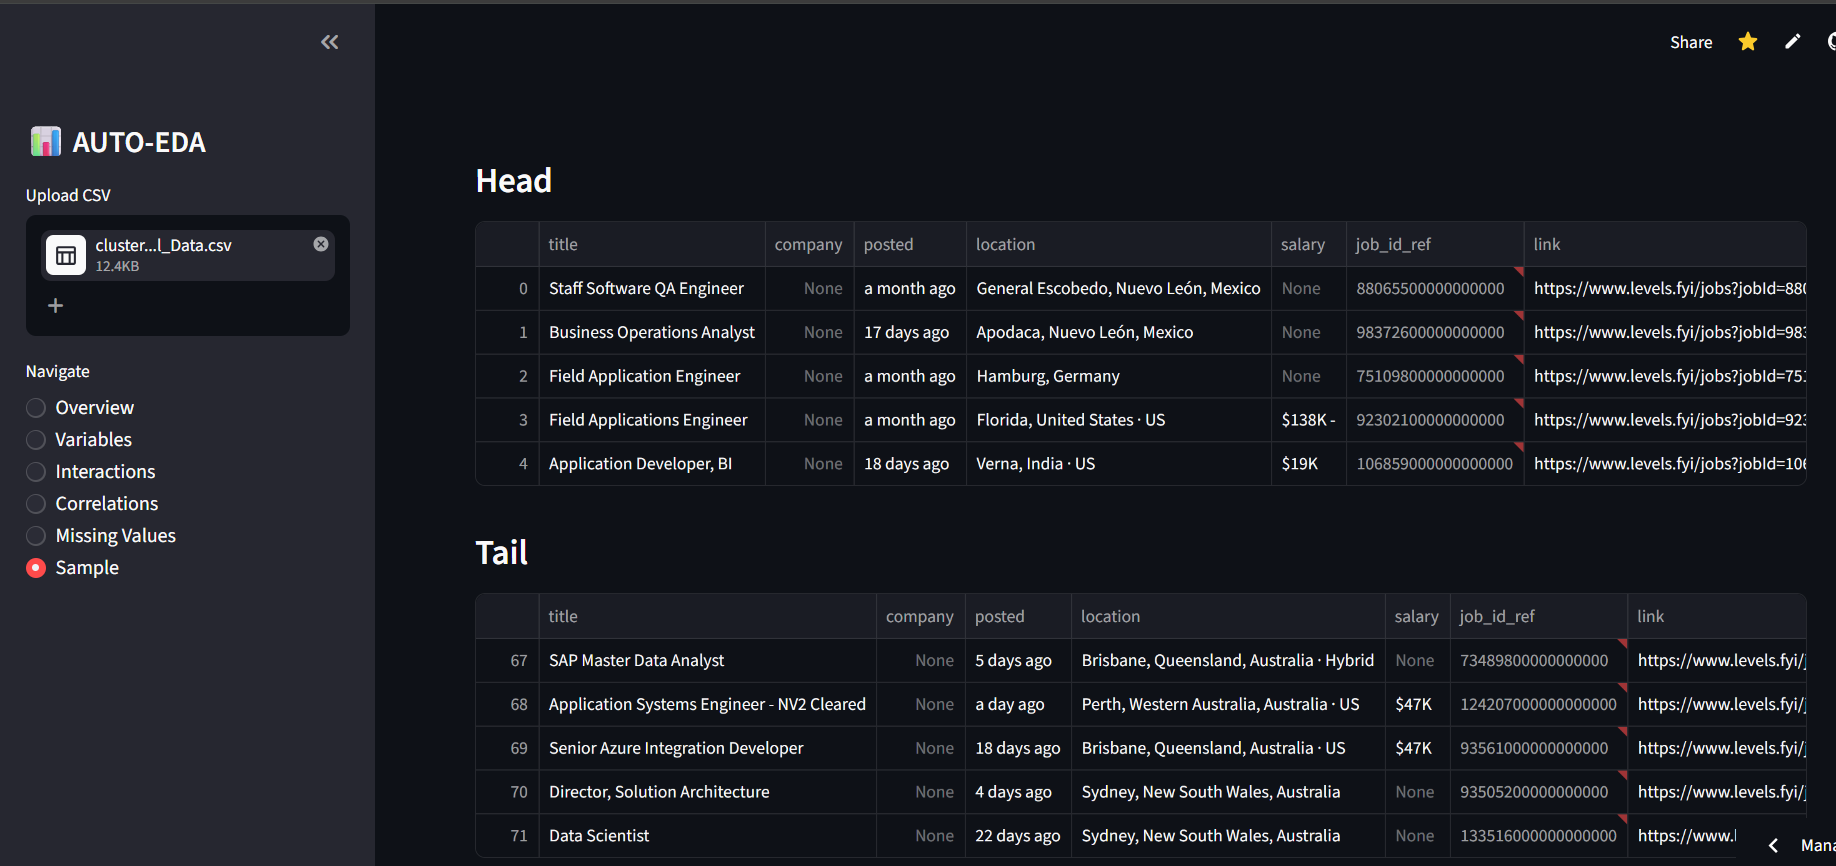
- Usage Upload Dataset: Drag and drop any tabular .csv file into the sidebar. Navigate: Use the sidebar radio buttons to switch between Views. Analyze: Let the interface compute everything from memory usage to data outliers in real-time.
Built With
- python
- streamlit


Log in or sign up for Devpost to join the conversation.