-
-

Aurora prediction component
-

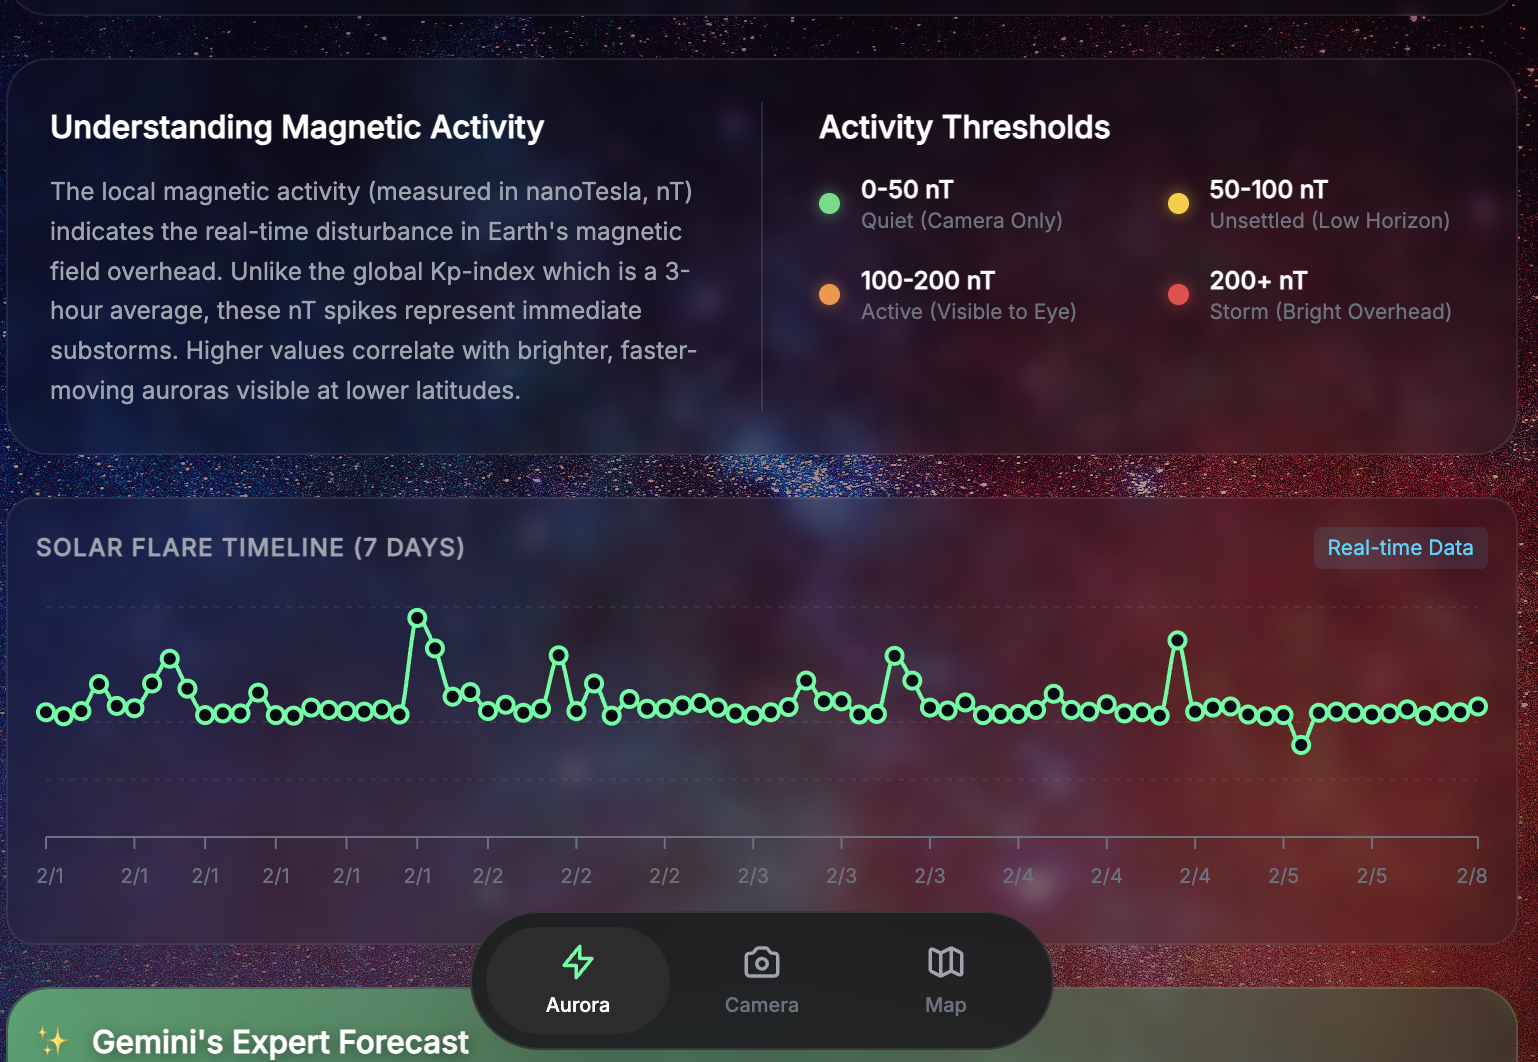
Data Translation of Magnetic Activity
-
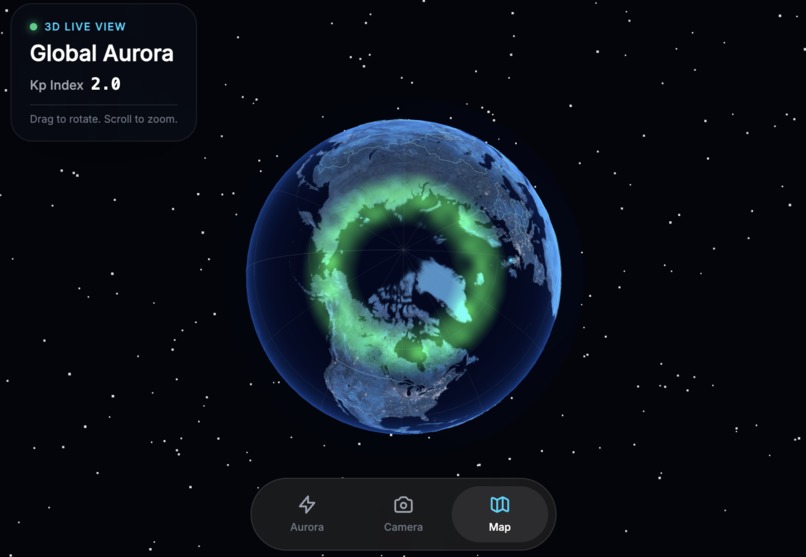
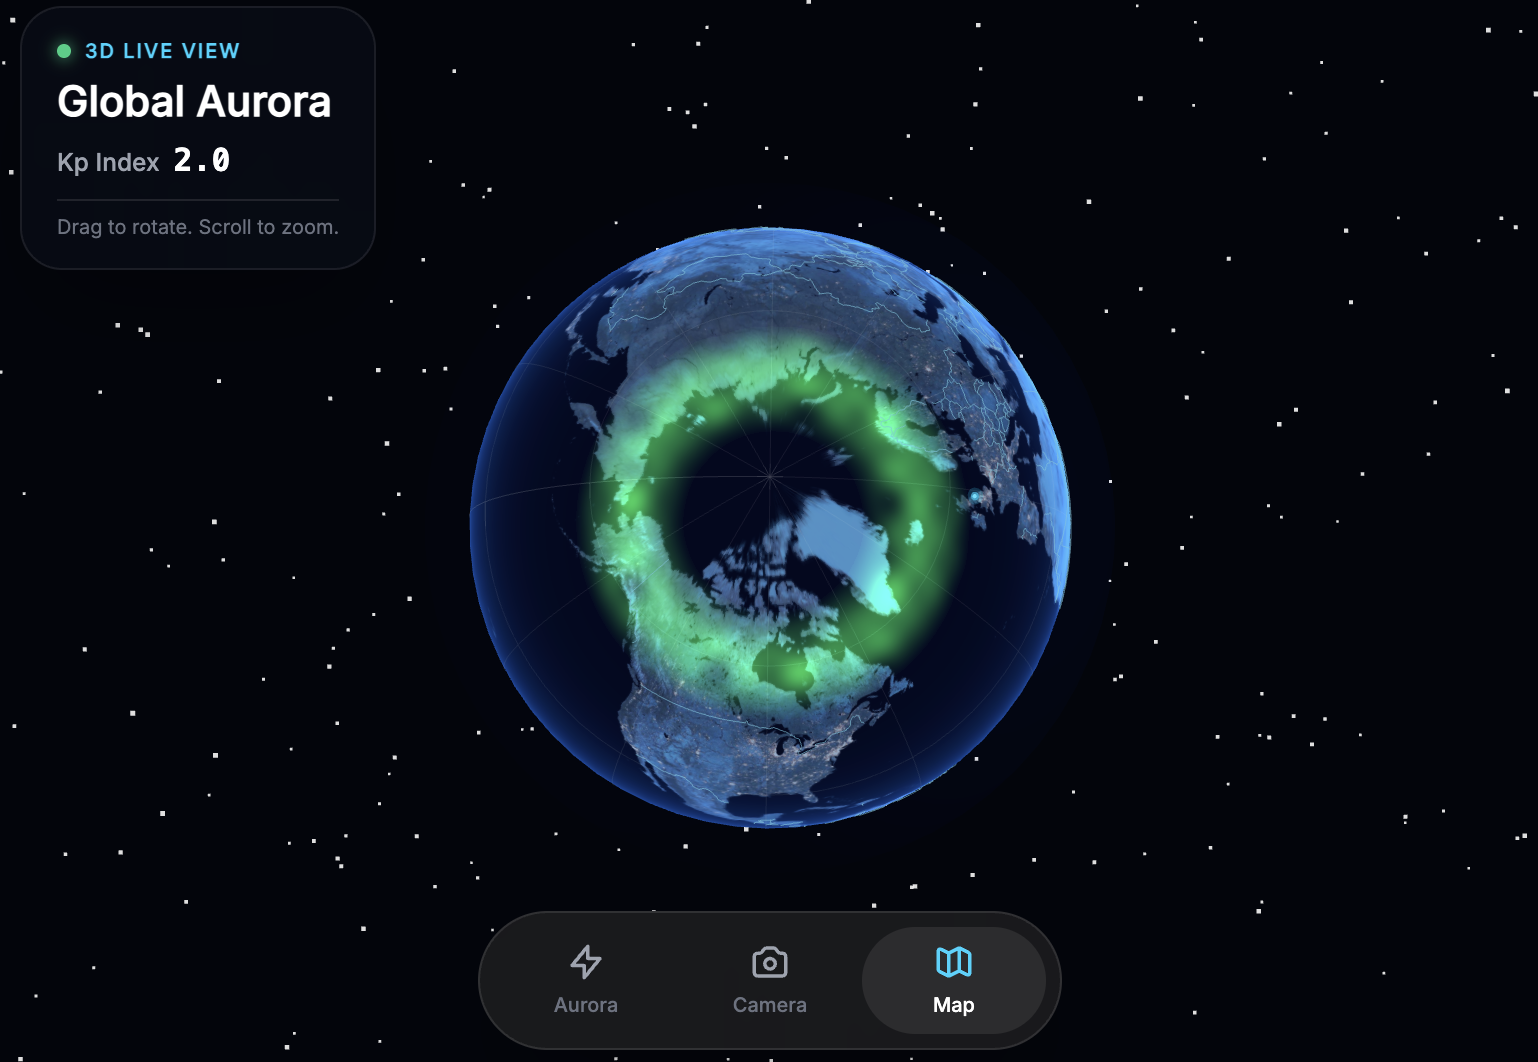
An animated aurora oval in 3D
AuroraP: Aurora Borealis Tracker
An immersive real-time aurora tracking dashboard using NASA DONKI data and Gemini AI analysis.
Inspiration
We once drove three hours into the freezing night, convinced we were about to witness a massive solar storm. We had no way to track the real-time position of the aurora oval and ended up staring at a perfectly clear—but perfectly empty—patch of sky over a brightly lit fast-food parking lot.
We spent hours debating if a distant green glow was the Northern Lights or just a poorly timed traffic light, completely unaware that heavy cloud cover was moving in to block our view anyway. With no clear way to interpret complex magnetic data, we eventually went home with nothing but cold feet and blurry photos of a dark sky.
This "epic fail" became our inspiration for AuroraP—an app we designed to replace guesswork with high-precision tracking and AI-powered advice, ensuring no one else has to mistake a neon sign for the majesty of the cosmos.
What it does
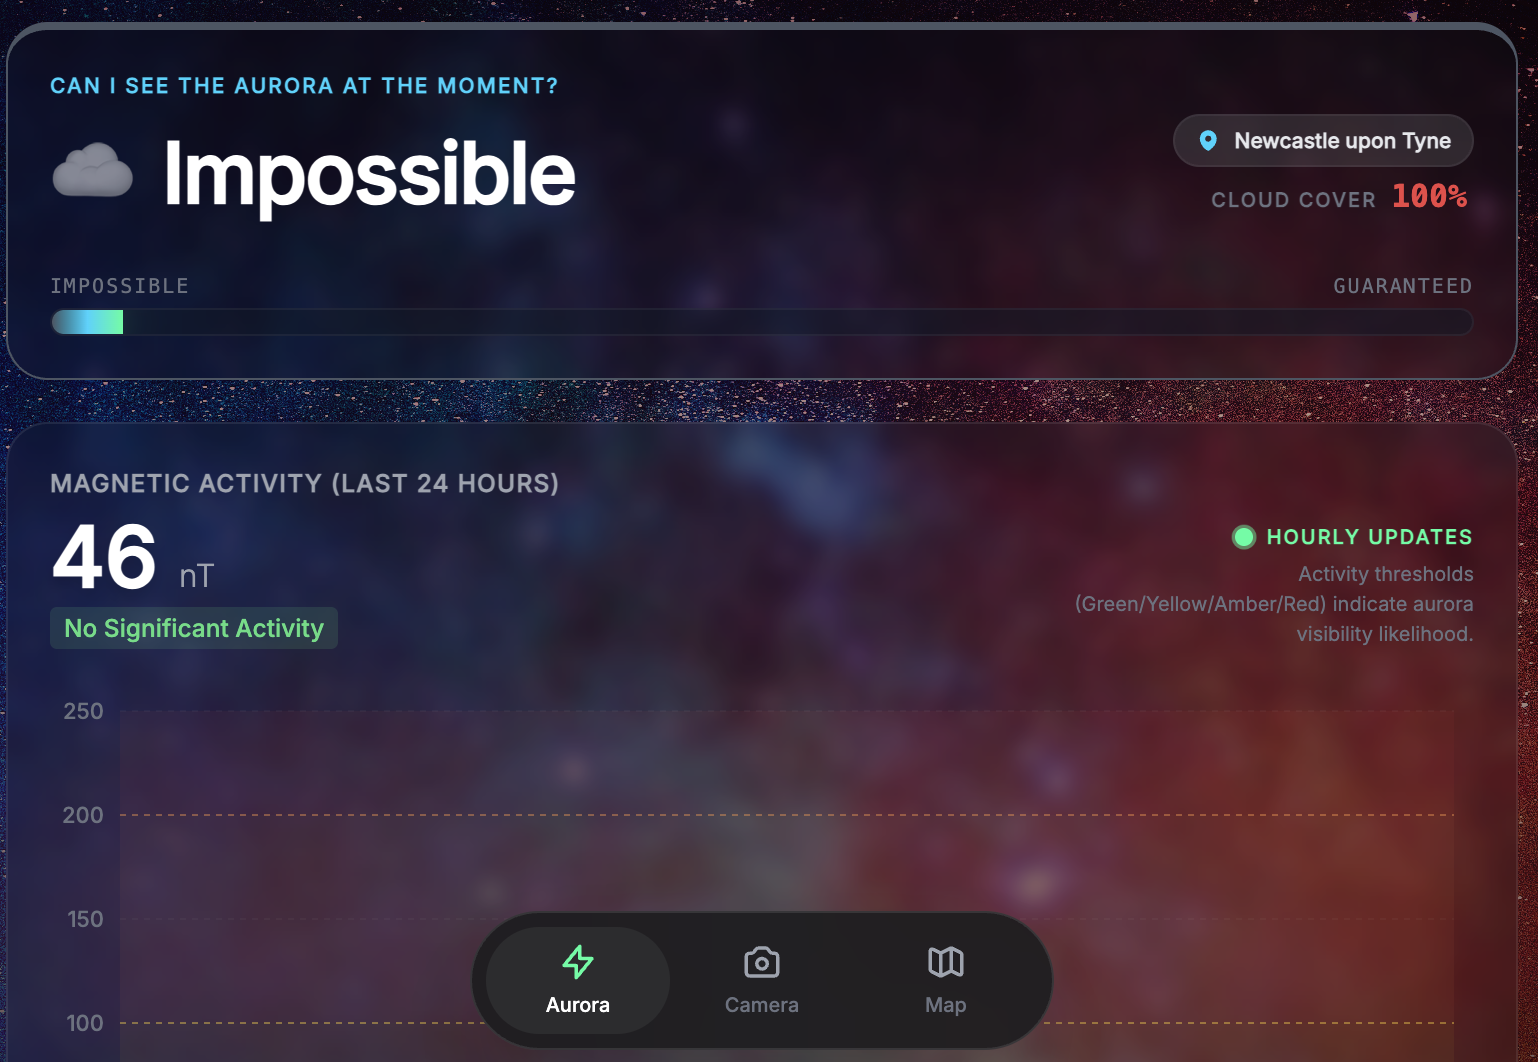
- Intelligent Viewing Forecast: Calculates local viewing probability by combining GPS location, global geomagnetic activity, and real-time cloud cover.
- 3D Global Aurora Oval: Features an interactive 3D globe that visualizes the current intensity and position of the aurora oval relative to the user.
- Gemini AI Analysis: Uses Gemini 1.5 Flash to provide personalized, plain-English advice and tips based on current solar activity.
- Live Activity Dashboard: Visualizes the last 24 hours of magnetic activity (nT) and a 7-day timeline of solar flares.
- Dynamic Atmosphere: The UI background shifts from a "Starry Night" aesthetic to a vibrant red "Storm Mode" during high-intensity geomagnetic events.
- Aurora Camera: Includes a built-in camera tool for users to capture and share sightings instantly.
How we built it
- Frontend Framework: Developed with React and TypeScript for a type-safe, responsive architecture.
- 3D Graphics: Built using Three.js, React Three Fiber, and Drei to create the interactive global map and custom aurora shaders.
- Data Visualization: Utilized Recharts for rendering live magnetic activity and solar flare timelines.
- AI Integration: Leveraged the Google Generative AI SDK to connect with the Gemini 1.5 Flash model for expert forecasts.
- Real-time APIs: Integrates NASA DONKI for space weather, Open-Meteo for local weather, and BigDataCloud for reverse geocoding.
Challenges we ran into
- Data Translation: Normalizing global Kp-index data into local nanoTesla (nT) readings required research to ensure the "Viewing Chance" algorithm remained scientifically grounded.
- 3D Optimization: Rendering complex country borders and an animated aurora oval in 3D while maintaining performance across mobile devices.
- API Orchestration: Coordinating multiple asynchronous data streams (Location, Weather, NASA, and AI) into a unified and responsive application state.
Accomplishments that we're proud of
- Reactive UI: Creating an interface that "feels" the storm through dynamic color shifts and background animations based on live telemetry.
- AI Astronomer: Successfully implementing an AI guide that distills technical telemetry into encouraging and actionable advice.
- Visual Storytelling: Using custom GLSL shaders to represent the aurora as a living, moving entity on a 3D globe.
What we learned
- Space Science: Gained deeper insights into how solar flares and Coronal Mass Ejections (CMEs) interact with Earth's magnetic field.
- Advanced WebGL: Deepened knowledge of shader programming to simulate atmospheric effects like the aurora curtain within a React environment.
- Prompt Engineering: Refined AI interactions to balance scientific accuracy with a friendly, beginner-oriented tone.
What's next for AuroraP
- Community Pins: Allowing users to pin real-time sightings directly onto the 3D global map.
- Predictive Storm Alerts: Implementing push notifications that alert users to predicted solar storm arrival times.
- Enhanced Realism: Refining the aurora shaders to reflect specific ionization colors (green, purple, and red) based on the altitude of the storm.
Run Locally
Prerequisites: Node.js
- Install dependencies:
npm install - Set the
GEMINI_API_KEYin.env.localto your Gemini API key - Run the app:
npm run dev


Log in or sign up for Devpost to join the conversation.