Inspiration
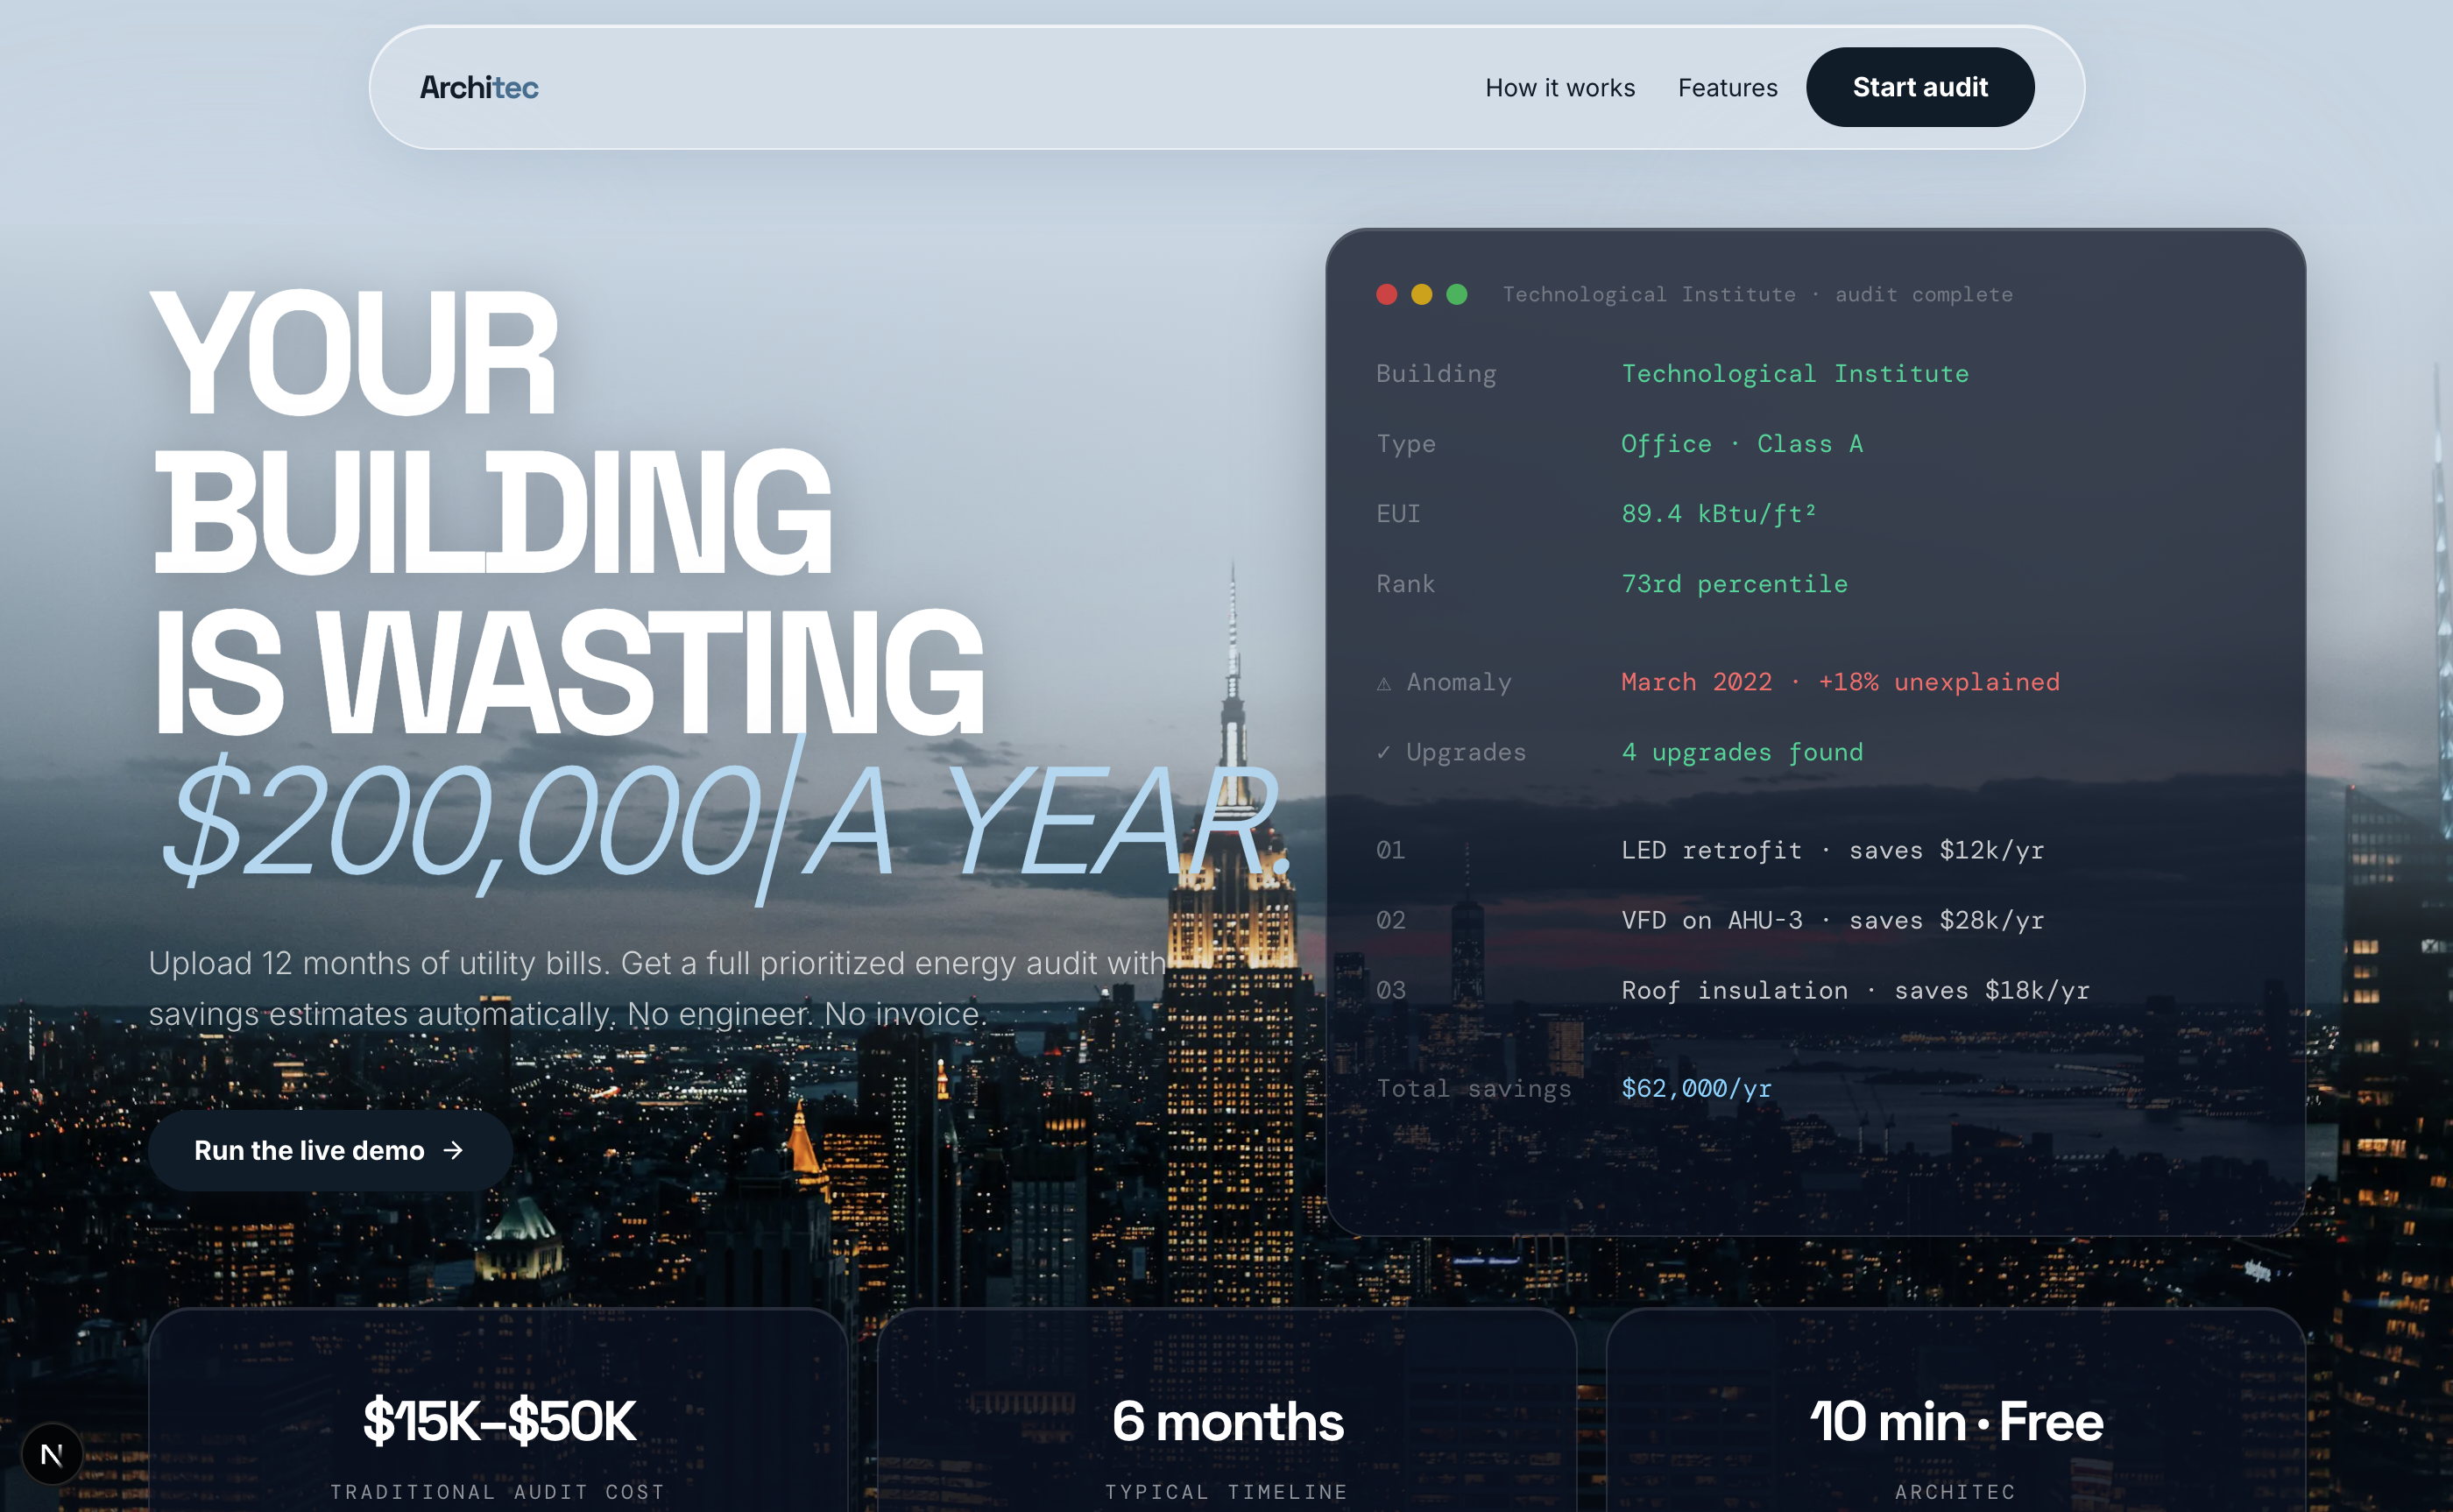
Our project was inspired by the idea that large amounts of meaningful data already exist but are often inaccessible or difficult to interpret. Specifically, in commercial buildings, energy usage data is available across utility bills, weather records, and public datasets, yet most building owners never receive detailed energy audits because they are expensive and time-consuming. A traditional Level II ASHRAE energy audit can cost between $15,000 and $50,000 and take months to complete, which means many mid-size buildings never analyze their energy performance at all.
Our goal was to use data storytelling to transform this raw data into a clear narrative about how a building consumes energy, where inefficiencies exist, and what improvements could meaningfully reduce costs and emissions. We also wanted the project to be technically ambitious, combining statistical modeling, machine learning, data visualization, and a robust tech stack. Our project shows that data storytelling can turn info we already have into actionable information that supports better sustainability decisions at an institutional level.
What it does
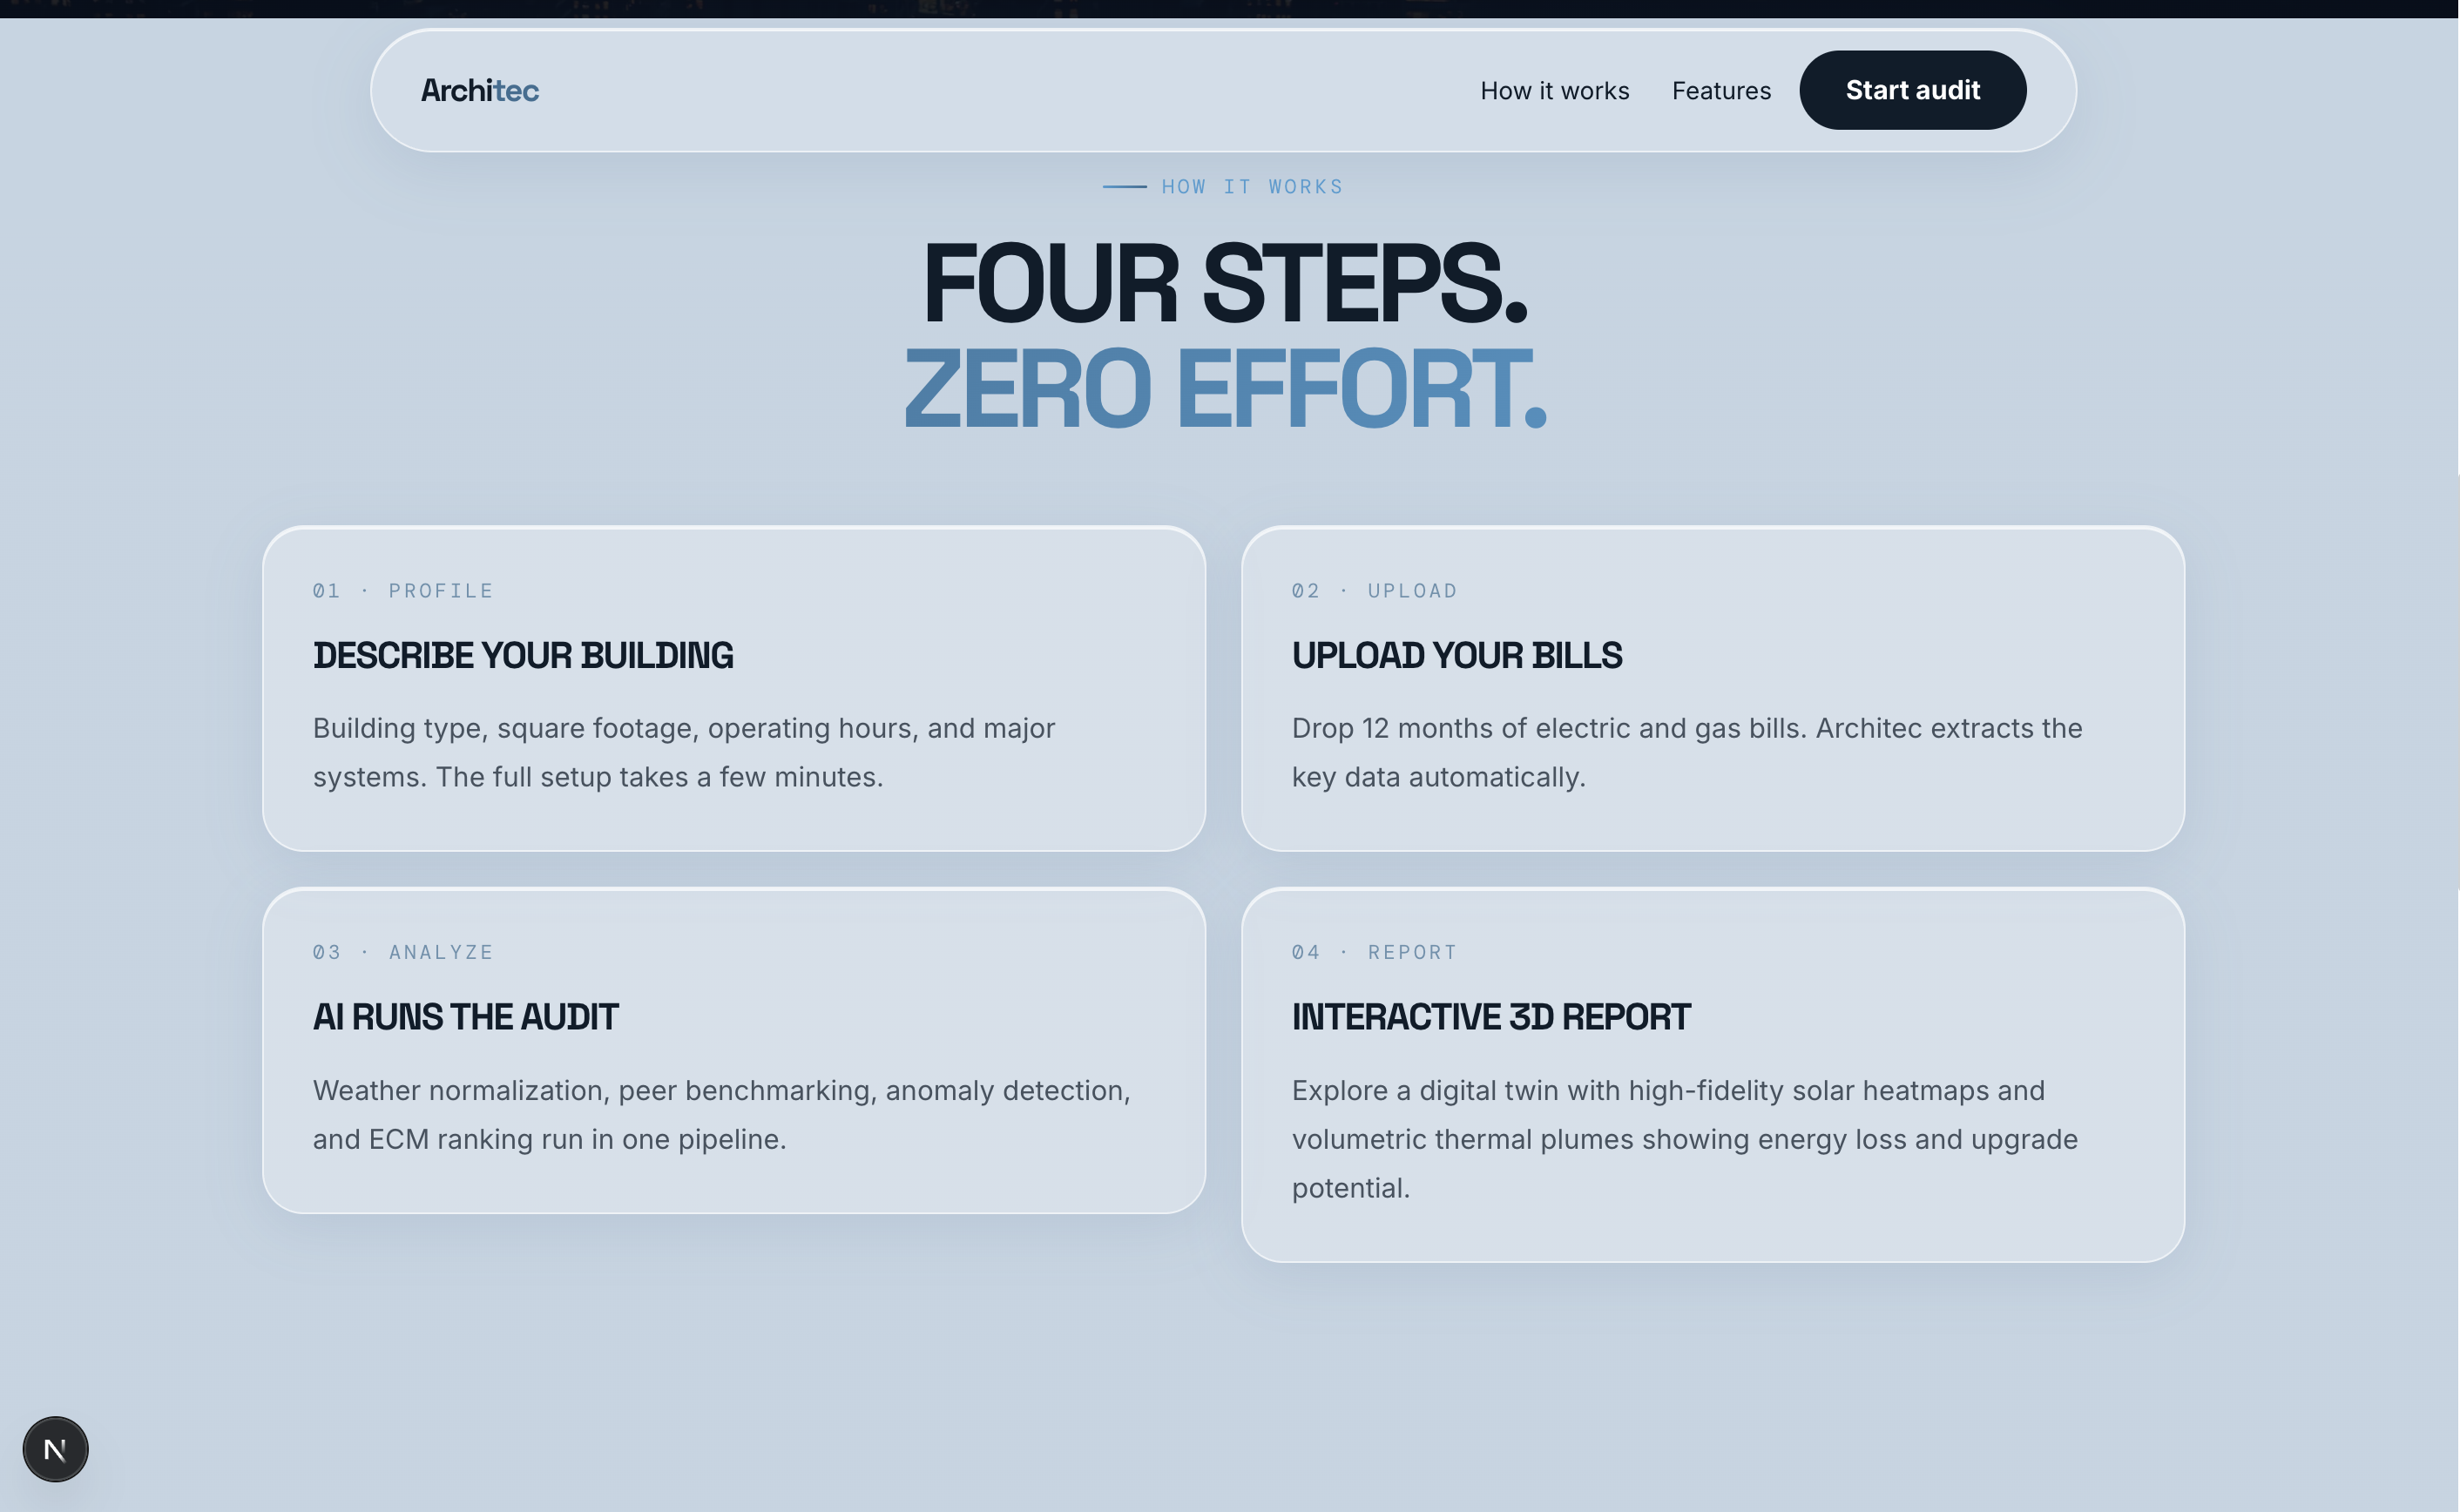
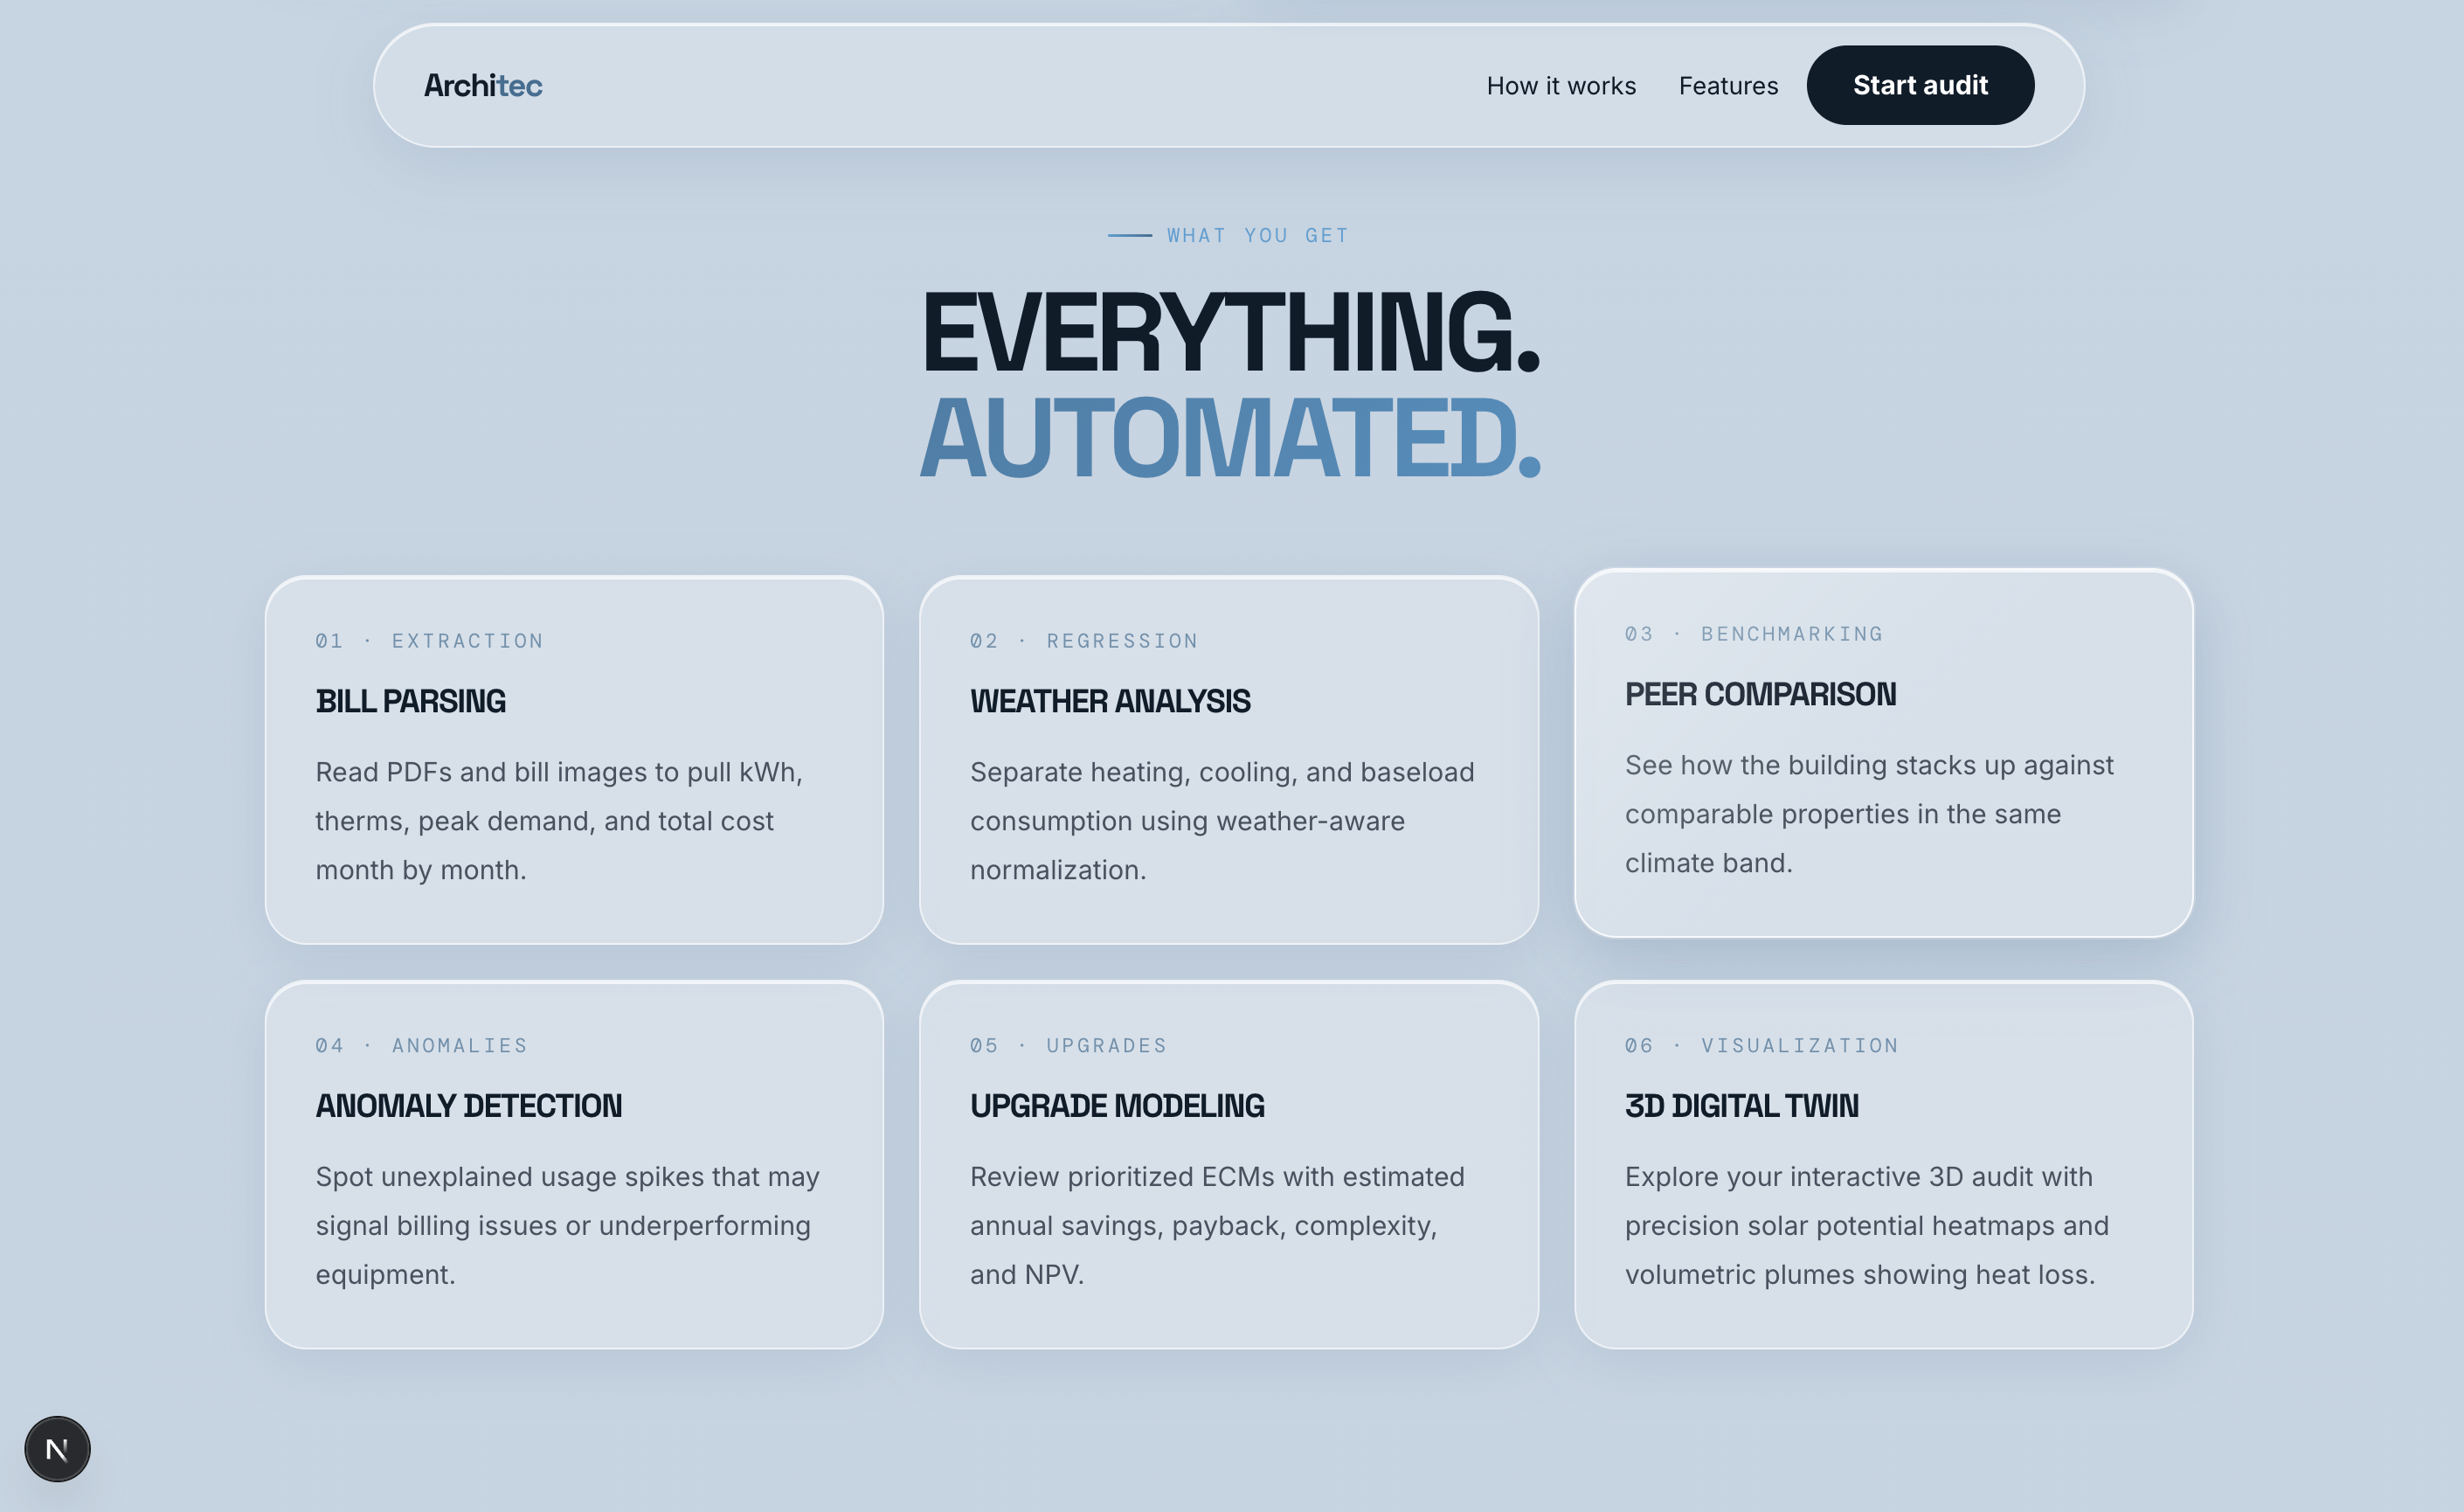
Architec gives any building owner a professional energy audit in under 10 minutes, for free. You upload 12 months of utility bills, answer a few quick questions about your building, and the platform does the rest. It reads your bills automatically, pulls in local weather records, and figures out exactly how much of your energy bill comes from heating, how much from cooling, and how much is just always-on equipment running in the background. It then compares your building against thousands of similar buildings nationwide to show you where you rank and where you're overpaying. If your energy use ever spiked in a way the weather can't explain, the system catches that too and flags it as a finding. From all of that, an AI energy engineer writes you a full audit report with specific recommended upgrades, estimated costs, and exactly how long each one takes to pay for itself. You can also ask it questions out loud and get answers in plain English through a voice interface. And instead of reading a dry PDF, you see your building in 3D with heat loss and solar potential mapped directly onto it, so the story of where your energy is going is something you can actually see.
How we built it
- Frontend: React and Next.js for the user interface and application framework
- Backend: FastAPI with Python for APIs, data processing, and analytics
- Rapid Prototyping: Appifex used to generate the initial application skeleton
- AI-Assisted Development: Claude Code used to accelerate development and implementation
- 3D Visualization: Custom Three.js implementation integrated with Mapbox GL for interactive building visualization
- Geometry Optimization: three-mesh-bvh for high-performance 3D mesh acceleration
- Solar Analysis: Google Solar API for rooftop solar potential and shading data
- AI / Intelligence Layer: Google Gemini for reasoning, inference, and OCR of utility documents
- Data: 2018 EIA CBECs microdata and NOAA
- Data Visualization: Recharts for energy trend and analytics charts
- Machine Learning: scikit-learn for anomaly detection and modeling (e.g., Isolation Forest)
- Database: Supabase Postgres for application data storage
- Voice Interface: ElevenLabs for a conversational AI assistant to narrate and explain the audit report
- Cloud Infrastructure: DigitalOcean for deployment and hosting
- Domain: GoDaddy for the .tech domain registration
Version Control & Collaboration: Git and GitHub for source control, versioning, and collaborative development
plenty of snacks and RedBulls/Monsters
Challenges we ran into
One of the hardest challenges that we ran into was rendering the solar data and heat loss simulation onto Mapbox via Three.JS. The solar data was processed using GeoTIFF metadata, while Mapbox used WGS84 metadata, requiring us to reproject bounds. Not to mention the complexity of rendering a Three.JS layer on top of Mapbox to handle the simulations and the coloring. For a while, because rendering was dependent on the position of the camera, certain corners of buildings that started outside the would also not render, which caused issues. Another challenge was to have a personalized energy manager. The core technical hurdle was finding a way to give our AI a unique "brain" for every user’s specific property. We solved this by creating a real-time data flow that feeds our site-specific EUI data, anomaly detections, and upgrade models directly into the AI’s working memory. This allows the assistant to answer precise questions about the building’s ROI and technical findings, rather than just reciting general energy-saving tips. This is where ElevenLabs' Conversational AI became essential, providing the robust infrastructure needed to handle these dynamic context injections with natural, low-latency voice interaction.
Accomplishments that we're proud of
Honestly, the fact that the full pipeline works end to end. In 24 hours, we went from a blank repo to a system that reads a utility bill, runs statistical regression against real weather data, benchmarks against 5,000 federal building records, detects anomalies with machine learning, generates a professional audit report, and renders the results on a 3D model of the actual building. Each of those pieces would be a project on its own. Getting them to talk to each other, in a hackathon, is what we're most proud of. We're also proud of the 3D visualization, projecting solar radiation maps and thermal plumes onto a live building model was genuinely hard, and it shows. And we're proud that we built something that solves a real problem for real people, not just a demo that looks good on a slide.
What we learned
We learned that the hardest part of working with real-world data is not the modeling, it's the messy edges. Reprojecting GeoTIFF solar data from Google's coordinate system into Mapbox's WGS84 format cost us hours we didn't have. OCR on utility bills is inconsistent in ways that are only obvious when you test on actual bills from actual utilities. PRISM regression sounds straightforward until you're hunting for the right changepoint temperature at 3am. We also learned how to build a personalized AI that reasons about a specific property rather than giving generic advice, feeding live site data directly into the model's context was a real technical unlock. And we learned, maybe most importantly, that a team that communicates well and keeps moving beats a team with a perfect plan.
What's next for Architec
The audit report is the beginning, not the end. Next, we want to connect building owners directly to contractors who can act on the recommendations, turning Architec into a marketplace where the gap between "here's what's wrong" and "here's someone who can fix it" closes in one click. We also want to integrate Green Button Connect so owners can pull utility data automatically instead of uploading PDFs. On the analytics side, we want to add 15-minute interval data analysis for demand charge optimization and battery storage sizing. Longer term, we see Architec becoming the energy intelligence layer for commercial real estate, the tool that every building owner, property manager, and sustainability team uses before they make any capital decision about their building.
Built With
- appifex
- cbecs
- claude
- digitalocean
- elevenlabs
- fastapi
- gemini
- git
- github
- godaddy
- googlesolar
- lovable
- mapbox
- next.js
- ocr
- postgresql
- python
- react
- recharts
- sci-kit-learn
- supabase
- three-mesh-bvh
- three.js


Log in or sign up for Devpost to join the conversation.