-
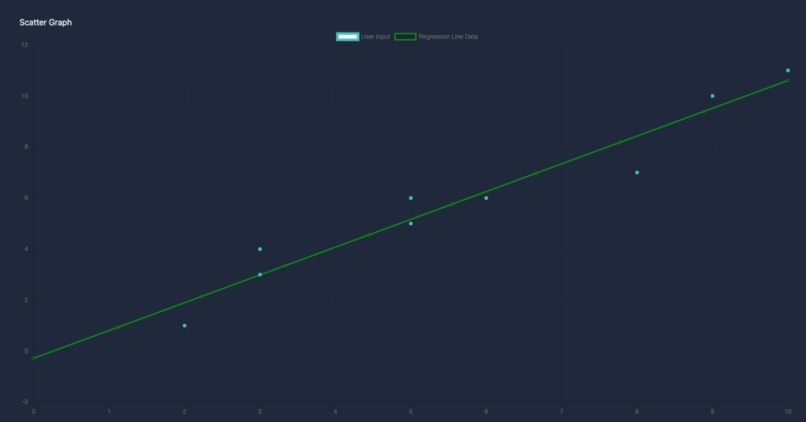
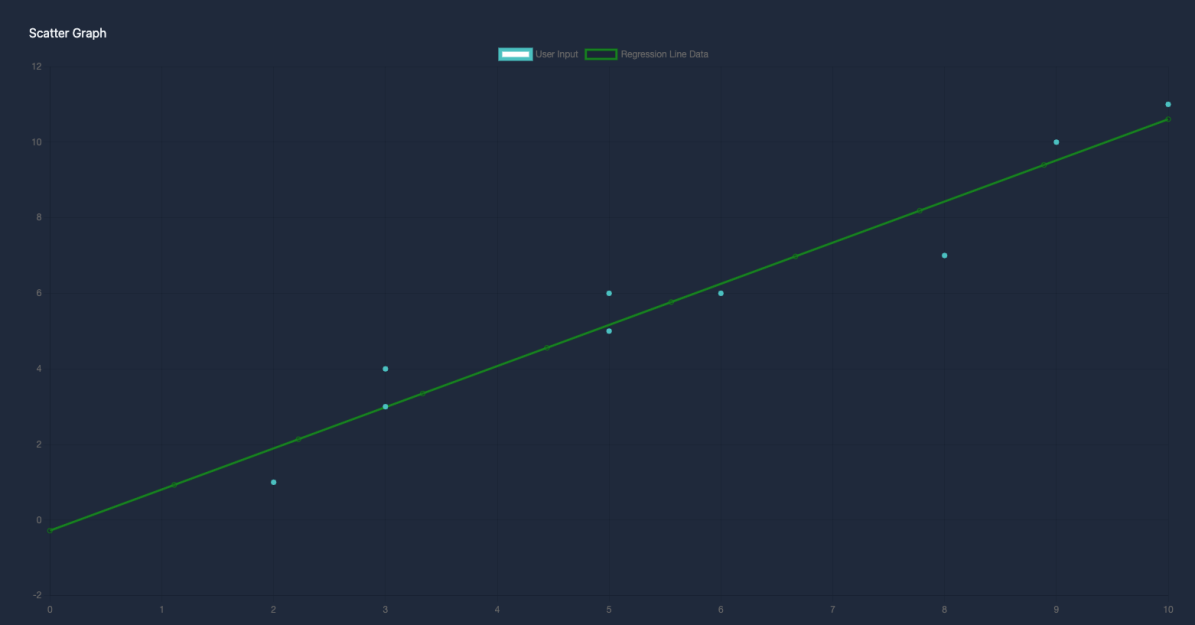
Linear regression line
-
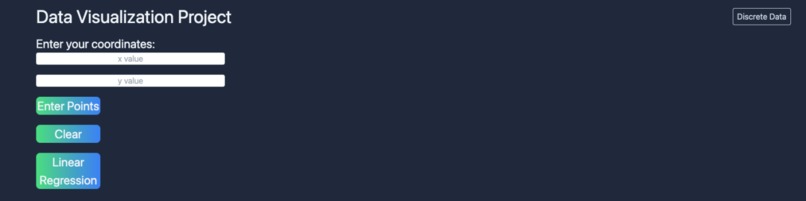
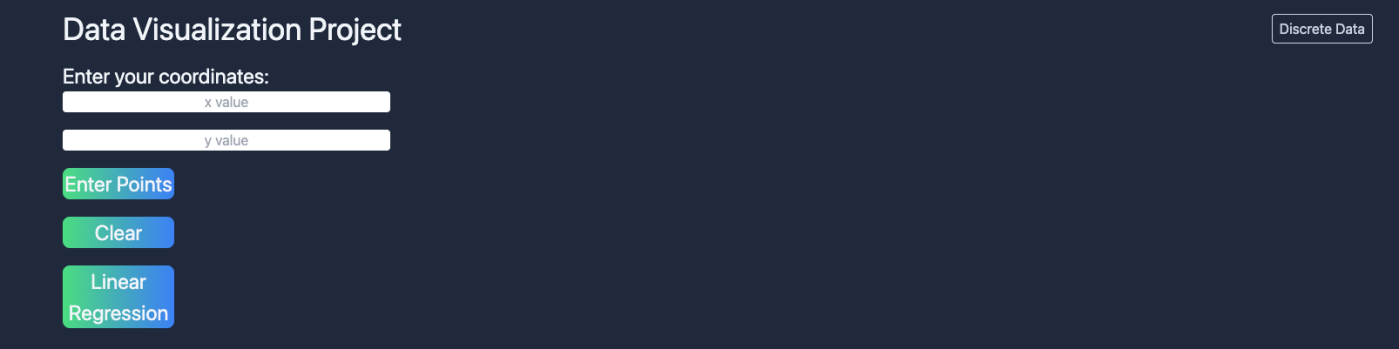
UI for the inputting the data points
-
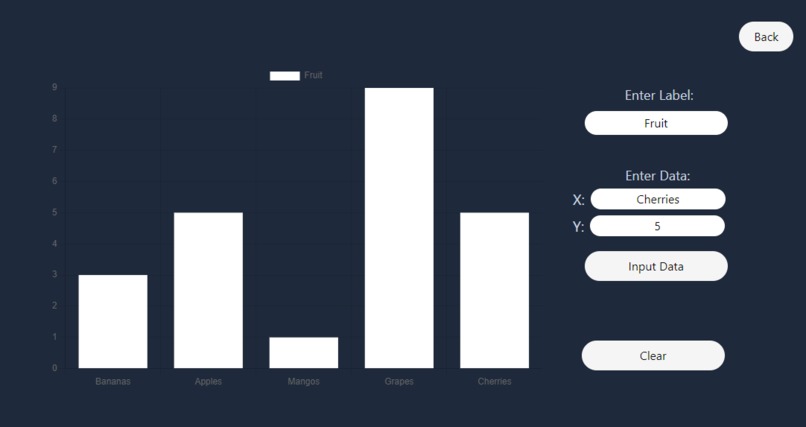
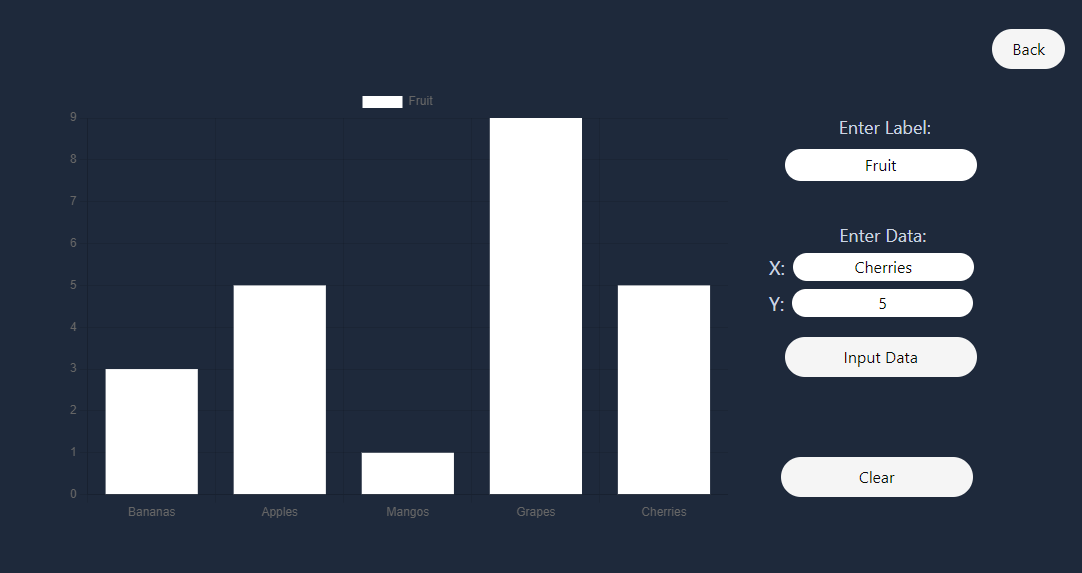
Bar Chart
Inspiration
Wanted to learn how linear regression works.
What it does
User enters data and a scatter graph is displayed with a line of regression. A bar chart can also be seen.
How we built it
Used Typescript, Next.Js and Chart.Js.
Challenges we ran into
Deployment of the app became difficult as a single error that did not affect us during compilation, was affecting during the command "npm run build", hence why we did not deploy our website.
Accomplishments that we're proud of
Spending 3 hours straight trying to get a graph on the screen and get a line of regression
What we learned
The formula for linear regression Web development is hard work but very rewarding once it works.
What's next for Data visualization app
We need to learn what is wrong in our page.tsx file with the linear regression as we do not know why the data in the scatter is not working (perhaps due to mistyping or using the wrong type).

Log in or sign up for Devpost to join the conversation.