-
-
Project Home page
-
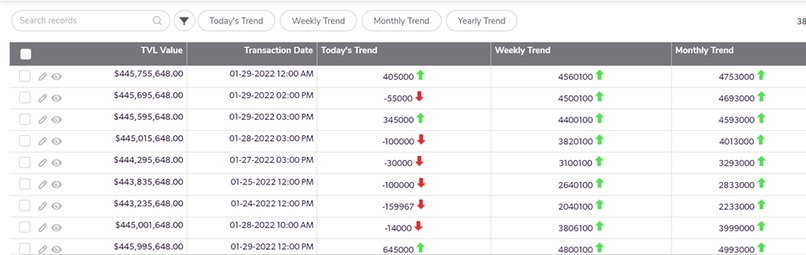
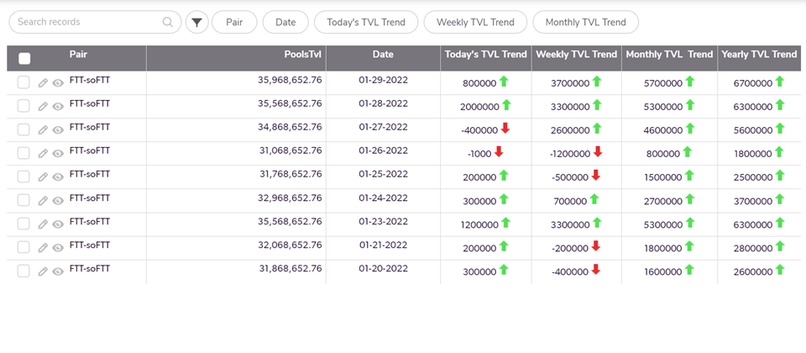
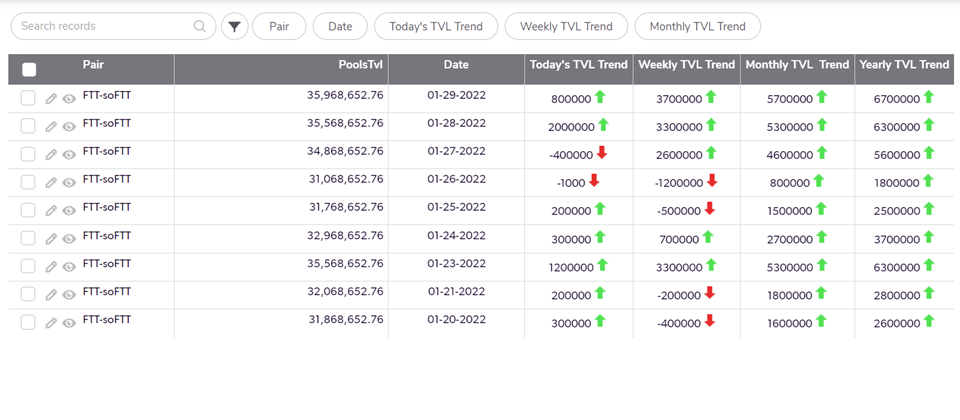
TVL Weekly Trend
-
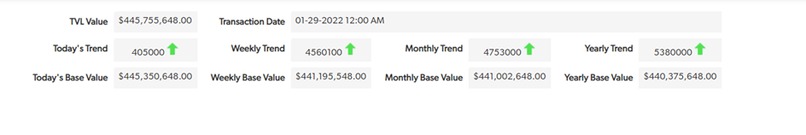
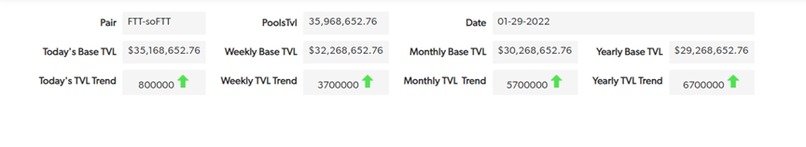
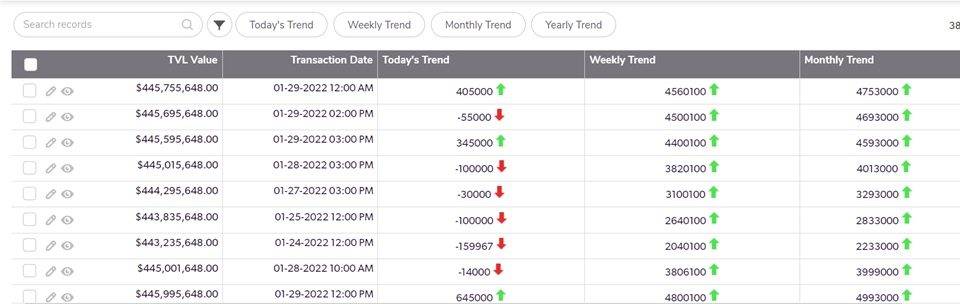
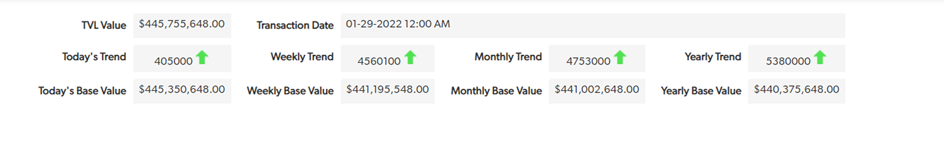
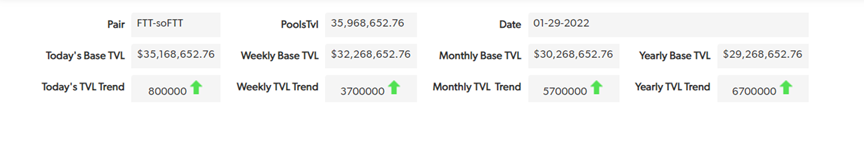
TVL Drilldown
-

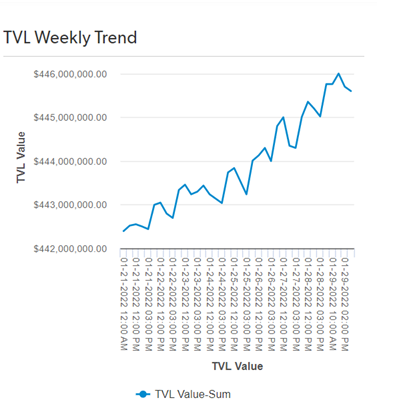
TVL Weekly Trend Graph
-
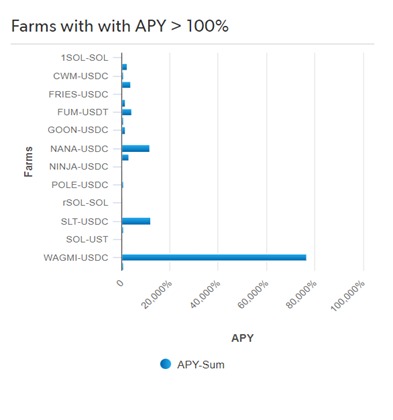
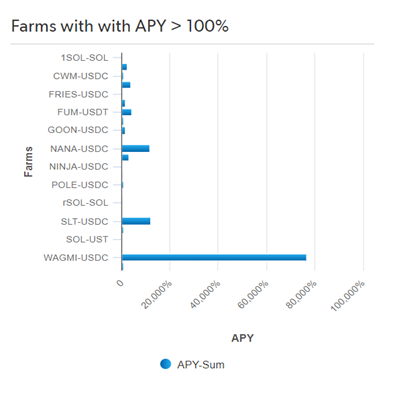
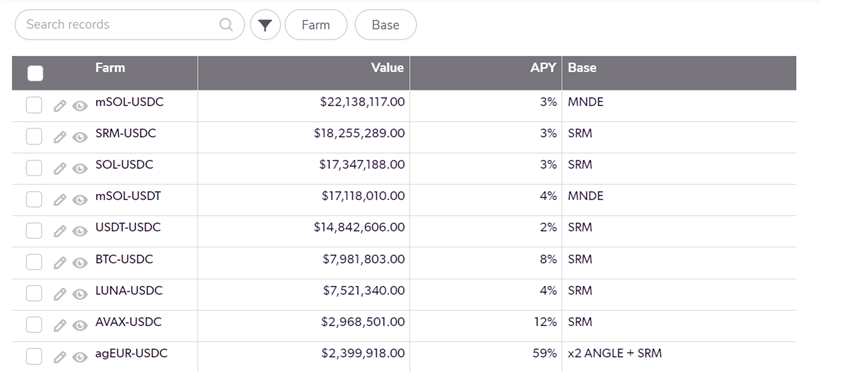
Farms APY Graph showing farms greater than 100 APY
-
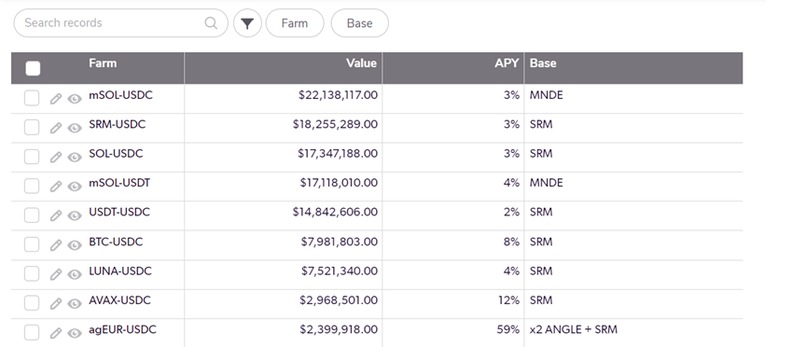
Farm Dataset
-
Pool Trend
-
Pool Drill down dataset
-

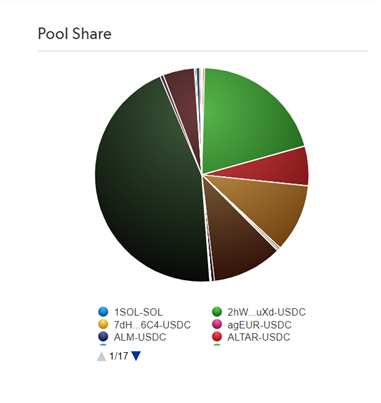
TVL Pool Share
-
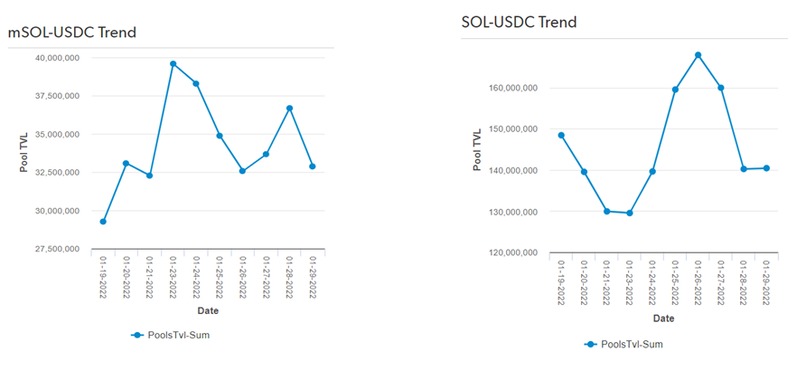
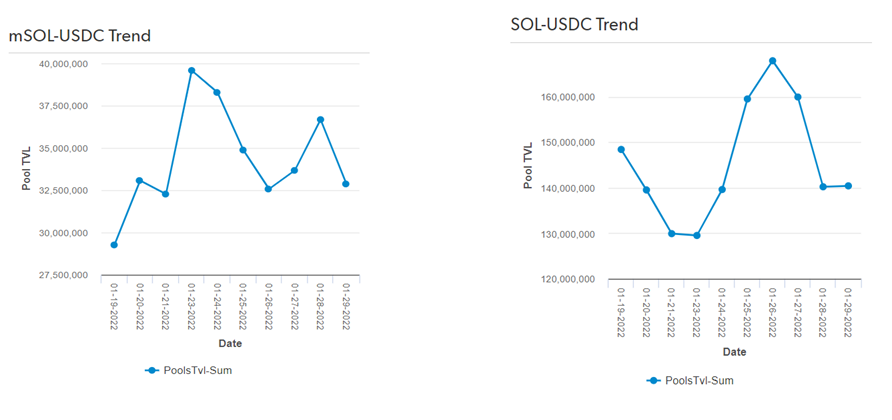
Pool Trend

Inspiration
With Web 3.0 dominating the tech news, we wondered how we, as technology enthusiasts, might contribute to this oncoming revolution. Following it, a brainstorming session resulted in Atrix Matrix, a blockchain-based decentralized system.
What Atrix Matrix does
Teams in financial services specially in the crypto currency segment are under increasing pressure to prove how their work drives success.
With Atrix Matrix, bringing the platform that has capability to demonstrate and improve the impact through redefined experience, as well as feed valuable insight back to the stakeholders for right decisioning through developed Smart Analytics at core.
Drive experience engagement with psychology – Atrix Matrix is designed with purpose to see higher levels of engagement in line with how best brains absorb and process platform generated dynamic information set with a mission to outperform the results.
Steer client strategy with data – With Atrix Matrix - be insights, history & trends capabilities end user will exactly have needed data to be most engaged to improve on results. Data feeds have been leveraged at best to enrich the value through provided drill down at levels be day, week, month and year or configured duration.
Our smart solution Atrix Matrix running on top of feed from Atrix which is an A M M decentralized exchange running on the Solana blockchain that utilizes Serum's order books.
Our interactive dashboard allows you to drill down and filter information so data can be viewed from different perspectives or in more detail. With a condensed and clear presentation of the Pool data, T V L Weekly Trend and Farms with A P Y of more than 100%, the first glance of the dashboard provides intelligent insights which are derived to enable data-driven company decisions. Our visual presentation can cut through the audience as pictures speak a thousand words. To have a simple gauge with a red, yellow and green indicator makes a huge difference.
With our automated data processing and intuitive and interactive dashboard People don’t need to analyze the whole data set to tell them what's the trend - the headline information is available for them.
The pool share chart shows you the share of different pools and their T V L. The intuitive 3 D chart is not only informative but is interactive as well, we can click on any pool in the chart and a report will be generated for your dynamically which show the specific data for the section selected on the the chart.
Our solution captures the data from Atrix A P I and slices and dices the data to present the T V L Weekly trend. This chart will help the teams understand the trend for the T V L for a specific time period. The data points on the chart are again interactive and you can click the data points to get more details.
On the right hand side we have filtered any displays of farms with A P Y more than 100 percent. This report provides your smart insight of the high yielding farms and will help you capture crucial data points which can help you in making your investment decision.
We are capturing and processing the T V L data and maintaining the history of past data to show the performance. Smart color coded indicators can quickly provide the overall performance of the T V L compared to our base values which are updated every day, every week , every month and every year on a regular basis.
For the farms data as well we have added our efficient algorithms to capture and process the data consumed from Atrix A P I. Details of the data points are available at single click and the smart indicators will help in gauging trends of the farms.
Atrix is the only Serum A M M that allows you to easily create liquidity pools and farms. The capabilities provided by Atrix unlocks many capabilities like creating Serum liquidity pools and LP token farms, and performing all trades directly on Serum D E X without any additional fees. Atrix Matrix further enhances the experience for your teams. Our solution is easily configurable within the enterprise ecosystem and has many out of the box connects available to support this. Our platform enables you to quickly and easily connect your business system data then carry out data analysis.
The solution does much of the heavy lifting so you can present your results on interactive dashboards and share knowledge with colleagues, partners or customers. Interactive dashboards pave the way for effective communication of your business figures inside and outside your company.
How we built it
To connect to the blockchain, Solana and Atrix NodeJS SDK are utilized. NodeJS to construct APIs. Dashboard built in Quickbase (a low-code, no-code platform) and then merged with the platform.
Challenges we ran into
During the platform's development, we experienced numerous hurdles. We ran into problems that were tough to diagnose because the technology we employed was new. However finally we could crack through the challenges to bring end to end connected solution.
Accomplishments that we're proud of
Glad to be part of a changing world to create a better life for today and in the future through technology development.
What we learned
We learnt a lot about blockchain and about Solana ecosystem. We see the potentials of Solana becoming bigger in the future by integrating different entities and allow them to trade without barriers.
What's next for Atrix Matrix
For the following step, we intend to improve Atrix Matrix so that it may be used in real life.

Log in or sign up for Devpost to join the conversation.