-
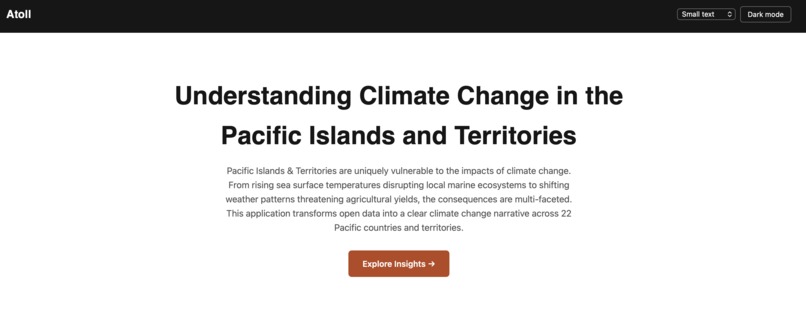
Landing Page
-
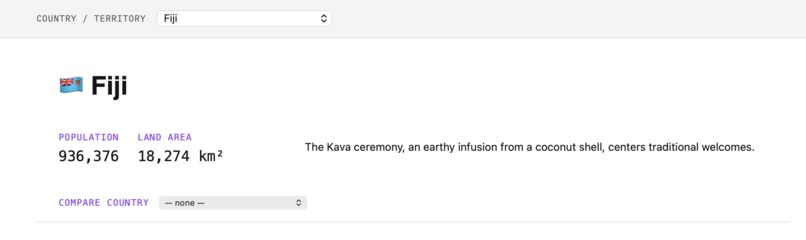
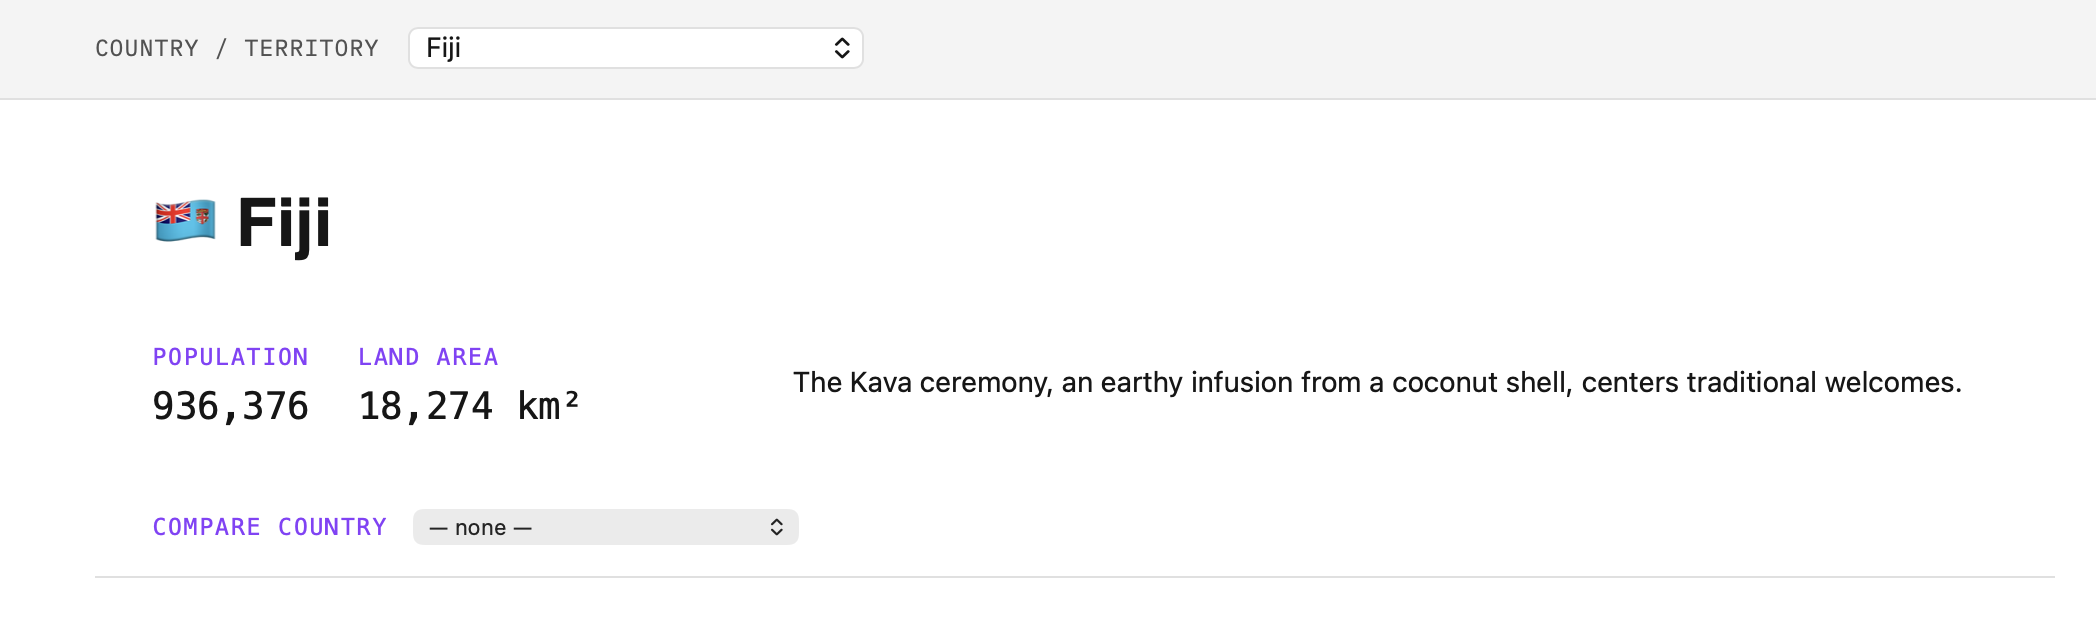
Country Overview
-
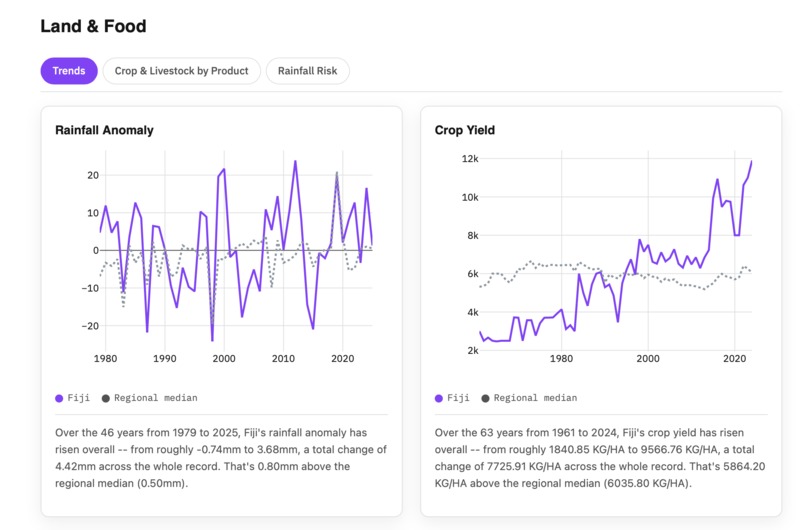
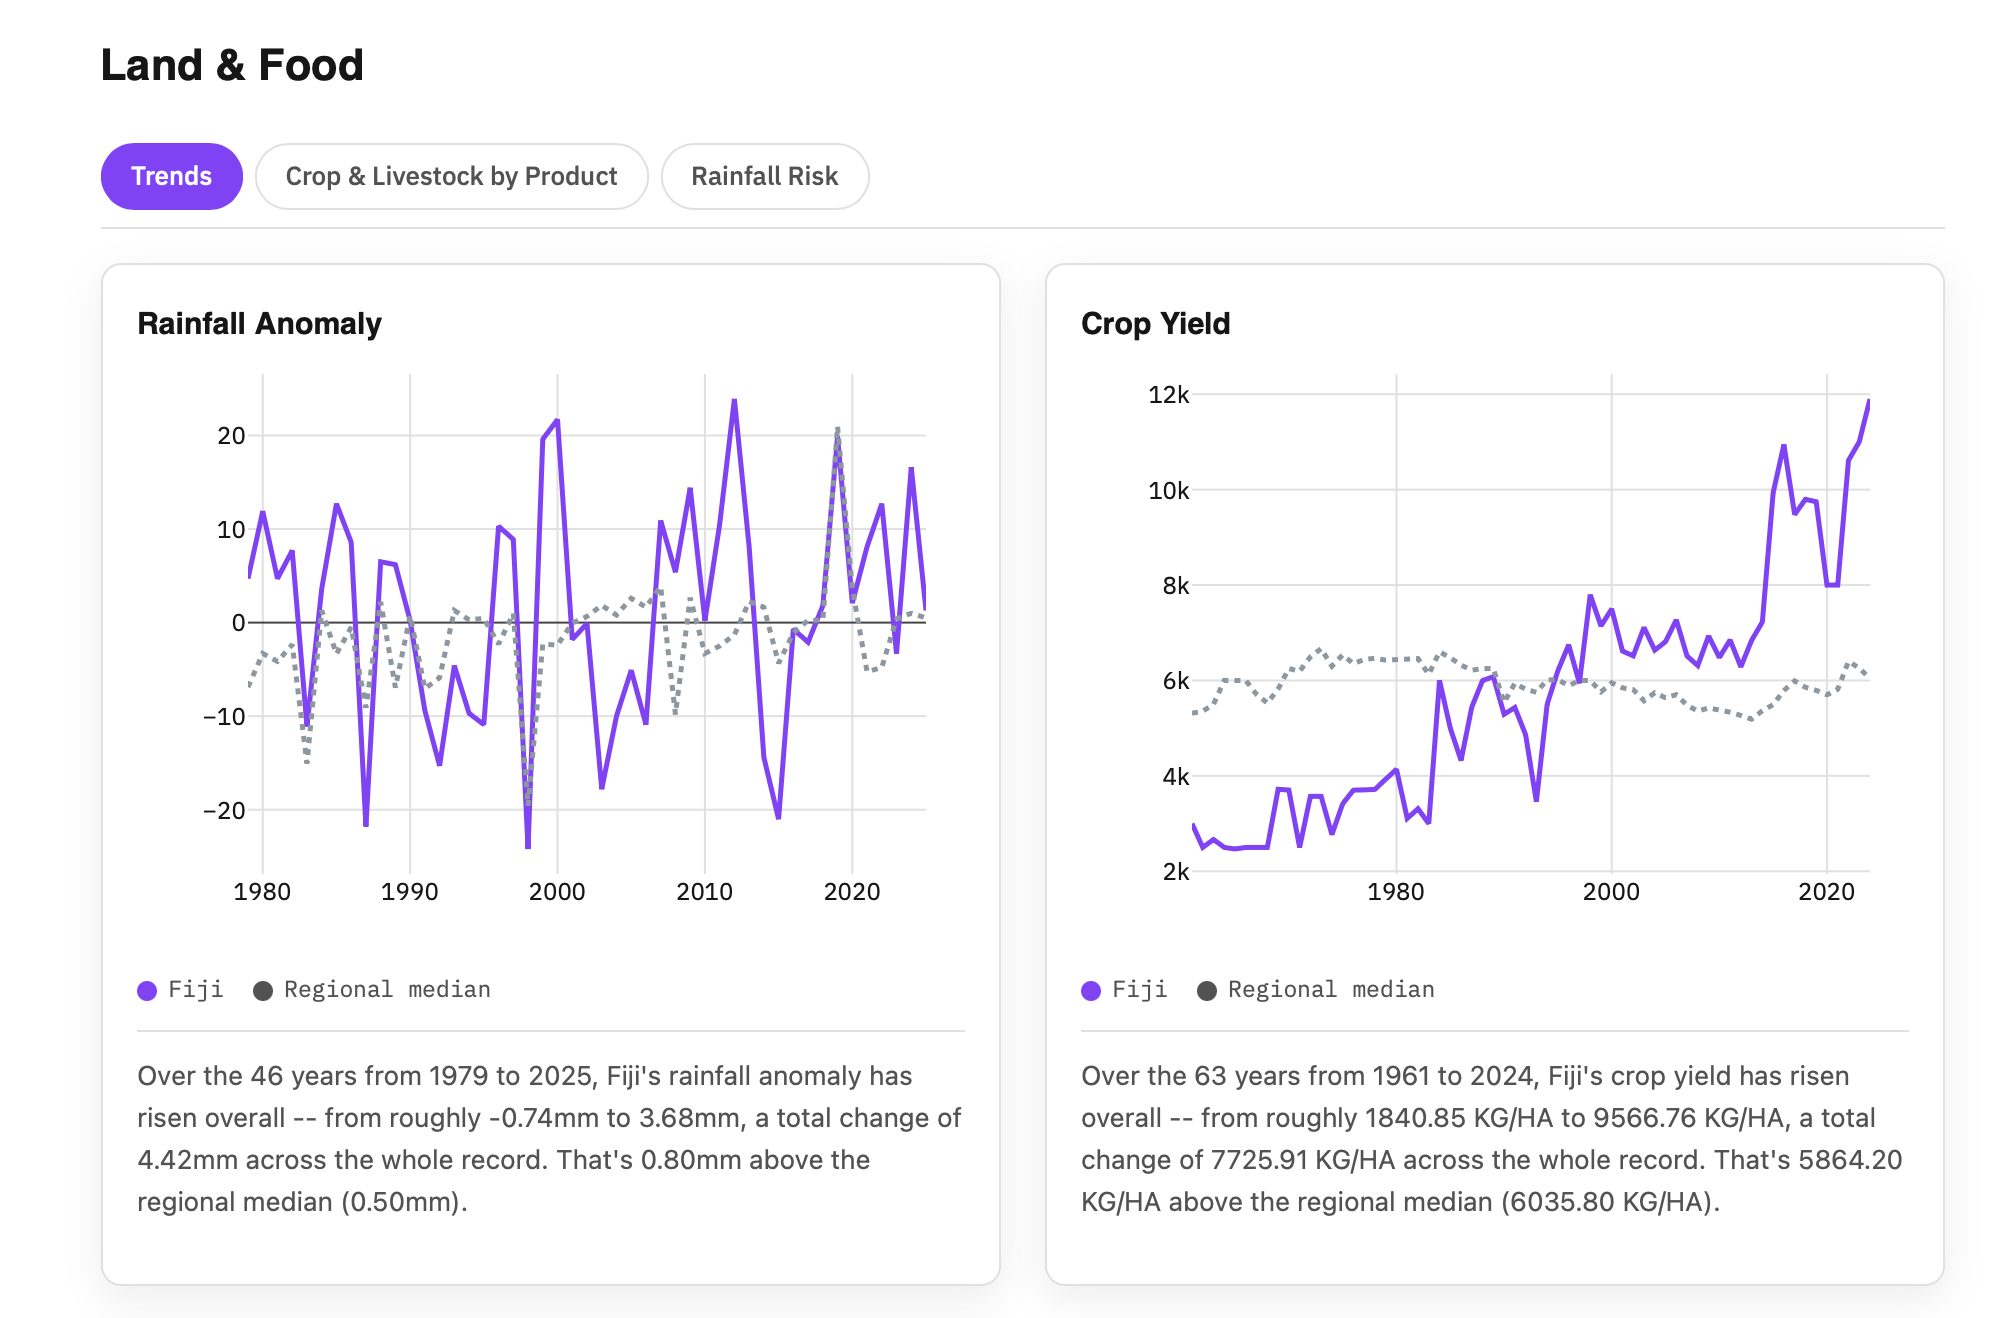
Land & Food Insights
-
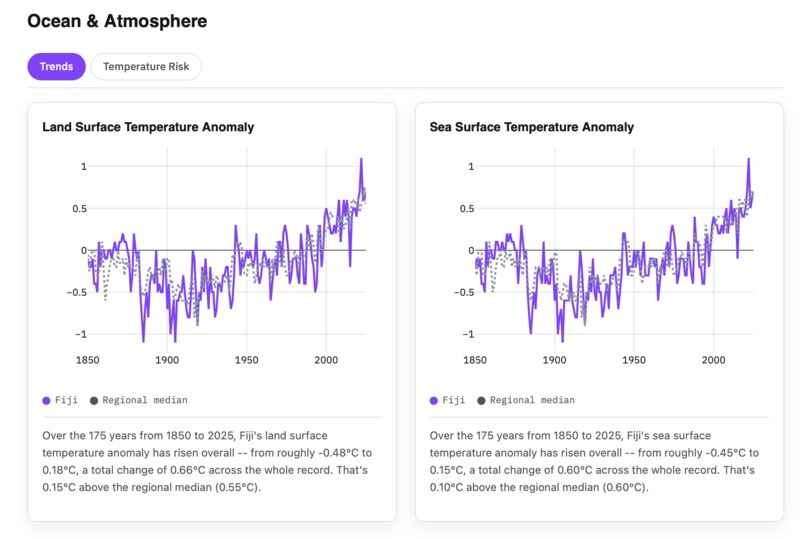
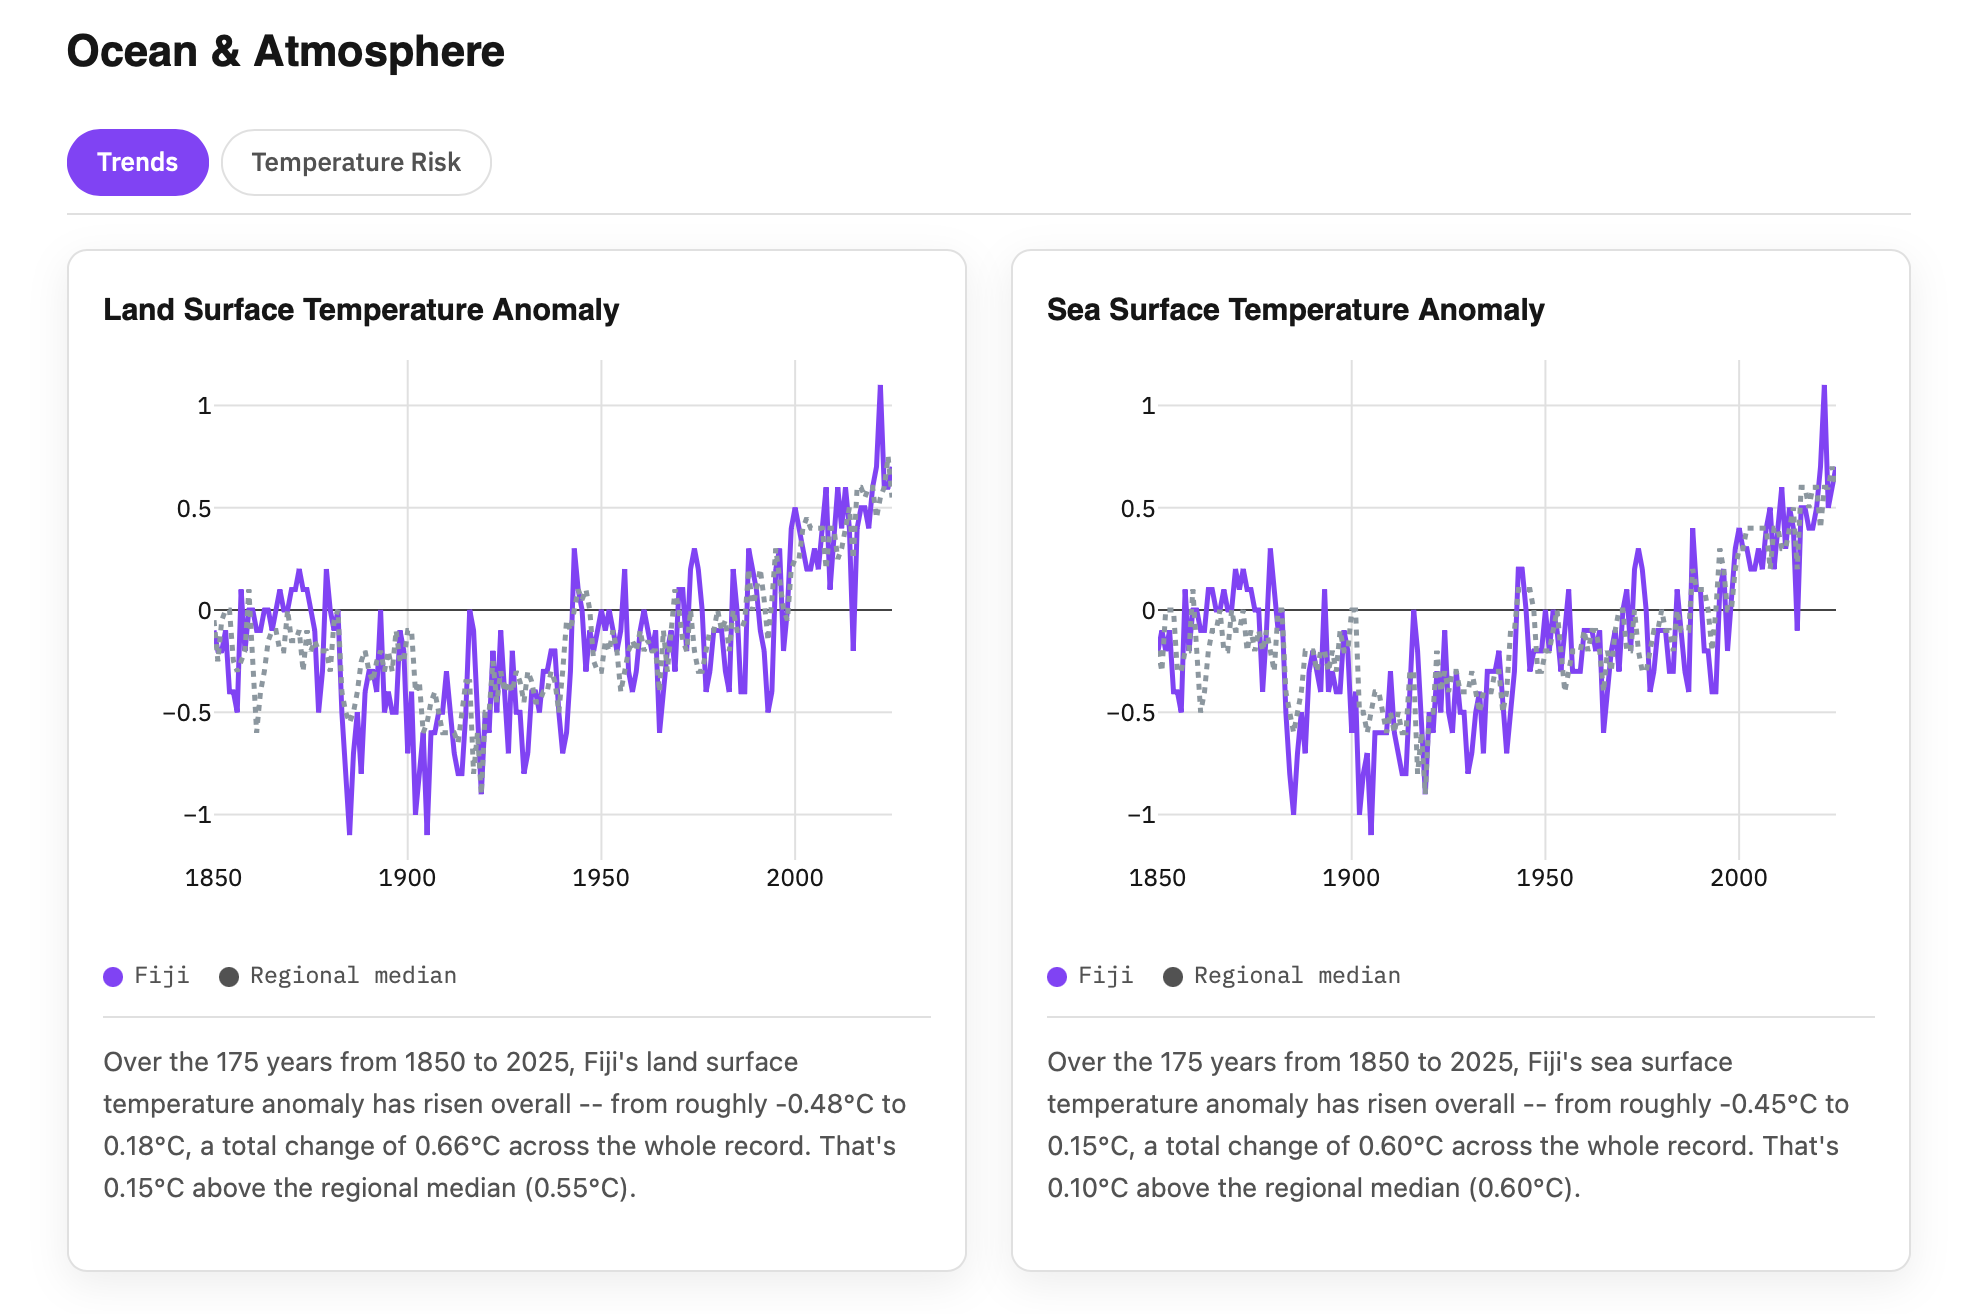
Ocean & Atmosphere Insights
-
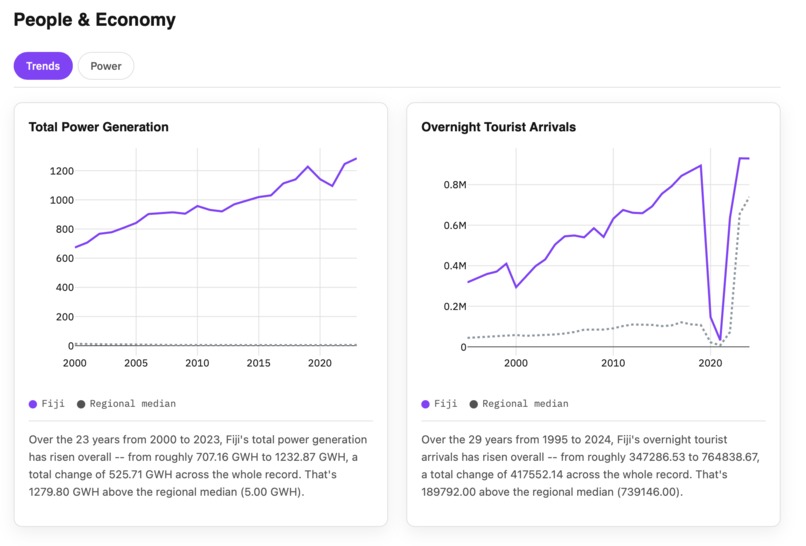
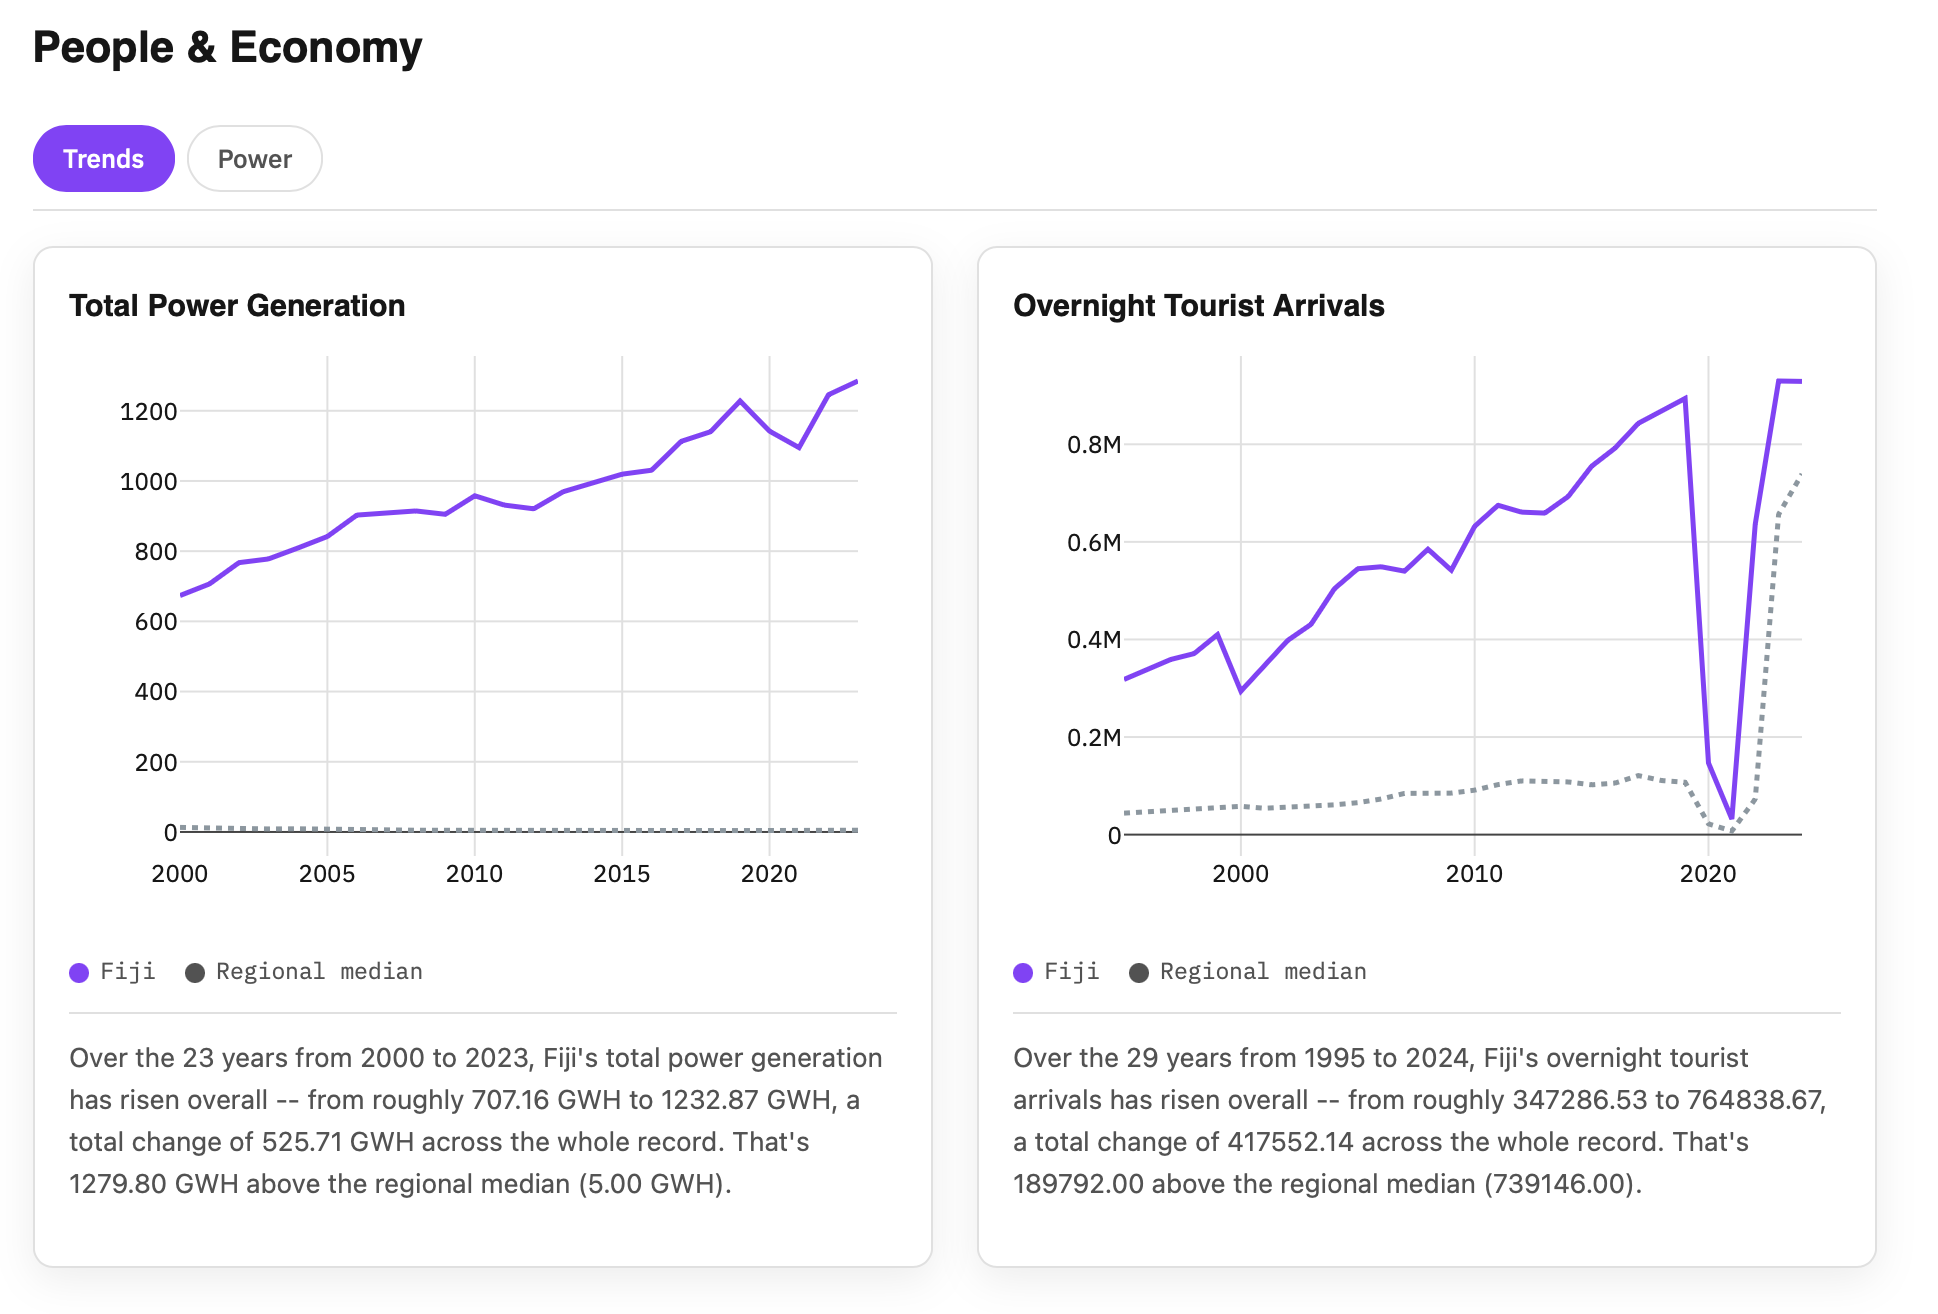
People and Economy Insights
-
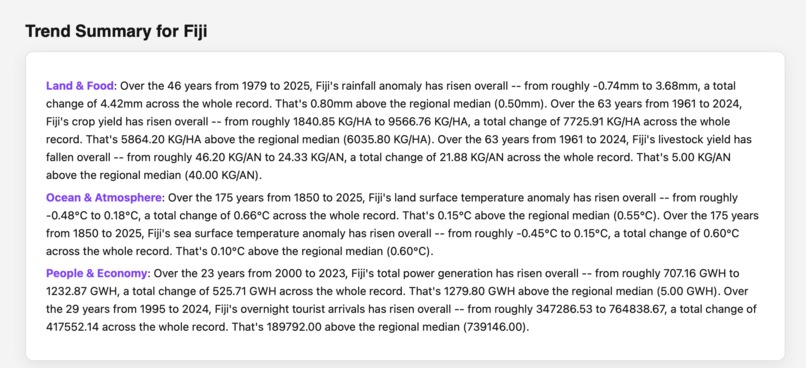
Trend Summary
-
Climate Action Steps
Inspiration
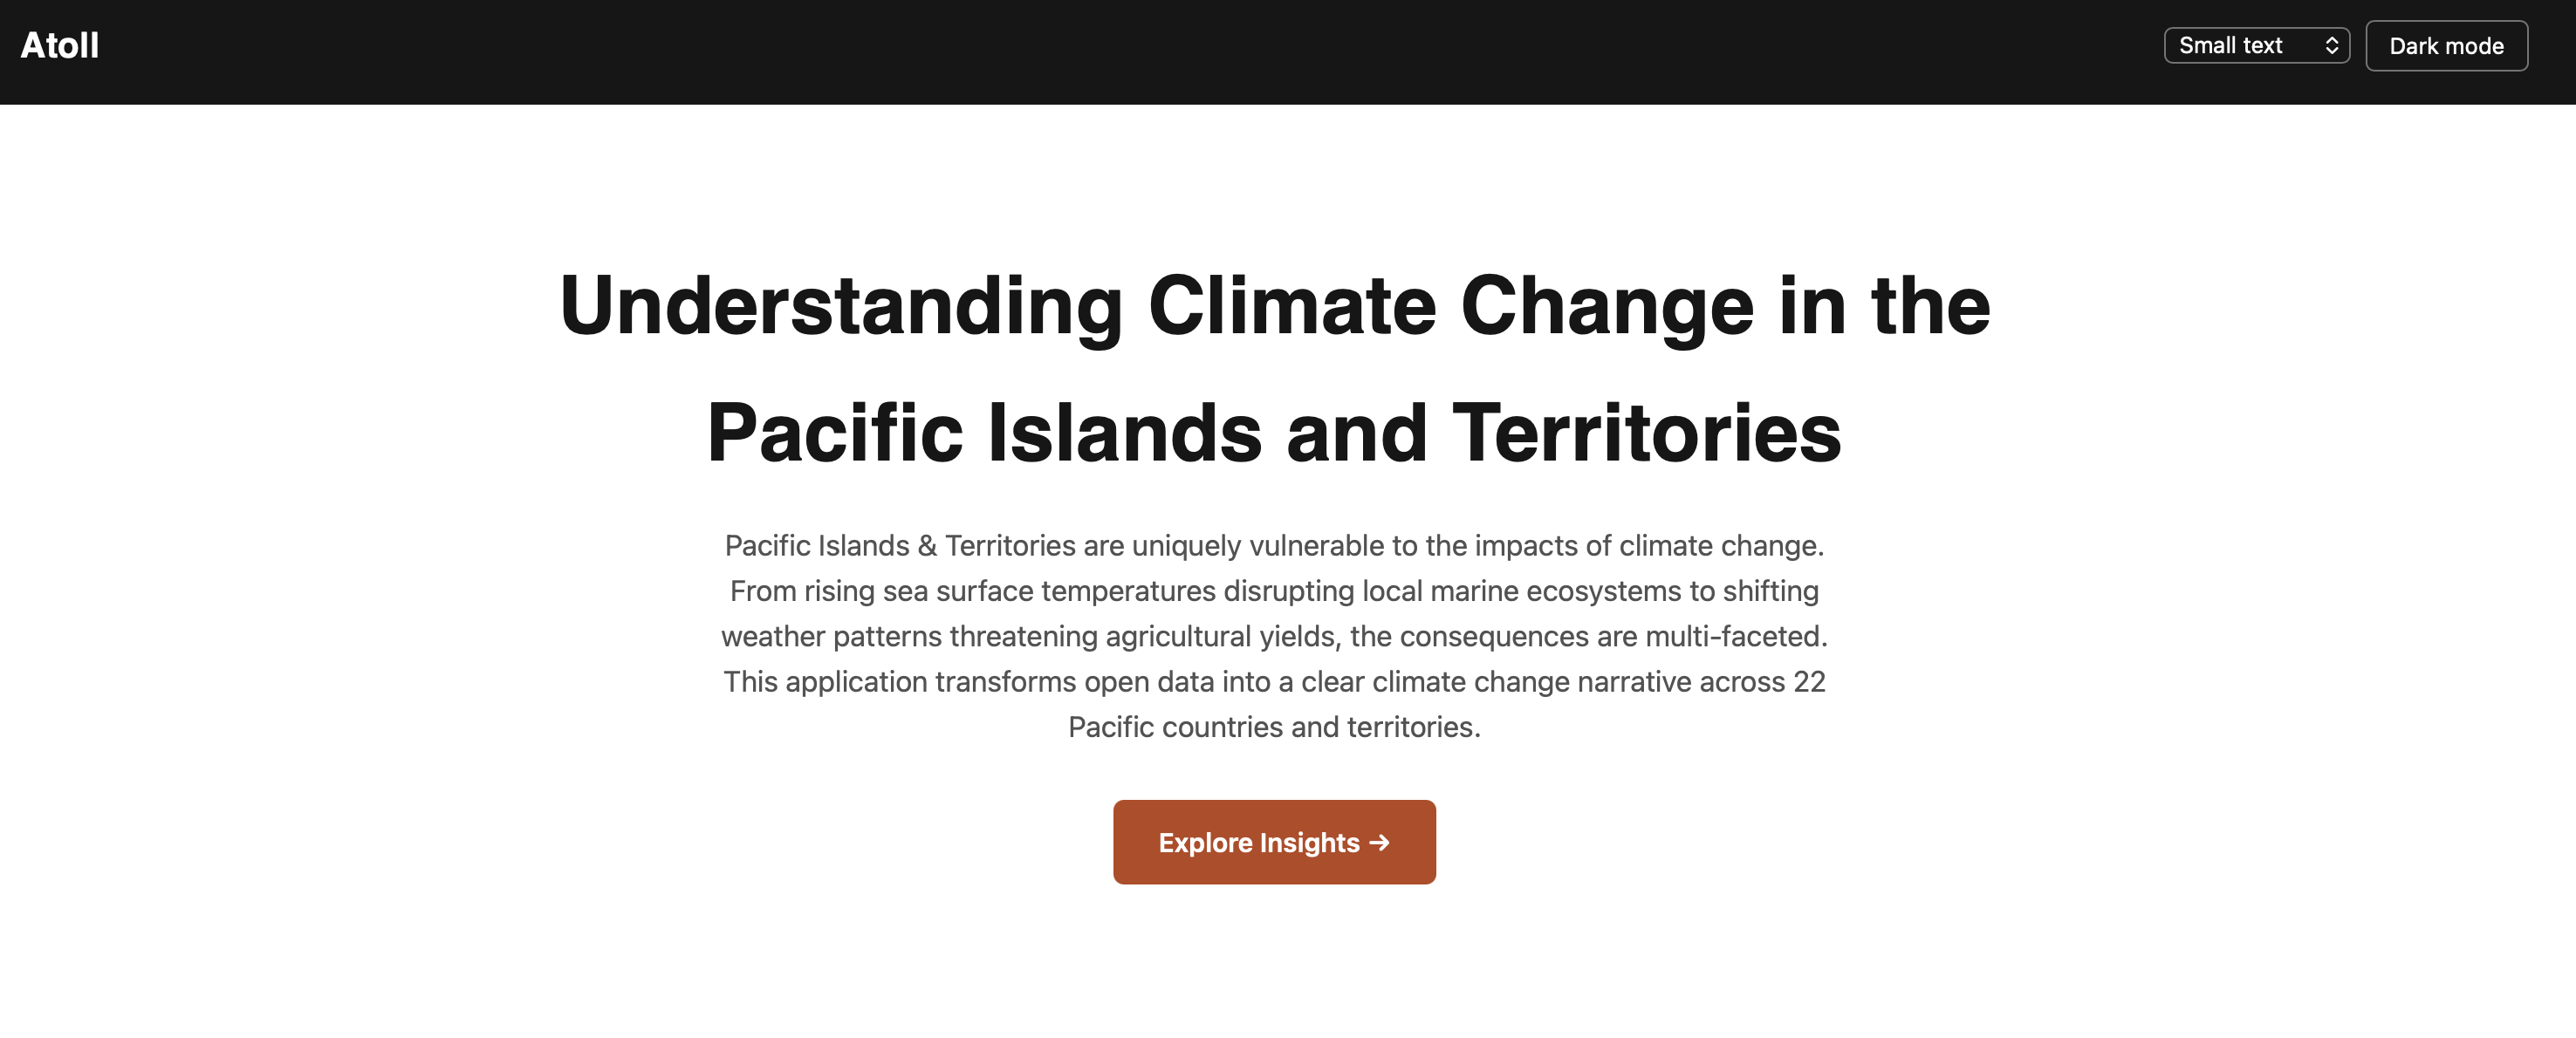
Pacific Islands & Territories are uniquely vulnerable to the impacts of climate change. From rising sea surface temperatures disrupting local marine ecosystems to shifting weather patterns threatening agricultural yields, the consequences are multi-faceted.
What it does
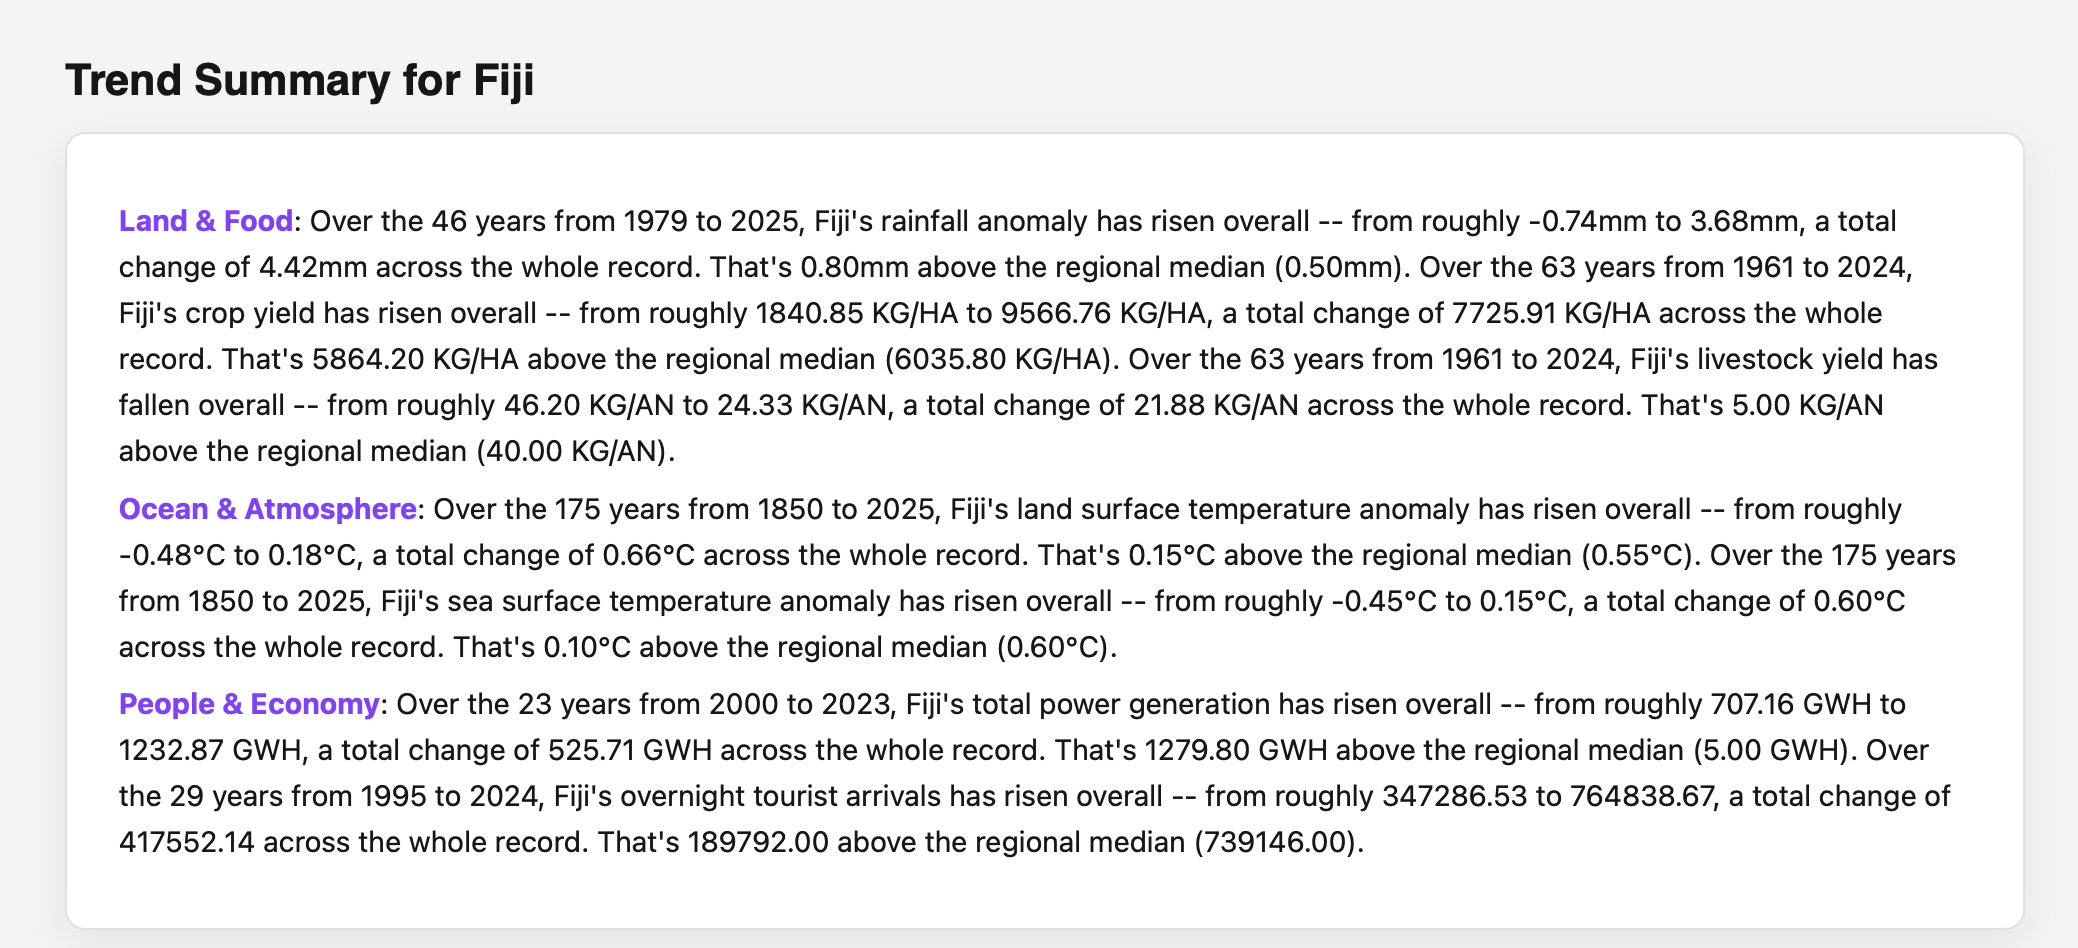
This application transforms open data into a clear climate change narrative across 22Pacific countries and territories. It leverages data from Pacific Data hub. It has 3 core pillars Land & Food, Ocean & Atmosphere and People & Economy. All 3 sections have easy to under visualizations and trend insights. It also gives the user the ability to compare another pacific region country. Furthermore, it provides a trend summary for the user. Lastly, it leverage airia.ai to generate a climate actions step for the country selected.
How we built it
I first did analysis using google collab. I experimented with different visualization approaches and insight outputs. When finalized I then used that for the main app. The main app was built using python (pandas) jinja templates, plotly and css for the front-end. For the backend it used fastAPI. Vercel was used for deployment. For the AI (LLM) part of the app I leverage airia.ai and it used claude sonnet as the underlying model.
Challenges we ran into
The main challenge I ran into was finalizing the analysis. there were so many ways I could do the analysis. I had to curb my approach and focus on getting clear insights with easy to understand visualizations
What we learned
- It was great experimenting with fastAPI and leveraging airia.ai to generate the climate action steps.
What's next for Atoll
- Improve the speed of the app
- See If I can add other visualization approaches
Built With
- airia
- fastapi

Log in or sign up for Devpost to join the conversation.