
Atmosphere - AI-Powered Environmental Health Dashboard
Inspiration
In an era where artificial intelligence transforms every facet of our lives, we recognized the immense potential of AI to address pressing environmental challenges. Environmental factors like air pollution, UV exposure, pollen levels, and wildfires have direct impacts on our health and daily activities. Inspired by the devastating wildfires in California, we envisioned an AI-driven platform that leverages advanced machine learning and large language models to provide accurate, real-time environmental insights. Our goal is to empower individuals, families, and communities with intelligent tools to make informed decisions about outdoor activities and health precautions, regardless of their location.
What It Does
Atmosphere is an AI-enhanced dashboard that delivers comprehensive environmental health data through intelligent analytics and predictive modeling:
- Air Quality Index (AQI) & pollutant breakdowns (PM2.5, PM10, NO₂, SO₂, O₃, CO)
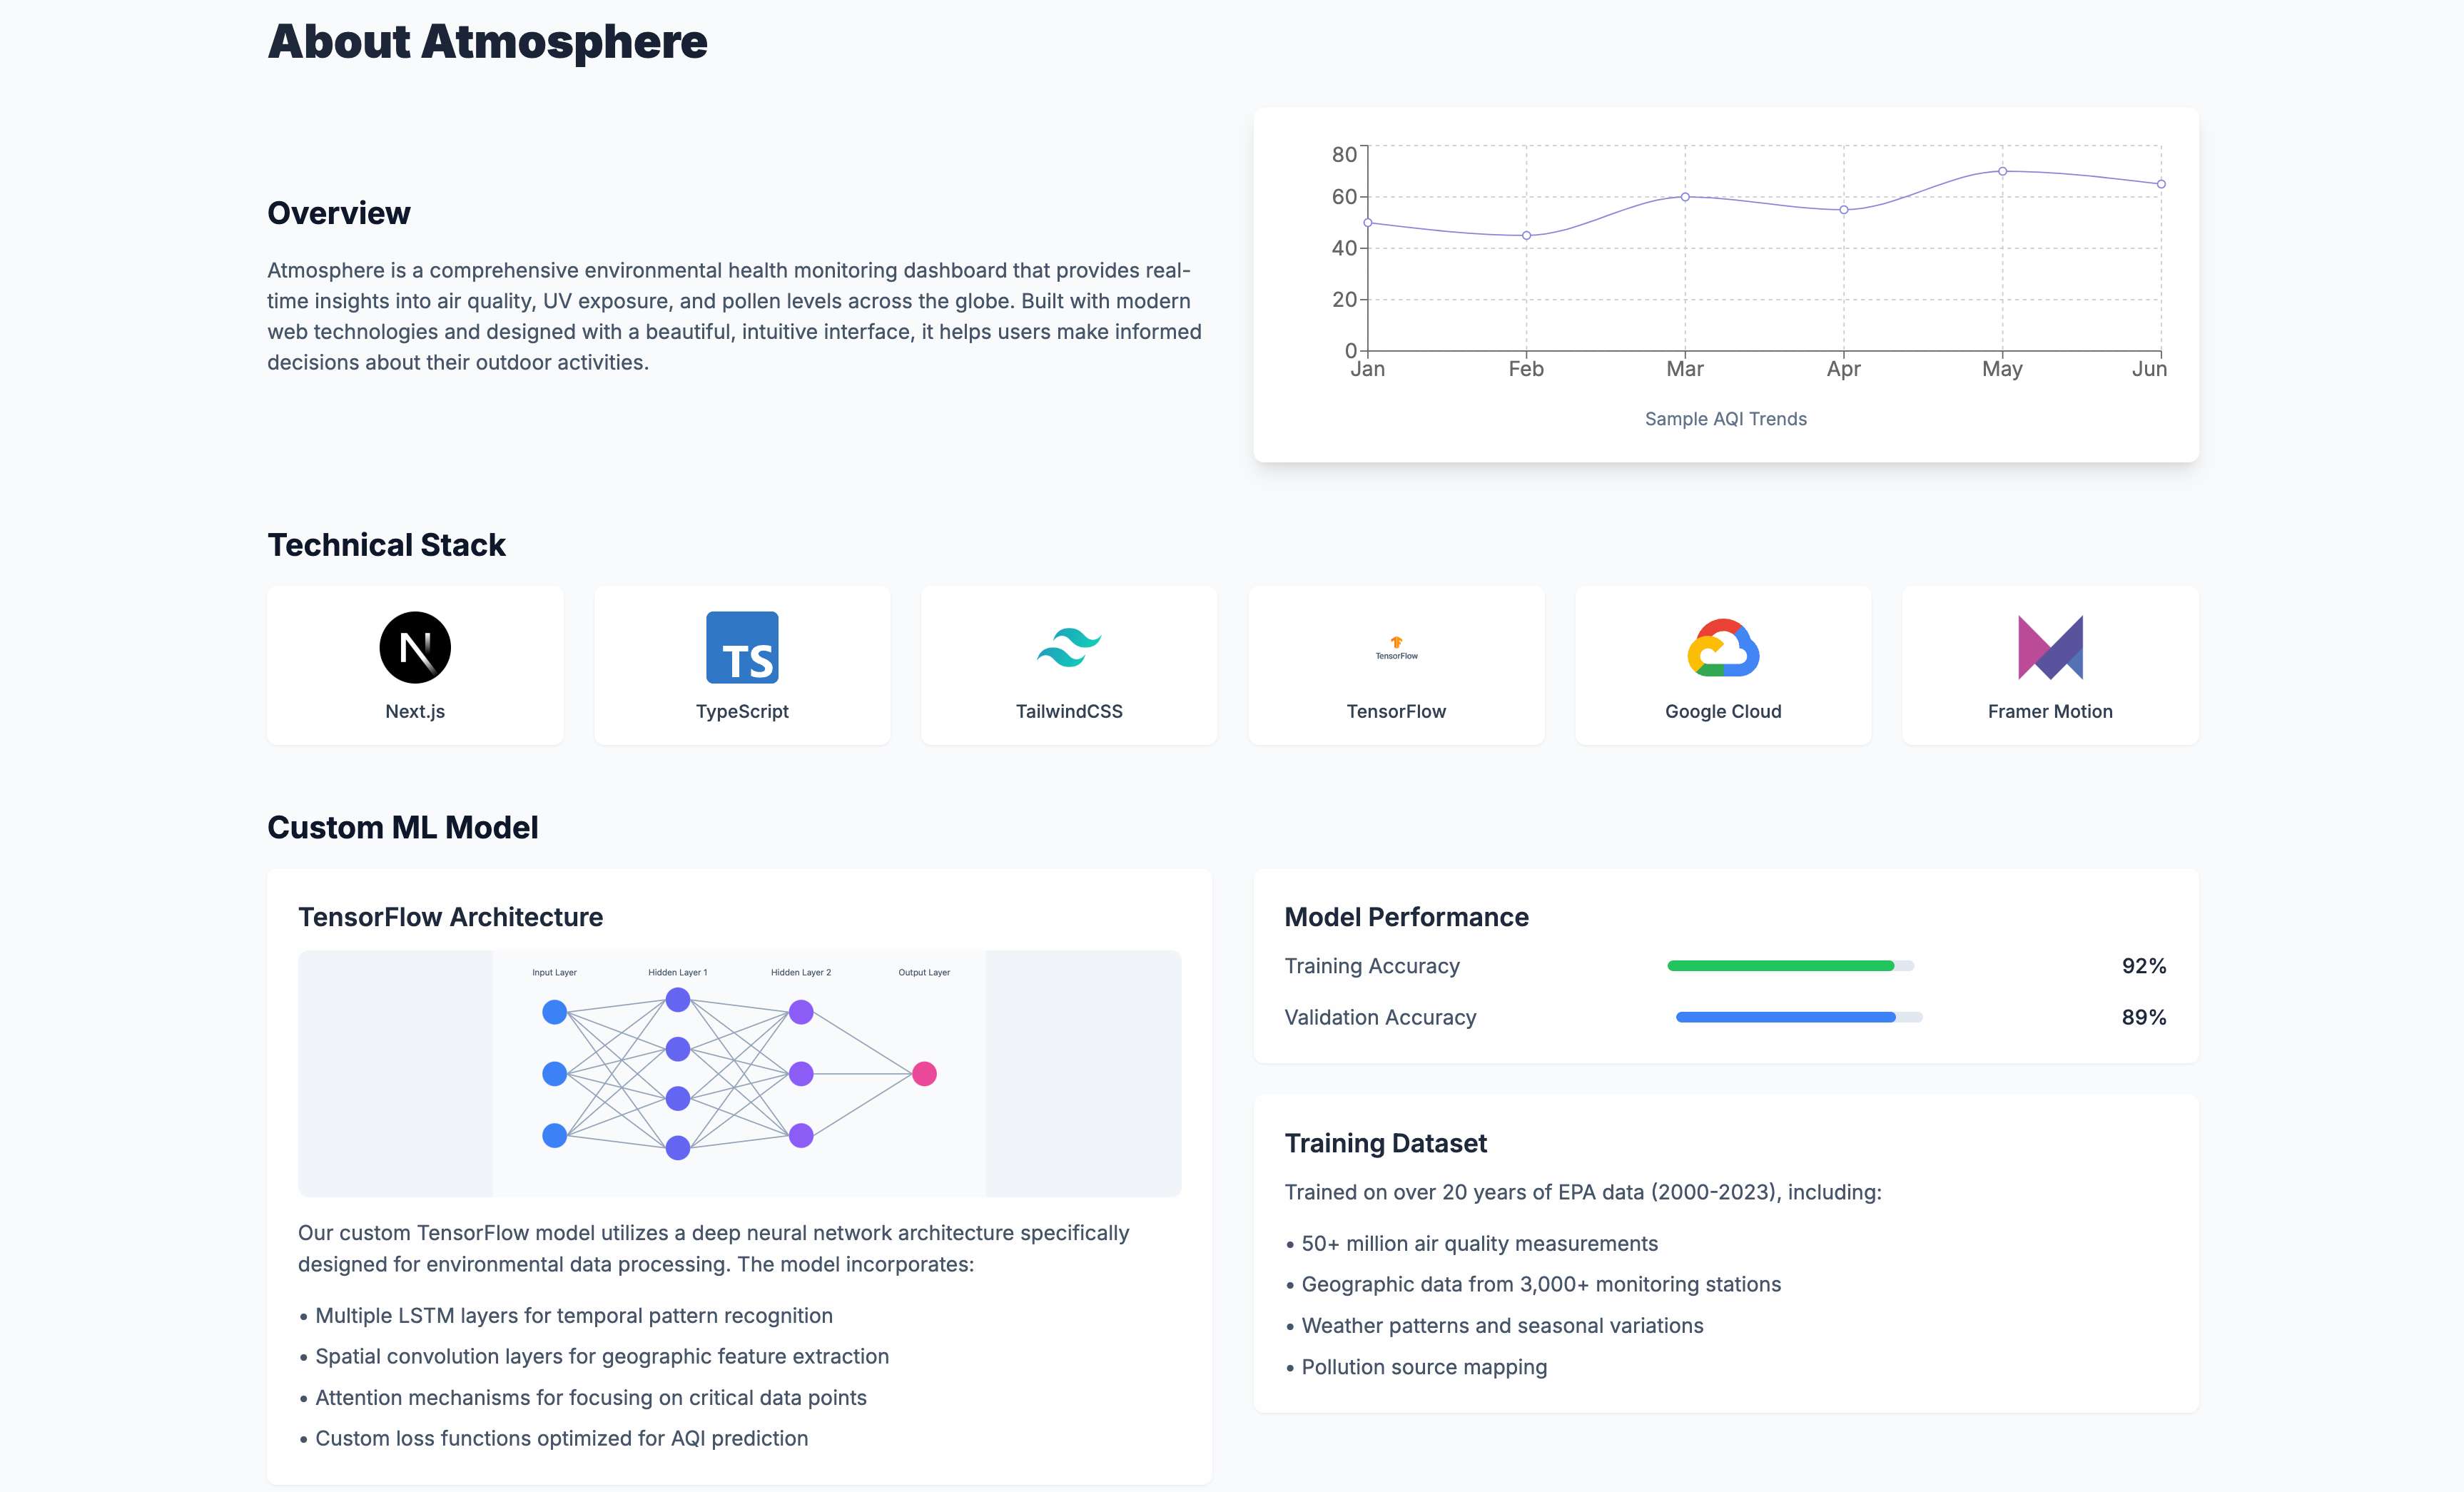
- Custom Spatiotemporal Machine Learning Model for predicting future pollutant levels using TensorFlow and trained on a custom dataset with over 600,000 parameters. Tested using verification testing and received a 98% accuracy. Verified to prevent overtraining at countless points throughout model training.
- AI-Driven Wildfire Risk Assessment powered by Google’s Gemini LLM, which ingests critical regional details—vegetation density, historical weather patterns, topography, proximity to bodies of water, and previous fire records—to generate a robust risk profile.
- Realistic Wildfire Spread Simulation displayed on an interactive map, showing how the fire could progress over time. By providing Gemini with precise environmental data, the model intelligently adapts to factors like wind speed, terrain, and vegetation density. Notably, the simulation respects natural boundaries like rivers and lakes, ensuring a highly realistic portrayal of potential fire movement.
- UV Index & Safe Exposure Times calculated through predictive models
- Pollen Level Tracking for grass, tree, and weed pollen using AI-based forecasting
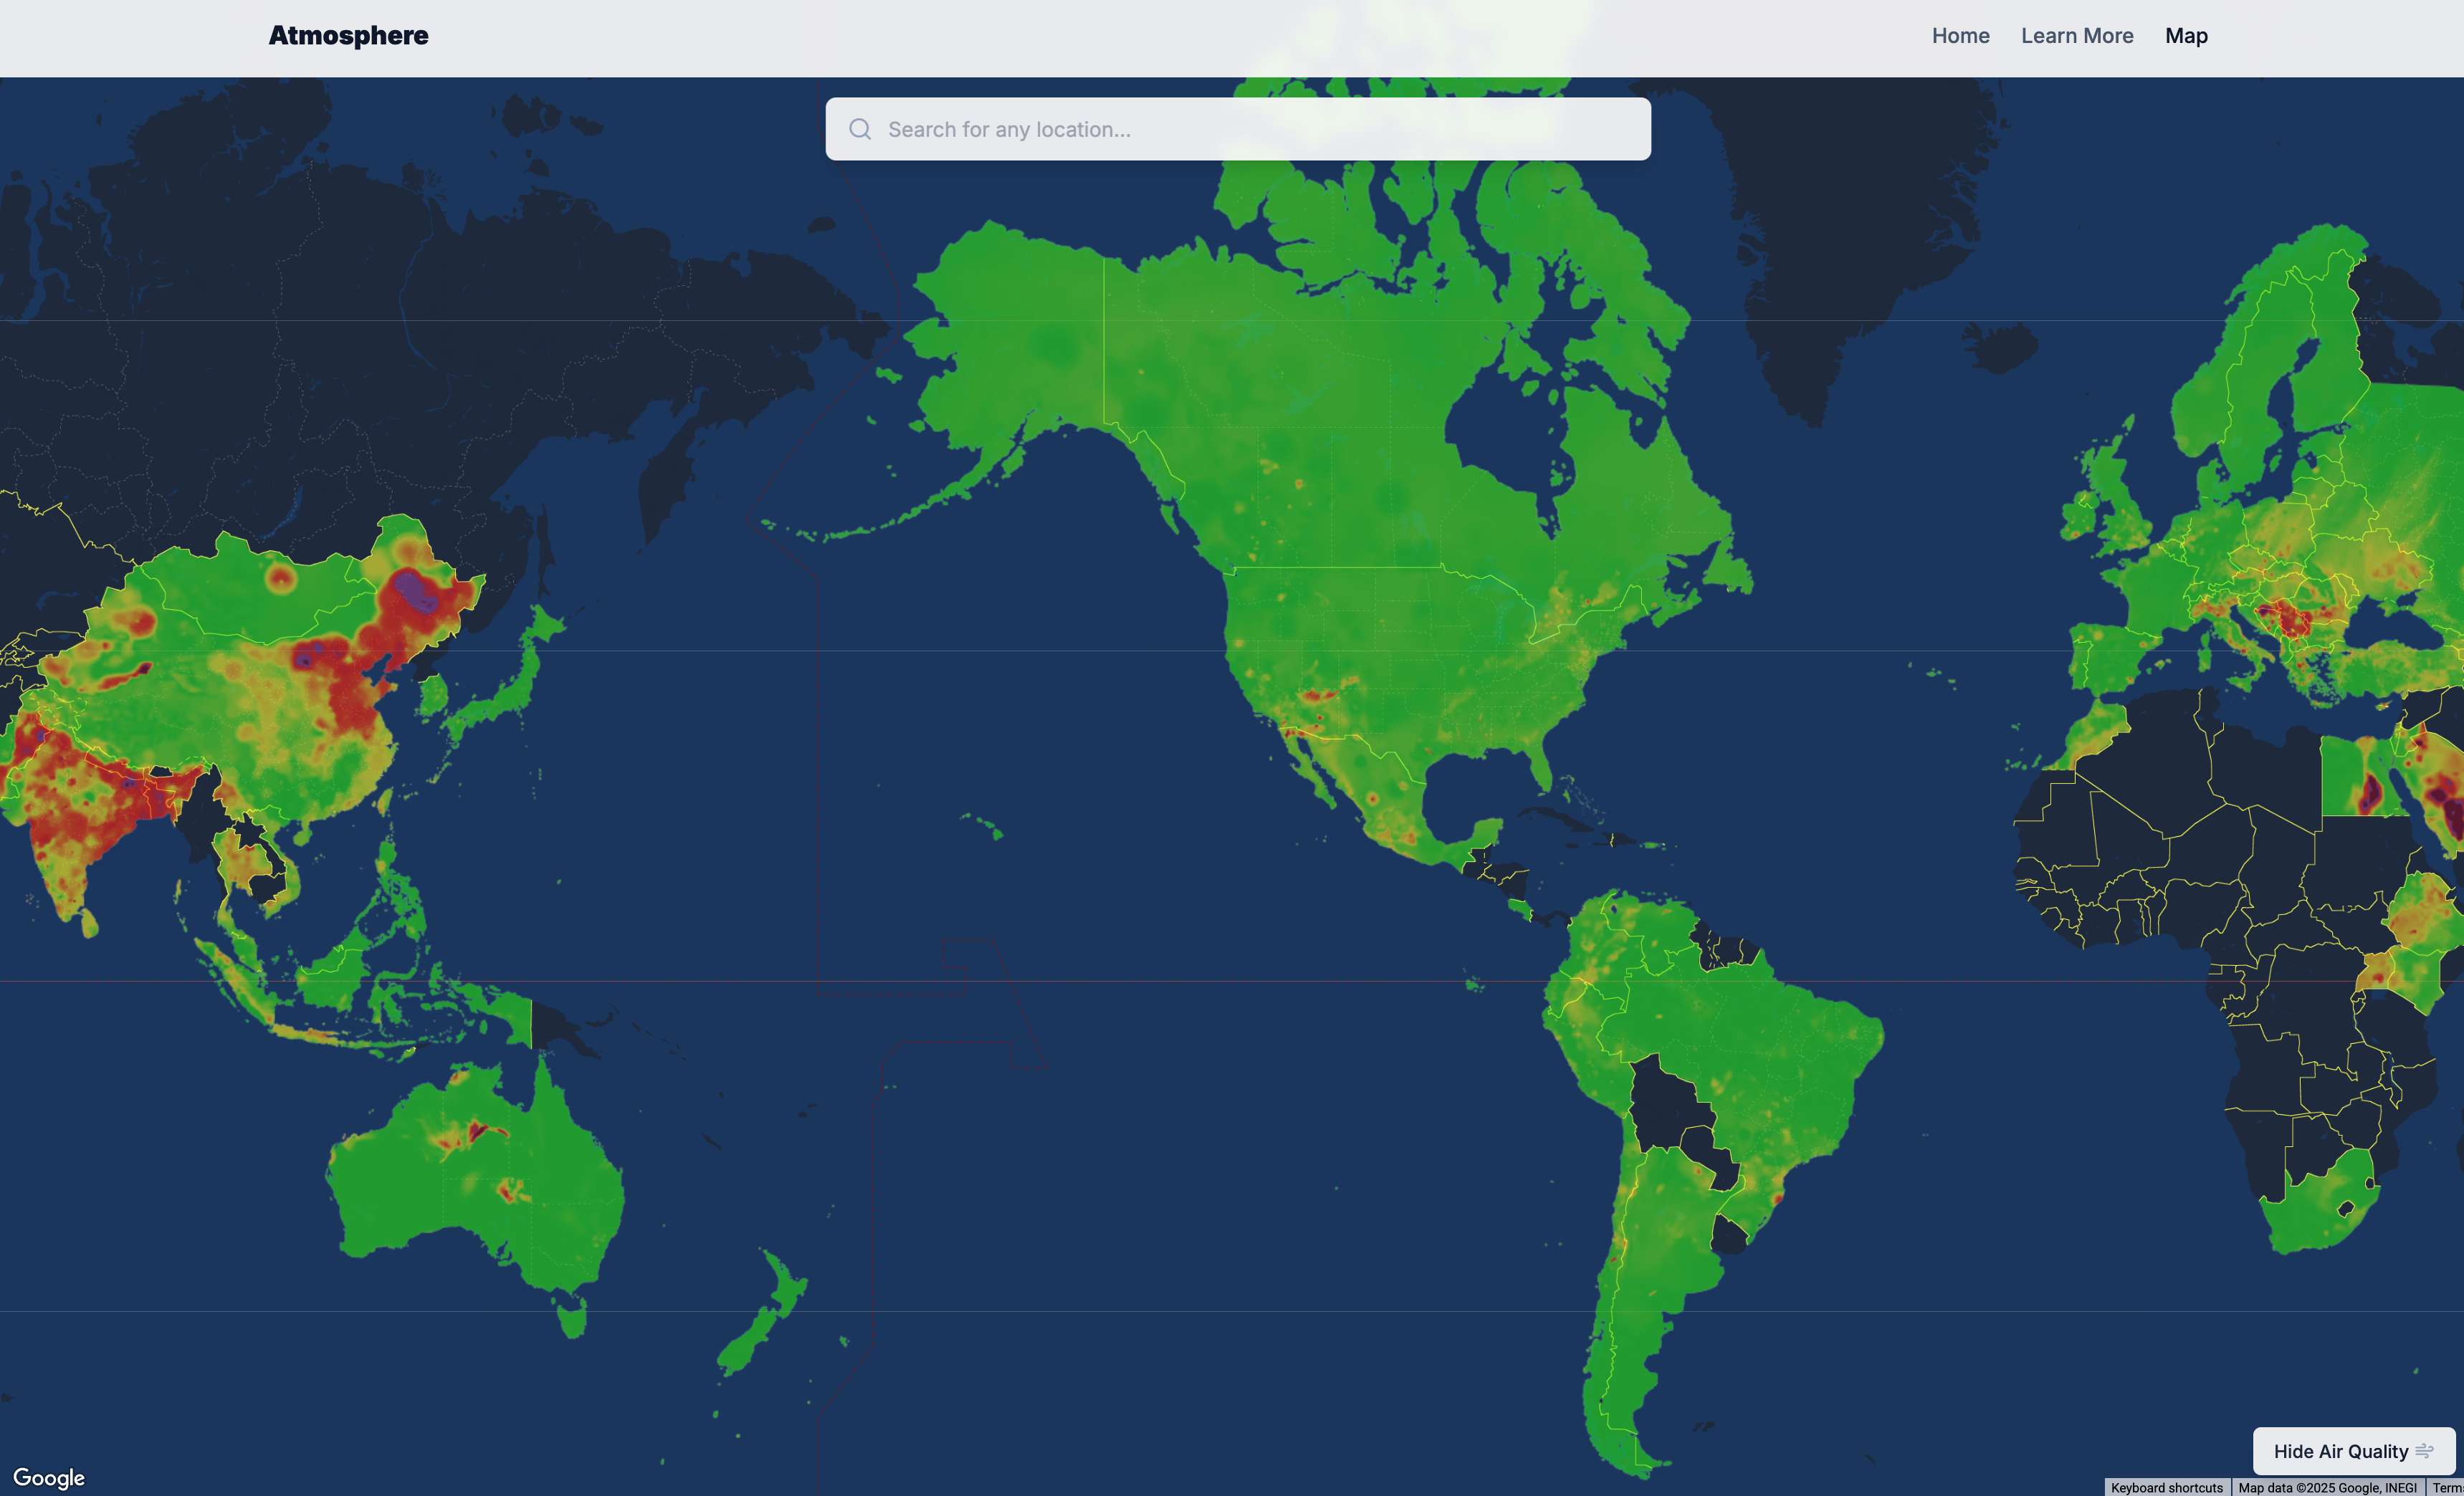
- Interactive Map with satellite/terrain hybrid views, Street View integration, and real-time AI-generated heatmaps
- Personalized Health Recommendations using AI to determine the best times for outdoor activities based on user preferences and health data
All data is synthesized and presented through an intuitive, AI-optimized interface, enabling users to act swiftly and confidently.
How We Built It
Frontend (Next.js 14 + TypeScript)
- Utilized Next.js App Router for efficient page and API organization, ensuring rapid and reliable builds.
- Designed the interface with Tailwind CSS and Radix UI components for a clean, accessible, and AI-enhanced user experience.
- Implemented interactive, AI-powered charts (via Recharts) for AQI, UV, and pollen forecasts.
Maps & Geolocation
- Integrated Google Maps JavaScript API for comprehensive global coverage.
- Employed Places Autocomplete, Geocoding, Elevation, and Street View services enhanced with AI for better accuracy.
- Applied AI-generated AQI heatmaps from the Google Air Quality API for dynamic visualization.
Machine Learning
- Custom Spatiotemporal ML Model: Developed with TensorFlow.js to forecast pollutant levels, trained on over 20 years of EPA data for O₃, CO, SO₂, and NO₂.
- Real-Time Inference: Enabled immediate predictions and health risk assessments through optimized AI pipelines.
- AI Optimization: Enhanced model performance with advanced feature engineering and architecture tuning.
Environmental Data APIs
- Google Air Quality API: Integrated for real-time AQI data with AI-driven enhancements.
- OpenUV API: Utilized for accurate UV index and safe exposure times, augmented by AI predictions.
- Tomorrow.io: Leveraged for AI-powered pollen forecasts and additional weather metrics.
Wildfire Feature
- AI-Powered Risk Assessment: Built using Google’s Gemini LLM, which ingests critical local and regional data—terrain, vegetation, weather conditions, water bodies, and historical fire patterns—to deliver highly accurate risk predictions.
- Interactive Wildfire Simulation: By feeding critical details of an area into Gemini, we allow the model to simulate potential wildfire spread on a dynamic map. This advanced LLM respects realistic boundaries (e.g., won’t traverse bodies of water) and generates time-based progressions for planning. Users can watch the simulation play out in real time, gaining insight into how a fire might evolve under changing environmental conditions.
Security & Network Infrastructure
- Cloudflare Integration: Ensured secure data transmission with AI-enhanced SSL/TLS encryption.
- DNS Management: Managed by Cloudflare for fast, reliable domain resolution, optimized by AI for enhanced access speed.
- Proxy Network: Protected infrastructure from malicious traffic and DDoS attacks using Cloudflare’s AI-driven proxy network, ensuring high availability.
- Performance Optimization: Utilized Cloudflare’s AI-powered CDN services to cache static assets globally, reducing latency and improving load times.
Challenges We Ran Into
- Data Integration: Combining multiple APIs and datasets (AQI, UV, pollen, fire data) in real time required sophisticated AI-driven error handling and data harmonization.
- ML Model Training: Training on a vast historical dataset (20+ years) for pollutant levels demanded significant computational resources and AI optimization techniques.
- Performance & Scalability: Ensuring responsive, AI-enhanced visualization of global datasets on an interactive map posed scalability challenges.
- Accurate Wildfire Modeling: Integrating multiple factors (terrain, weather, vegetation) into dynamic AI simulations required meticulous calibration to maintain model reliability.
Accomplishments That We’re Proud Of
- AI-Integrated Dashboard: Seamlessly combined AQI, pollen, UV index, and wildfire data into a unified, AI-enhanced platform.
- Custom ML Forecasting: Developed and deployed a spatiotemporal neural network model with TensorFlow that delivers precise, real-time air quality predictions.
- Wildfire Simulation: Built an AI-driven interactive tool that visualizes potential fire spread, taking environment, water boundaries, and terrain into account.
- Advanced UI/UX: Achieved a sophisticated, AI-optimized design that makes complex environmental data accessible and actionable for all users.
What We Learned
- Cross-Functional Coordination: Merging frontend, backend, ML, and third-party APIs highlighted the critical role of AI in seamless project integration.
- ML Pipelines in Production: Gained deep insights into building, training, and deploying AI models within production environments.
- Importance of Data Quality: Recognized that high-quality, well-structured data is essential for reliable AI analytics and predictions, especially for critical applications like wildfire forecasting.
- Scaling Real-Time AI Applications: Explored various AI-driven strategies for caching, API rate-limiting, and performance optimization to support a global user base.
What’s Next for Atmosphere
- Mobile App: Develop AI-enhanced iOS and Android applications for real-time alerts and monitoring on the go.
- Push Notifications: Implement AI-driven live notifications for when air quality, pollen, or wildfire risk exceeds predefined thresholds.
- Personal Health Profiles: Introduce AI-based personalization allowing users to input health conditions (e.g., asthma, allergies) for customized recommendations.
- Community & Social Features: Foster a community-driven approach with AI-enabled sharing of local observations, tips, and alerts to enhance environmental awareness.
- Enhanced Historical Analysis: Provide advanced AI-powered historical trend visualizations and deeper analytics for researchers and policymakers.
We hope Atmosphere makes environmental data accessible, actionable, and intelligently engaging. By integrating real-time metrics, predictive AI insights, and community-driven information, we aim to help everyone stay safe, healthy, and well-informed—especially when facing challenges like the California wildfires that inspired our project from the outset.
Built With
- gemini
- google-maps
- machine-learning
- nextjs
- openuv-api
- radix-ui
- tailwind
- tailwind-css
- tensorflow
- typescript


Log in or sign up for Devpost to join the conversation.