-
-
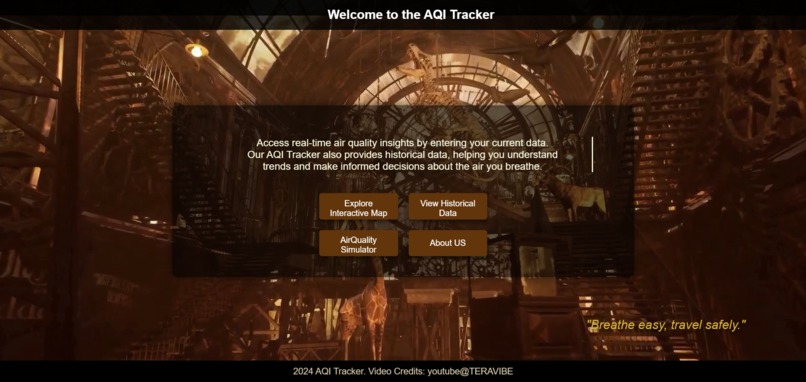
Home Page
-
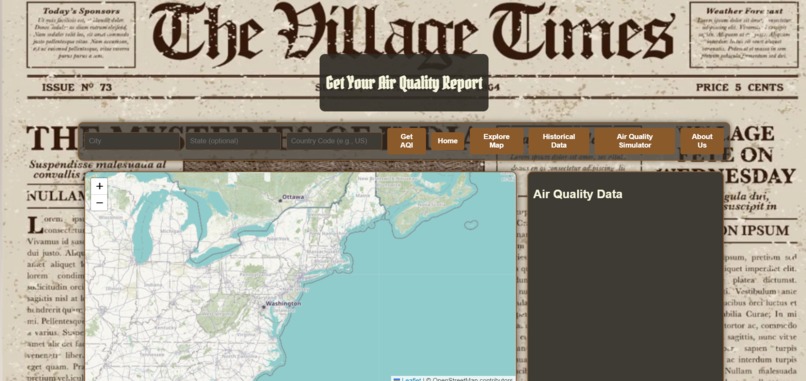
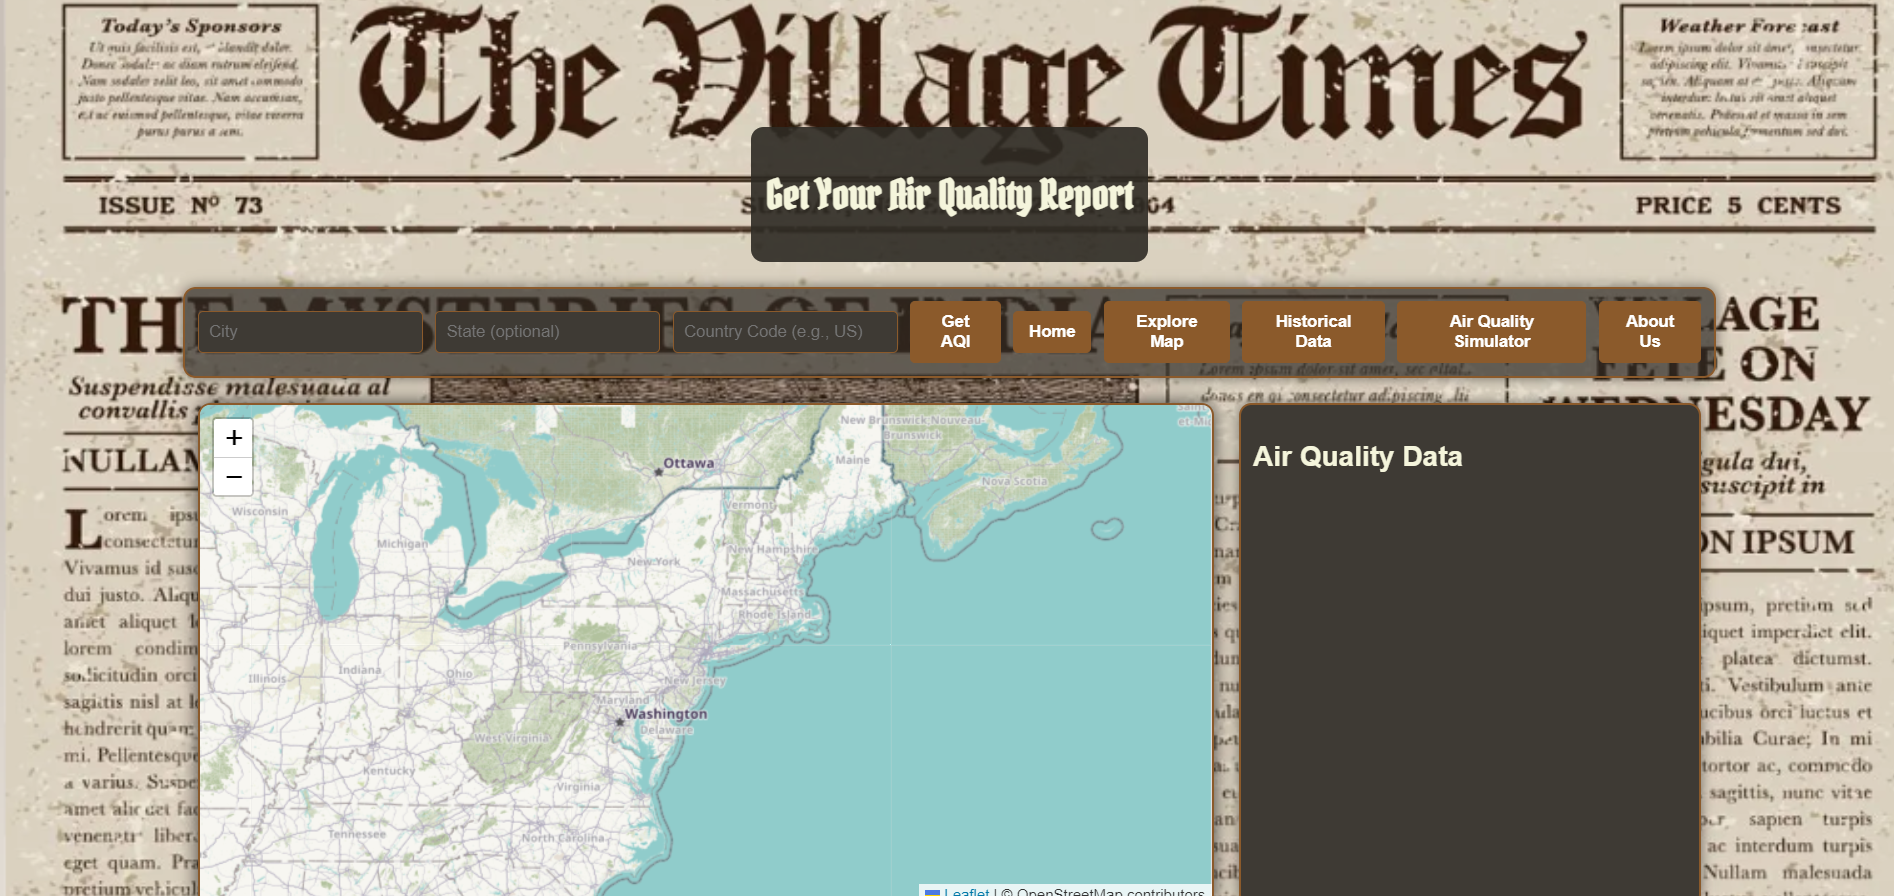
Air Quality Checker
-
-


Inspiration
Our goal was to create an Air Quality Index Tracker to address the growing air pollution crisis. We wanted to make an interactive tool that allows the user to engage and understand air pollution metrics. We hope that the AQI Tracker allows users to gain insights on Air pollution in different regions.
What it does
Users can view the AQI Index for their current location and also different regions across the world. In the historical data tab, users can input a previous date and time to get historical trends
How we built it
We used the OpenWeatherMap API to get the data and flask to deploy the program. We used online videos and resources to learn how to integrate APIs with our website.
Challenges we ran into
We had a lot of trouble deploying the website as well as connecting the different features together. In regards to integrating the different features, we had to spend extra time making sure the features work as intended and don't disrupt the rest of the files.
Accomplishments that we're proud of
We are proud that we learned about APIs and made a themed UI for the user to have an engaging and interactive experience.
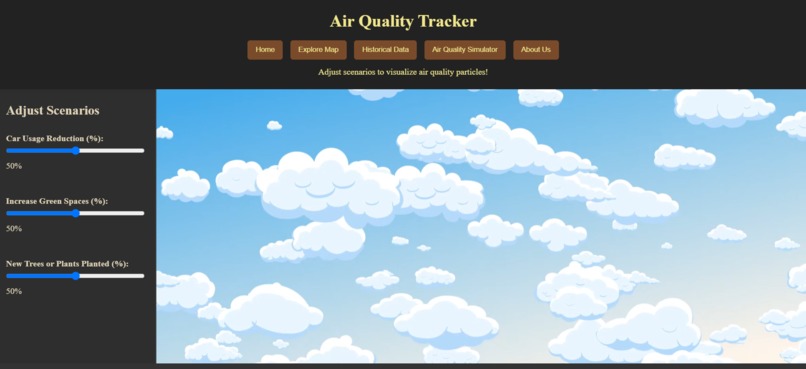
What's next for Atmosflect
We hope to add more features in the future and also finish our Air Quality Simulator with the different toggles. This would allow for the user to gain a deeper understanding of how their daily activities such as car usage affects the air quality.

Log in or sign up for Devpost to join the conversation.