Atmos: Real-Time Global Atmospheric Visualization Platform
Inspiration
With climate change and air quality becoming increasingly critical global issues, I wanted to create a tool that makes atmospheric data accessible and understandable to everyone. Inspired by the need for real-time environmental monitoring and the complexity of existing scientific data visualization tools, I set out to build a platform that transforms raw satellite data into beautiful, interactive visualizations that anyone can explore and understand.
What it does
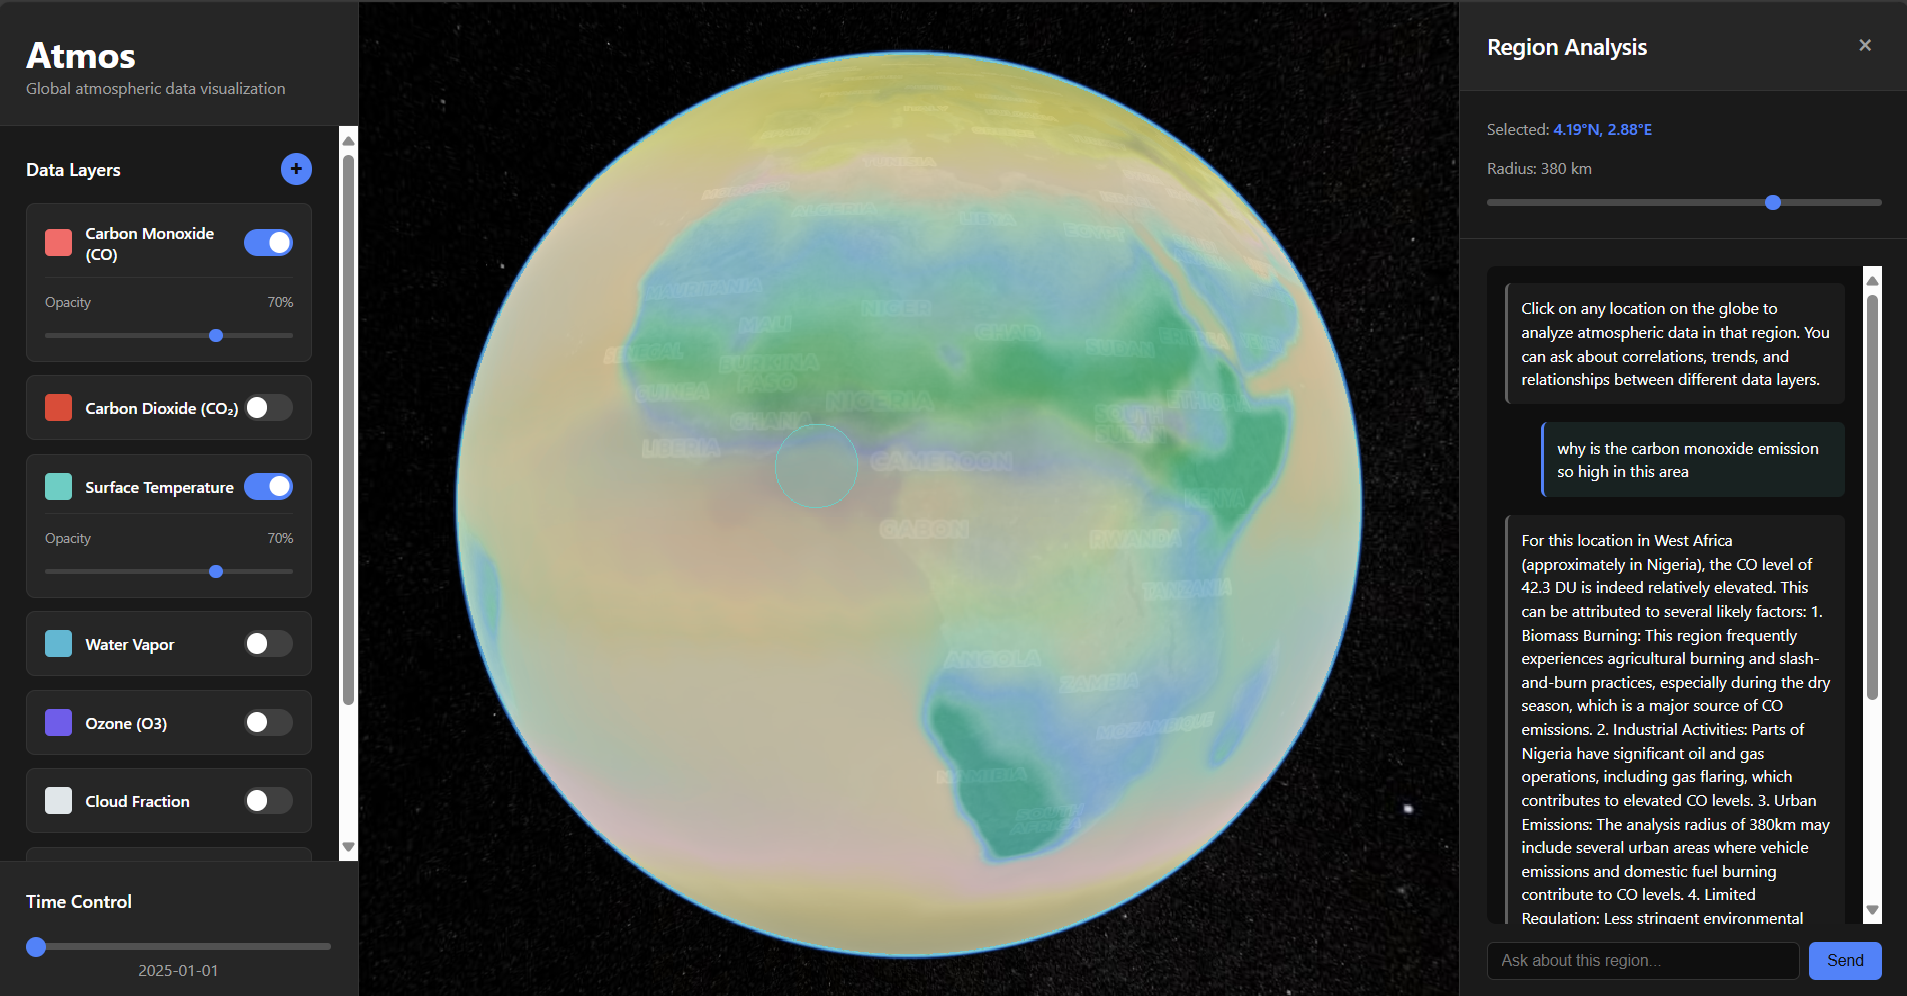
Atmos is a web-based platform that visualizes real-time atmospheric data from NASA's AIRS (Atmospheric Infrared Sounder) satellite on an interactive 3D globe. Users can:
- Explore Multiple Data Layers: Toggle between 7+ atmospheric parameters including CO₂, temperature, water vapor, ozone, methane, and carbon monoxide
- Analyze Regional Data: Click anywhere on the globe to select a region and chat with an AI assistant about atmospheric conditions, correlations, and trends
- Import Custom Data: Upload their own HDF satellite data files to visualize additional atmospheric parameters
- Track Satellites: View real-time positions of Earth observation satellites
- Understand Through Context: Each data layer includes detailed information about what it represents and why it matters
How I built it
My tech stack leverages modern web technologies for a seamless experience:
- Frontend: Vite + Vanilla JavaScript for a fast, responsive interface
- 3D Visualization: CesiumJS for the interactive globe and satellite tracking
- Data Processing: Python scripts using NetCDF4, rasterio, and scipy to process raw HDF files into web-friendly tiles
- Backend: Flask server for tile serving and API proxy
- AI Integration: Claude API for intelligent regional analysis
- Deployment: The frontend runs on any modern browser while the backend serves pre-processed tiles
The data pipeline transforms massive HDF files (100-400MB each) into optimized PNG tiles using geographic tiling schemes, enabling smooth visualization of global datasets.
Challenges I ran into
- Data Complexity: NASA's AIRS data comes in complex HDF4/HDF5 formats with hundreds of variables. I had to build custom extractors for each atmospheric parameter.
- Performance: Rendering high-resolution global data smoothly required implementing tile-based streaming and multiple zoom levels.
- Scale: Managing gigabytes of tile data and ensuring fast load times across different zoom levels was challenging.
- Color Mapping: Creating intuitive, scientifically accurate color schemes for different atmospheric parameters that are both beautiful and informative.
Accomplishments that I'm proud of
- Seamless Integration: Successfully combined multiple complex technologies (Cesium, satellite data, AI) into a cohesive user experience
- Real Science: The platform uses actual NASA satellite data, making real atmospheric science accessible to everyone
- Beautiful Visualization: The smooth tile rendering and carefully designed color schemes create stunning visualizations of our planet's atmosphere
- AI-Powered Insights: The regional analysis feature provides context-aware explanations of atmospheric phenomena
What I learned
- Satellite Data Processing: How to work with scientific data formats (HDF, NetCDF) and transform them for web visualization
- Geospatial Programming: Understanding map projections, tile schemes, and coordinate systems
- WebGL & 3D Graphics: Using CesiumJS for high-performance globe rendering
- Data Visualization: The importance of color choice and scale in representing scientific data
- System Architecture: Building a data pipeline from raw satellite files to interactive web visualization
What's next for Atmos
- Real-time Data Integration: Connect to live satellite feeds for up-to-the-minute atmospheric conditions
- Time Series Analysis: Add playback controls to visualize atmospheric changes over days, months, and years
- Mobile Optimization: Enhance the experience for mobile devices
- Community Features: Allow scientists and researchers to share custom datasets and analyses
- Predictive Modeling: Integrate ML models to forecast atmospheric conditions
- Educational Content: Add guided tours and educational modules about atmospheric science
- Extended Data Sources: Incorporate data from multiple satellites and ground stations for comprehensive coverage
Built With
- cesium
- claude
- nasa-earthdata
- nextjs
- python

Log in or sign up for Devpost to join the conversation.