-
-
Atlas Logo: Your Map to Financial Transparency
-
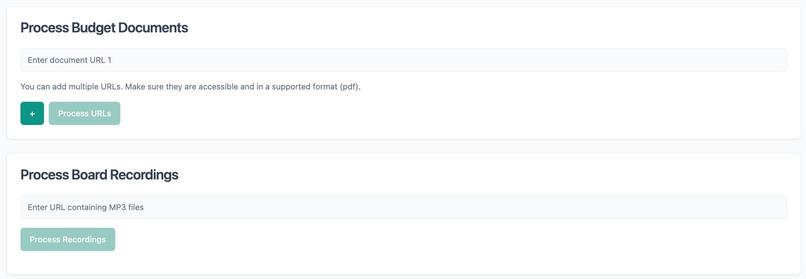
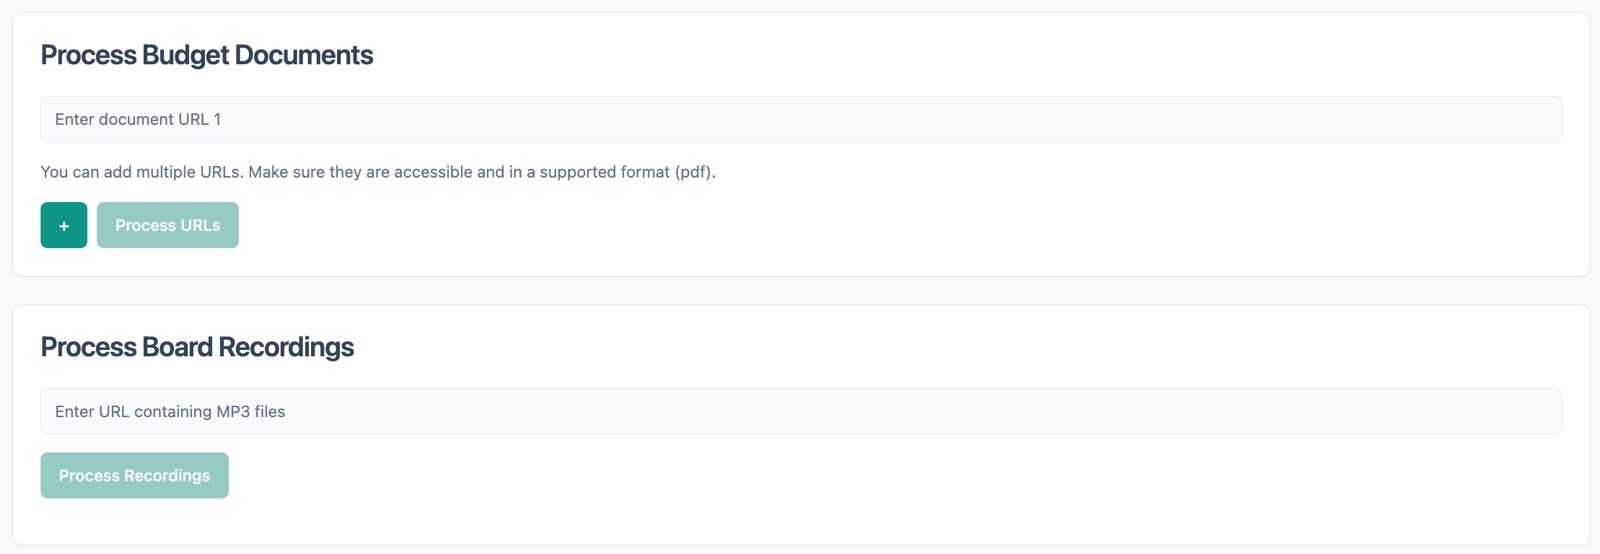
You can add in your PDF url files and board meeting recordings urls.
-

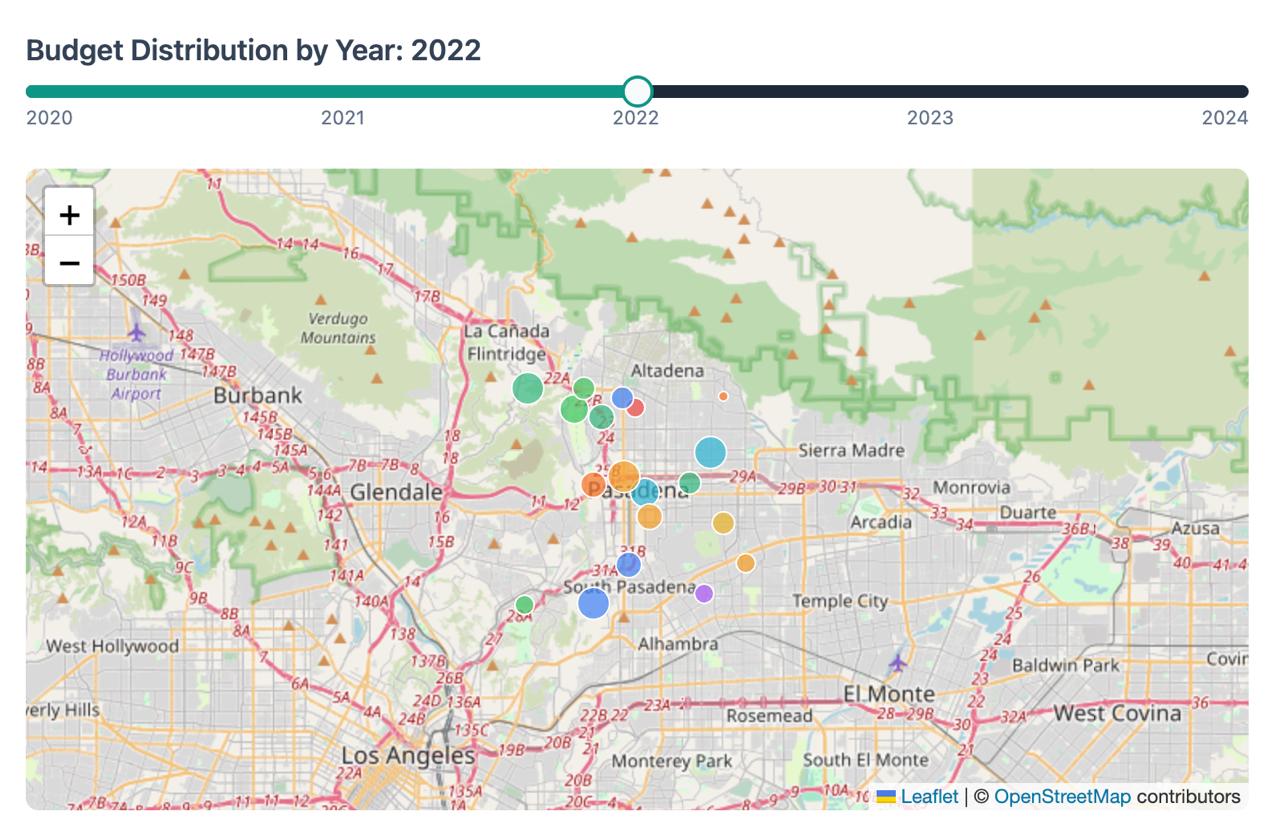
Budget Distribution Interactive Map
-
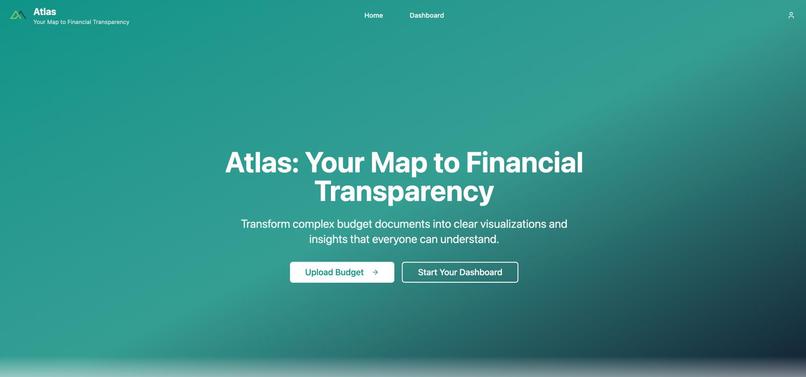
Atlas Frontend
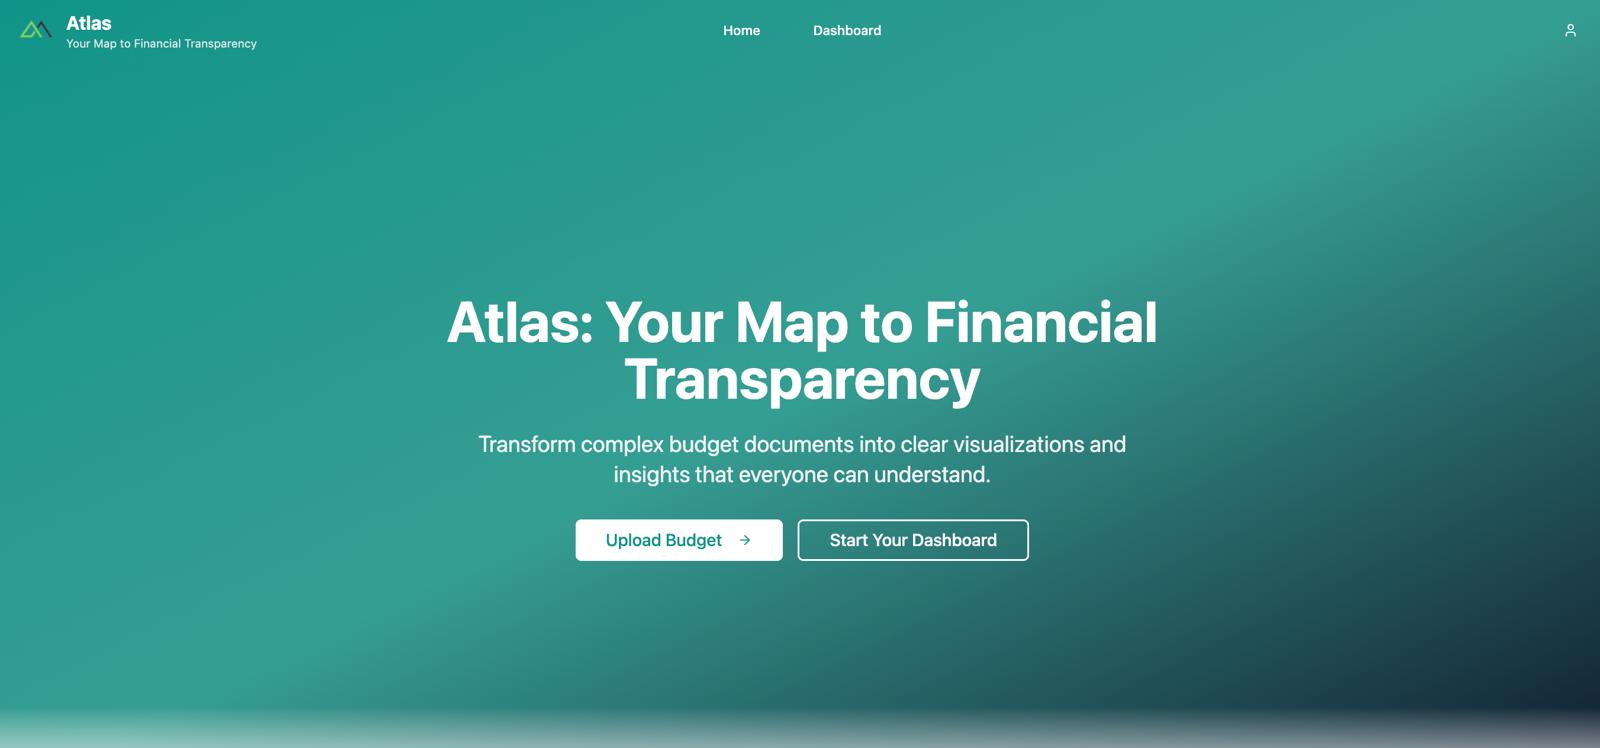
Atlas: Your Map to Financial Transparency.
What is Atlas?
With Atlas, financial transparency isn’t buried in PDFs and hours of video—it’s visual, and at your fingertips. Atlas is a platform that transforms complex government budget documents and board meeting videos into clear, interactive visualizations. It automatically extracts key financial details, maps out funding movements over time on an interactive map, enables conversational queries over meeting archives, and analyzes public sentiment—all with an intuitive interface. Atlas empowers citizens, officials, and journalists to navigate public finance with unprecedented clarity.
Atlas is an all-in-one platform that:
- Automatically extracts financial data and creates interactive tools from PDF budget documents
- Visualizes these documents through interactive charts, maps, and time-series views
- Processes videos to make meetings searchable and connectable to budget items
- Enables geographic insights through interactive maps showing spending in different regions
- Provides temporal analysis to track budget changes over multiple years
Our interactive dashboard is built with React, TypeScript, and Tailwind CSS to present the data in an intuitive way. Our media processing system handles visual and audio from board meetings, making governance more transparent.
Using Orkes
In fact, all of our workflows are fully built out using Orkes. In particular, we have four different workflows, for:
- PDF data extraction and processing
- Video processing by capturing the video embeddings
- Querying our video vector embeddings, acting as a search engine for users
- Sentiment analysis for determining the sentiment of budgeting videos
Why Atlas? Our Inspiration for this Financial Interpretability Tool
Every single person on this team has been in a position that dealt with government budgeting and a need for transparency.
Anaïs was a Student Member of the Cambridge Public School Board, where the board frequently faces budgeting issues, such as the 5 to 2 vote in the recent budget decision (https://www.thecrimson.com/article/2025/4/2/cambridge-school-committee-budget/)
Jaden was a Student Trustee on the Ottawa Catholic School Board (https://www.ocsb.ca/2023/09/13/new-school-year-new-perspectives-welcoming-nyanhail-domac-and-jaden-zhang-as-student-trustees/). Jaden noticed that the taxes were defaulted given to public schools, but often students’ families did not know about this budgeting, causing Catholic schools to receive less funding.
Atharva was the finance head of his Undergraduate Department Club for Computer Science. Atharva was an instrumental member of this committee, because he provided feedback into how to distribute funds to students in the computer science department.
Iban was the first in his family to attend university, and is grateful for the ability to obtain a scholarship from the government. This gift demonstrates the importance of government funding and spending efficiency.
Our team noticed problematic aspects with how public budgets are currently processed and understood, and wanted to also make it more accessible for members of the public. In particular:
- Complexity barrier: Budget documents are often hundreds of pages of dense financial jargon that most citizens do not have the time or desire to parse.
- Disconnected context: Budget decisions happen in meetings, but the recordings and documents exist separately often with no clear connections.
- Limited visualization: Most budget data remains in static tables rather than being presented in interactive formats such as maps, graphs, and pie charts.
Atlas is a solution that transforms complex budget documents into visualizations that anyone can understand, making government spending transparent and accessible for all citizens.
How We Built Atlas
Tech Stack
- Frontend: React, TypeScript, Tailwind CSS, shadcn/ui components.
- Data Visualization: Recharts (https://recharts.org/en-US) was used for creating interactive charts.
- Maps: React-Leaflet was leveraged for geographic budget distribution.
- Authentication: Supabase for user management and as our database.
- API Integration: Vercel serverless functions.
- AI Processing: LLM API for extracting budget data from PDFs.
- Workflow Orchestration: Orkes Conductor for managing the data processing pipeline.
Architecture
The application follows a modern architecture with several key components:
Document Processing Pipeline
- Users upload budget PDF URLs.
- The system downloads and sends them to an LLM’s API (we use gpt-4o) via a Python worker.
- The structured JSON data is extracted and stored in Supabase.
Audio Processing Workflow
- Board meeting recordings are processed through Whisper for transcription.
- Transcripts are indexed and made searchable, so that users can ask questions about the video.
Interactive Dashboard
- Multiple visualization types render the extracted budget data.
- Geographic data displays on interactive maps.
- Time-series views show budget evolution over years.
The Technical Challenges of Atlas
- PDF Data Extraction: Budget documents vary in structure, so creating reliable data extraction required us to have very careful prompt engineering to handle different types of documents consistently.
- Handling Large Media Files: Processing board recordings required us to perform substantial chunking and processing to provide a good user experience while handling potentially hours of audio.
- Geographic Data Mapping: Converting budget allocation data to geographic visualizations was very hard. We had to normalize different location references and create intuitive interactive elements.
- Real-time Updates: We knew we wanted to create a system that could process documents asynchronously. While providing meaningful progress updates to users was complex, we worked hard to be able to support dynamic changes to files and the ability to delete previous data points.
Our Two Most Difficult Design Challenges
- Data Visualization Design: As with many hacks and projects, we knew that finding the right balance between simplicity for non-experts and depth for people who need detailed analysis required careful UI decisions. We decided to focus on providing data and visualizations that would be detailed and informative enough to the majority of users who experience the platform.
- Information Architecture: We organized the many views and features in a way that does not overwhelm users but still provides comprehensive access to the data.
Using Wolfram Alpha
We decided to use Wolfram Alpha for sentiment analysis on chunks of text obtained from budget-related videos. This classification task is deeply helpful for understanding whether the sentiment in a room, or associated with a particular speaker, topic, or moment, is either 1) positive, 2) negative, or 3) neutral.
By integrating Wolfram Alpha’s AI, we were able to create deeper contextual understanding for users, such as detecting emotional intensity, identifying recurring topics tied to sentiment, and correlating budget discussions with public mood trends.
This feature is especially powerful for users who face a language barrier, providing them with a simplified and emotion-driven summary of complex meeting discussions without needing to parse dense transcripts. It democratizes access to public discourse by translating not just what was said, but how it was felt.
What Atlas Taught Us
This project taught us valuable lessons in a variety of new domains and tools. The ones that stick out the most are as follows:
- AI Integration: We used large language models for structured data extraction, and not just for generating text.
- Data Visualization Best Practices: We focused on creating clear, accessible visualizations that communicate complex financial information.
- Media Processing: As discussed in challenges, it was difficult to work with long and complex videos. We used a variety of techniques as described in our Orkes pipeline and Techstack for efficiently handling audio data at scale.
- Authentication Systems: We built secure user management with Supabase, where all of the other document information and video processing was stored.
- Workflow Orchestration: We used a new tool, Orkes, to carry out pipelines and workflows. We thus learned how to use the Orkes Conductor to manage complex multi-step processes.
Future Plans
Looking ahead, we would love to enhance Atlas with the following:
- Improved AI Analysis: We could create more sophisticated budget anomaly detection, such as instances that could jump out as problematic or mistakes.
- Sentiment Analysis: We would like to process public comments to gauge community reactions to budget decisions
- Comparative Tools: Allowing users to compare their local budget with other districts and regions.
Overall, Atlas is your command center for unlocking government finance. With Atlas, you can instantly visualize how public money flows across departments and regions over time, ask natural language questions about any meeting or hearing, and uncover real-time sentiment from video commentary. Atlas is more than just a visualization tool. It is a step toward truly accessible public finance, where every citizen can understand how their tax dollars are spent.
Built With
- .env
- conductor
- dotenv
- git
- github
- google-maps
- javascript
- leaflet.js
- npm
- openai
- orkes
- pypdf2
- python
- react
- react-api
- recharts
- requests
- shadcn
- shortuuid
- supabase
- tailwind
- typescript
- vercel
- vite
- whisper
- zod


Log in or sign up for Devpost to join the conversation.