Inspiration
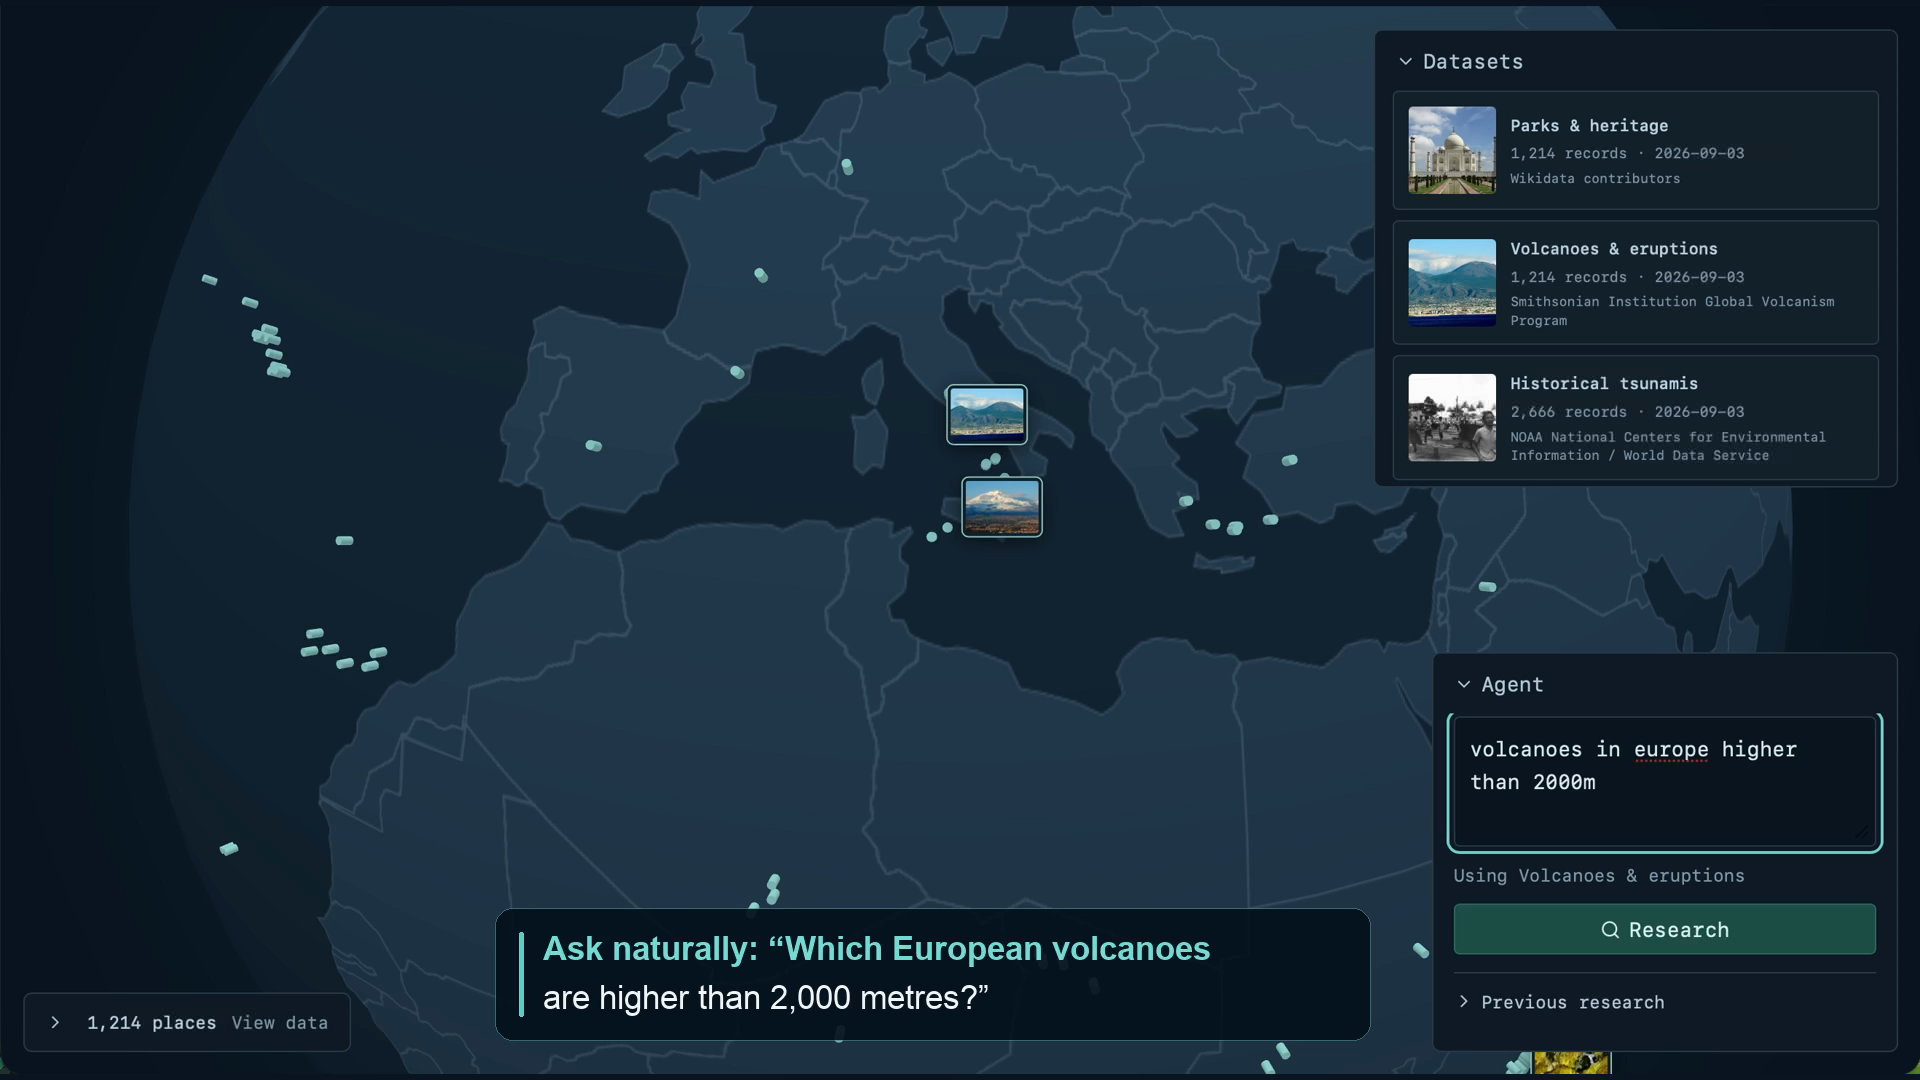
We wanted to make geographic research easier to start. A simple question about volcanoes, observatories or temperature records can require learning SQL, preparing datasets and configuring mapping software before anything appears on a map.
Atlas Research grew from the idea that ordinary language could be the starting point for that work. As we describe in our blog post, the goal is to help people explore geographic questions visually while keeping the underlying evidence accessible.
What it does
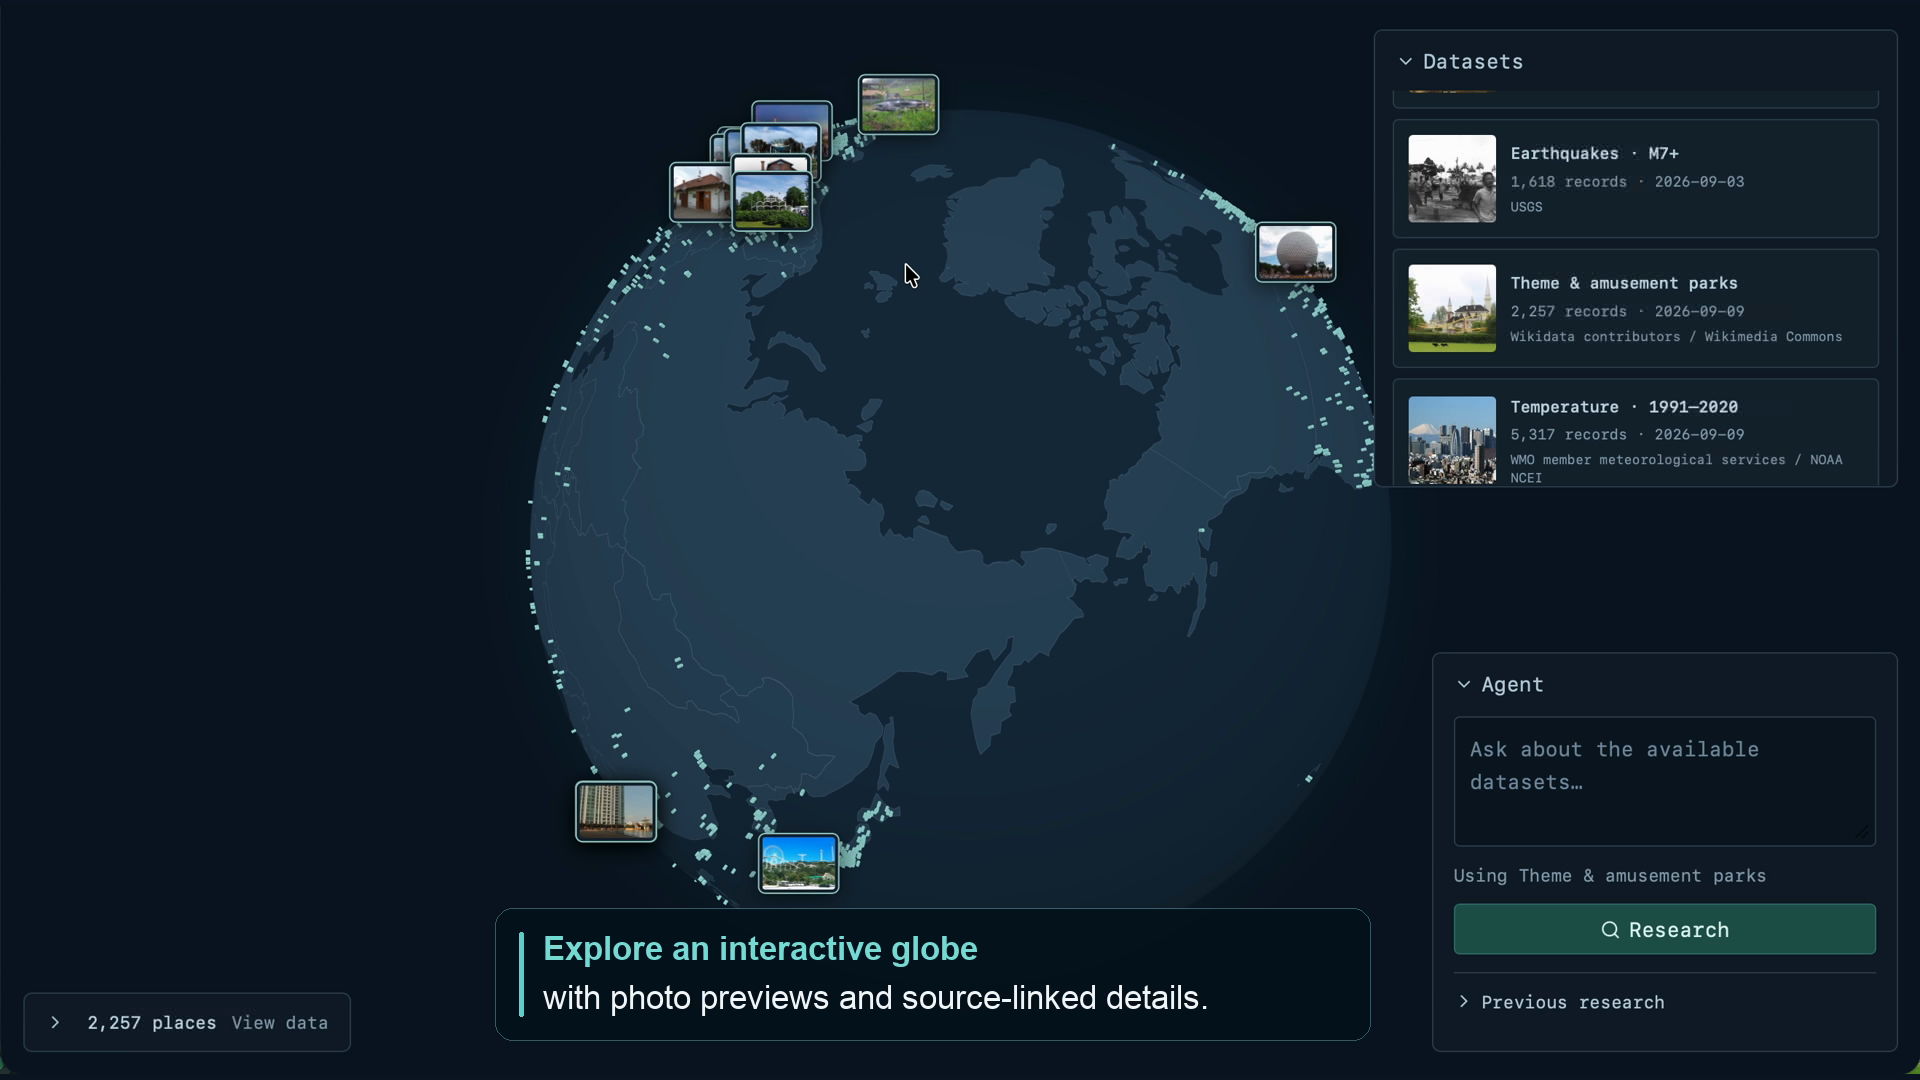
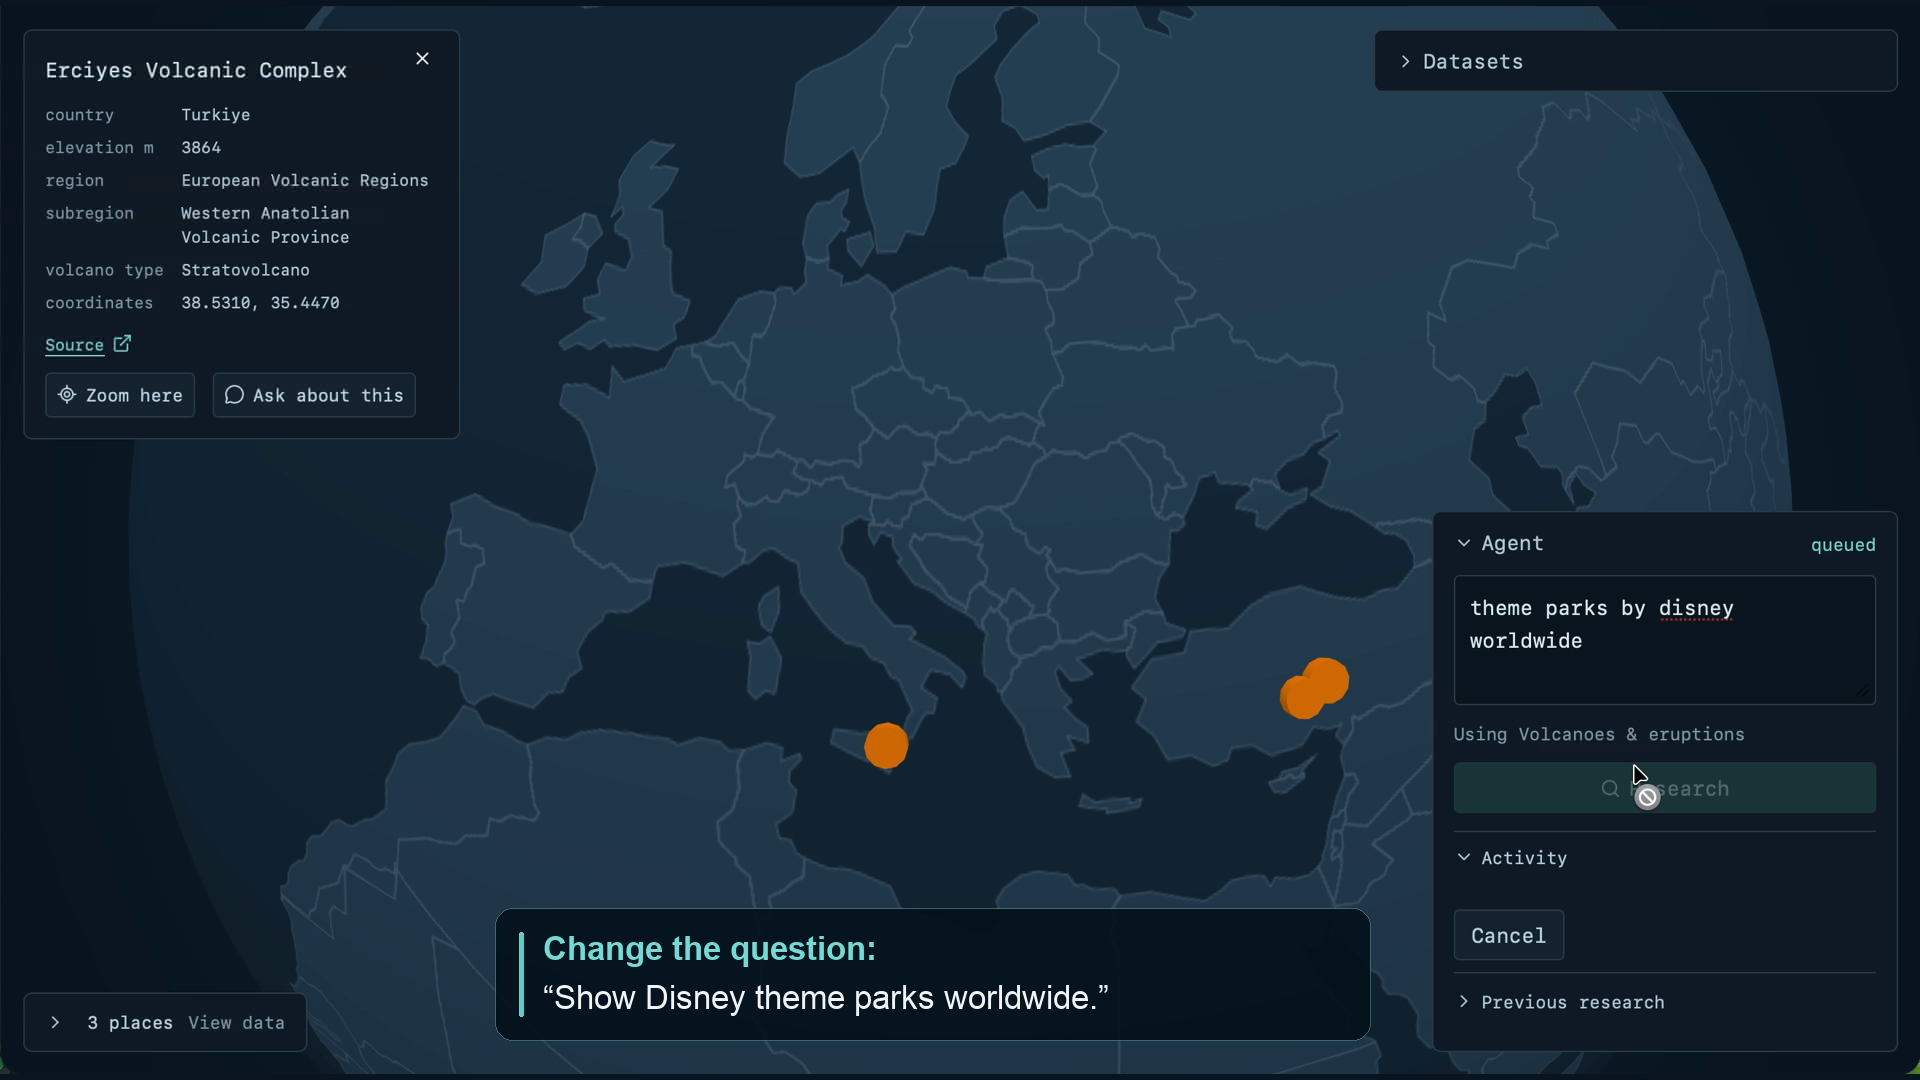
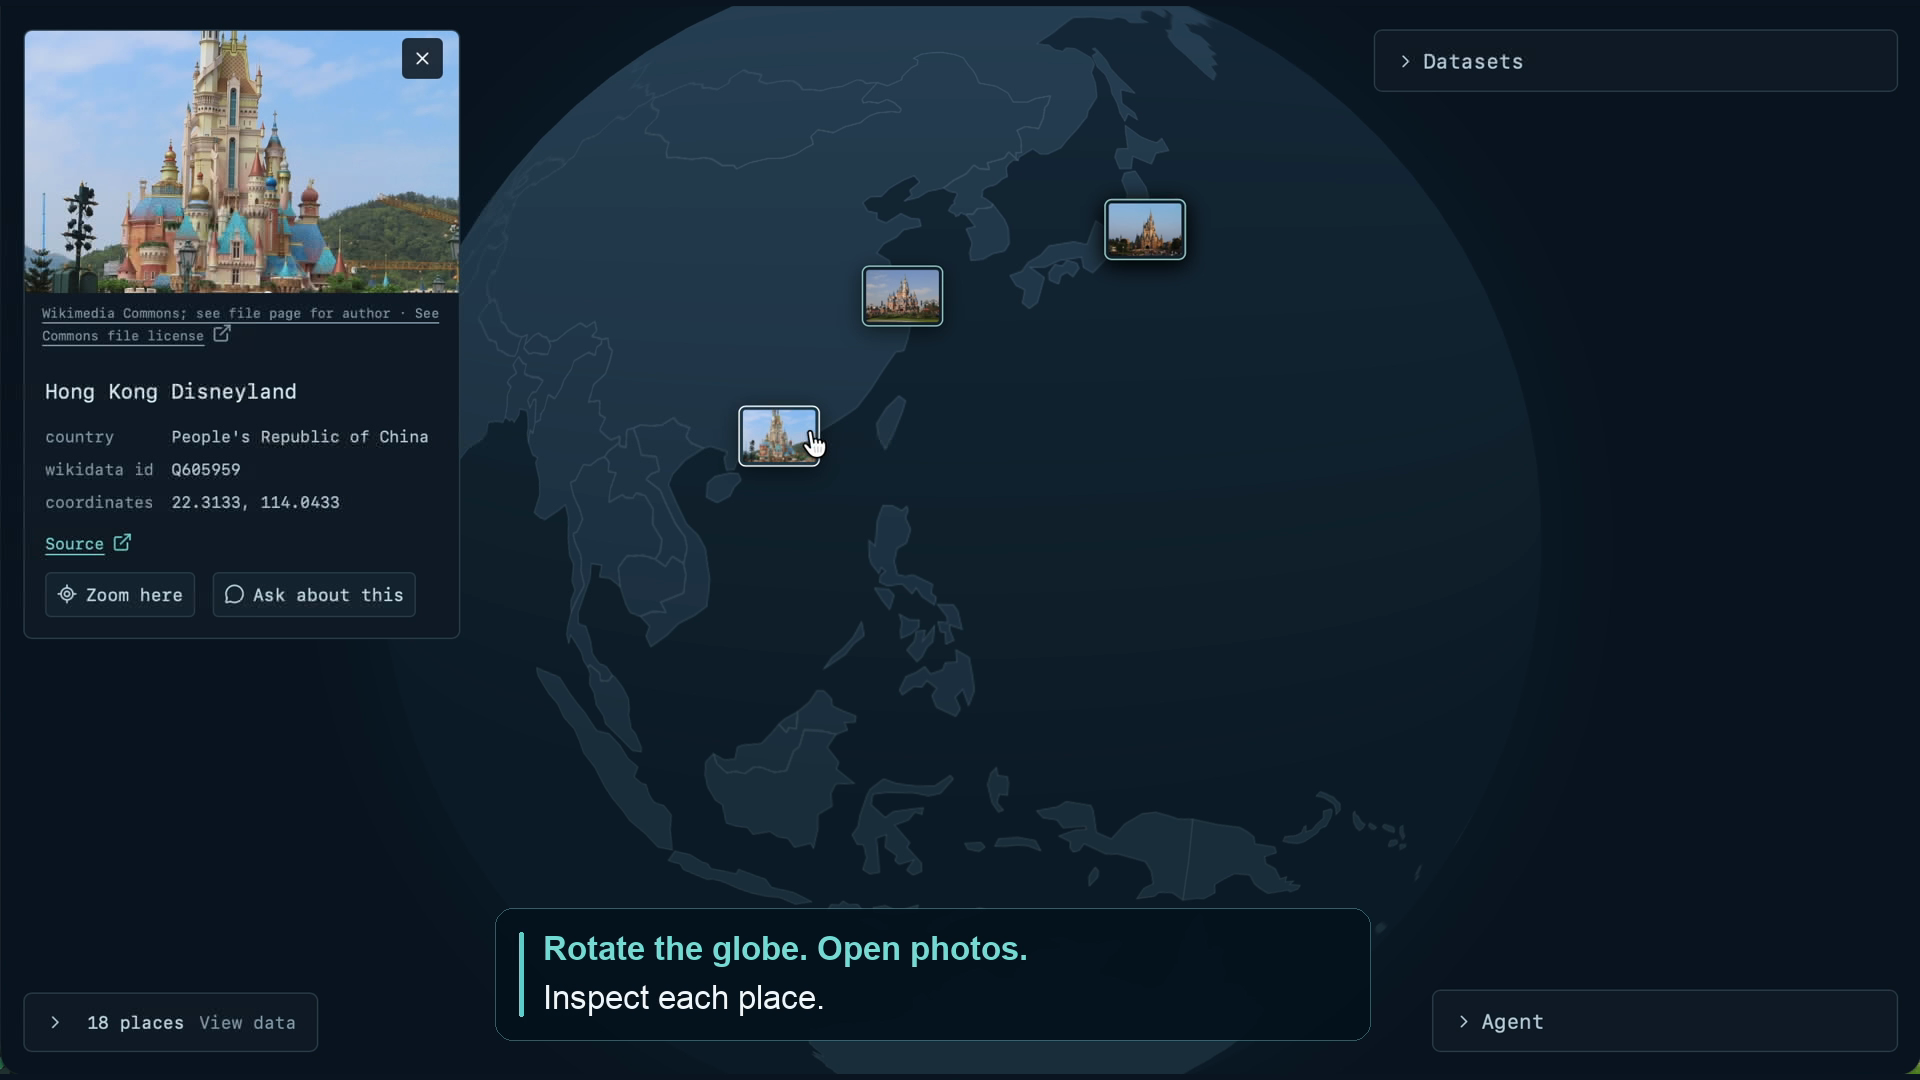
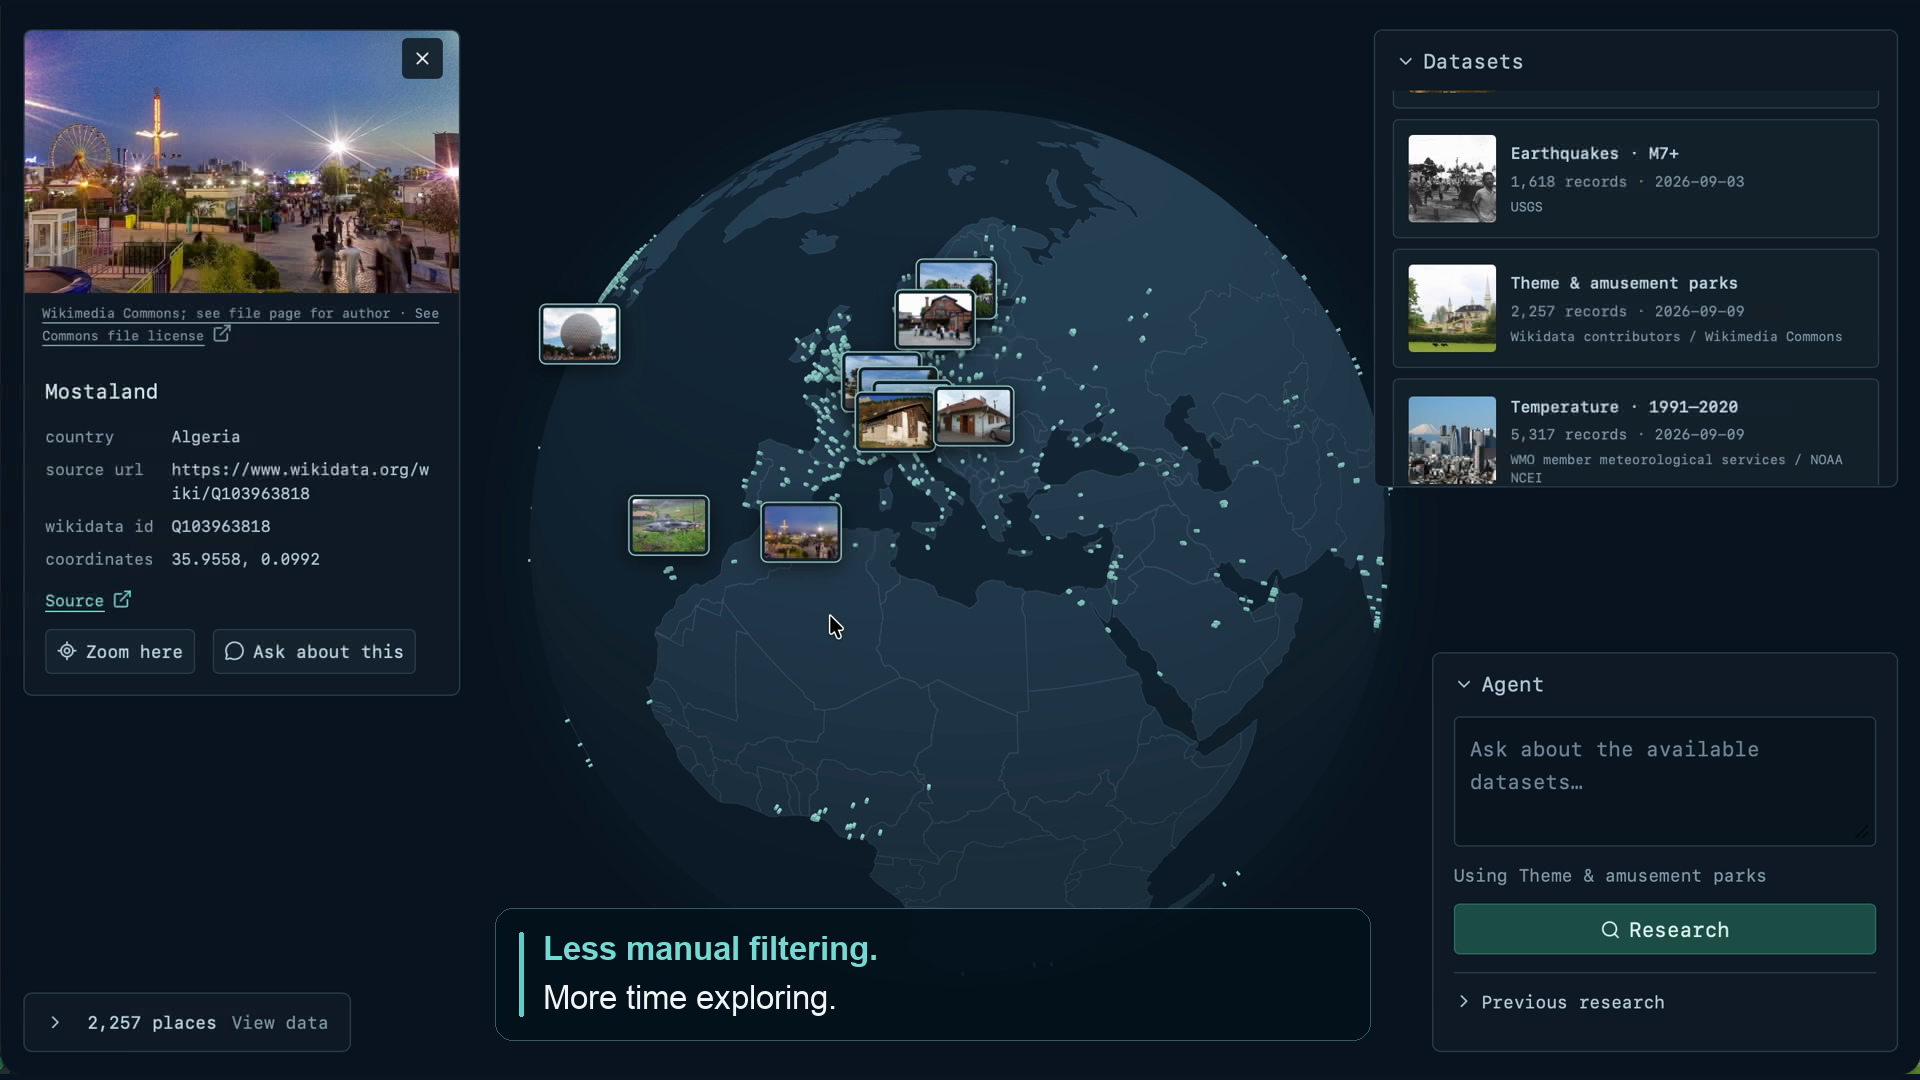
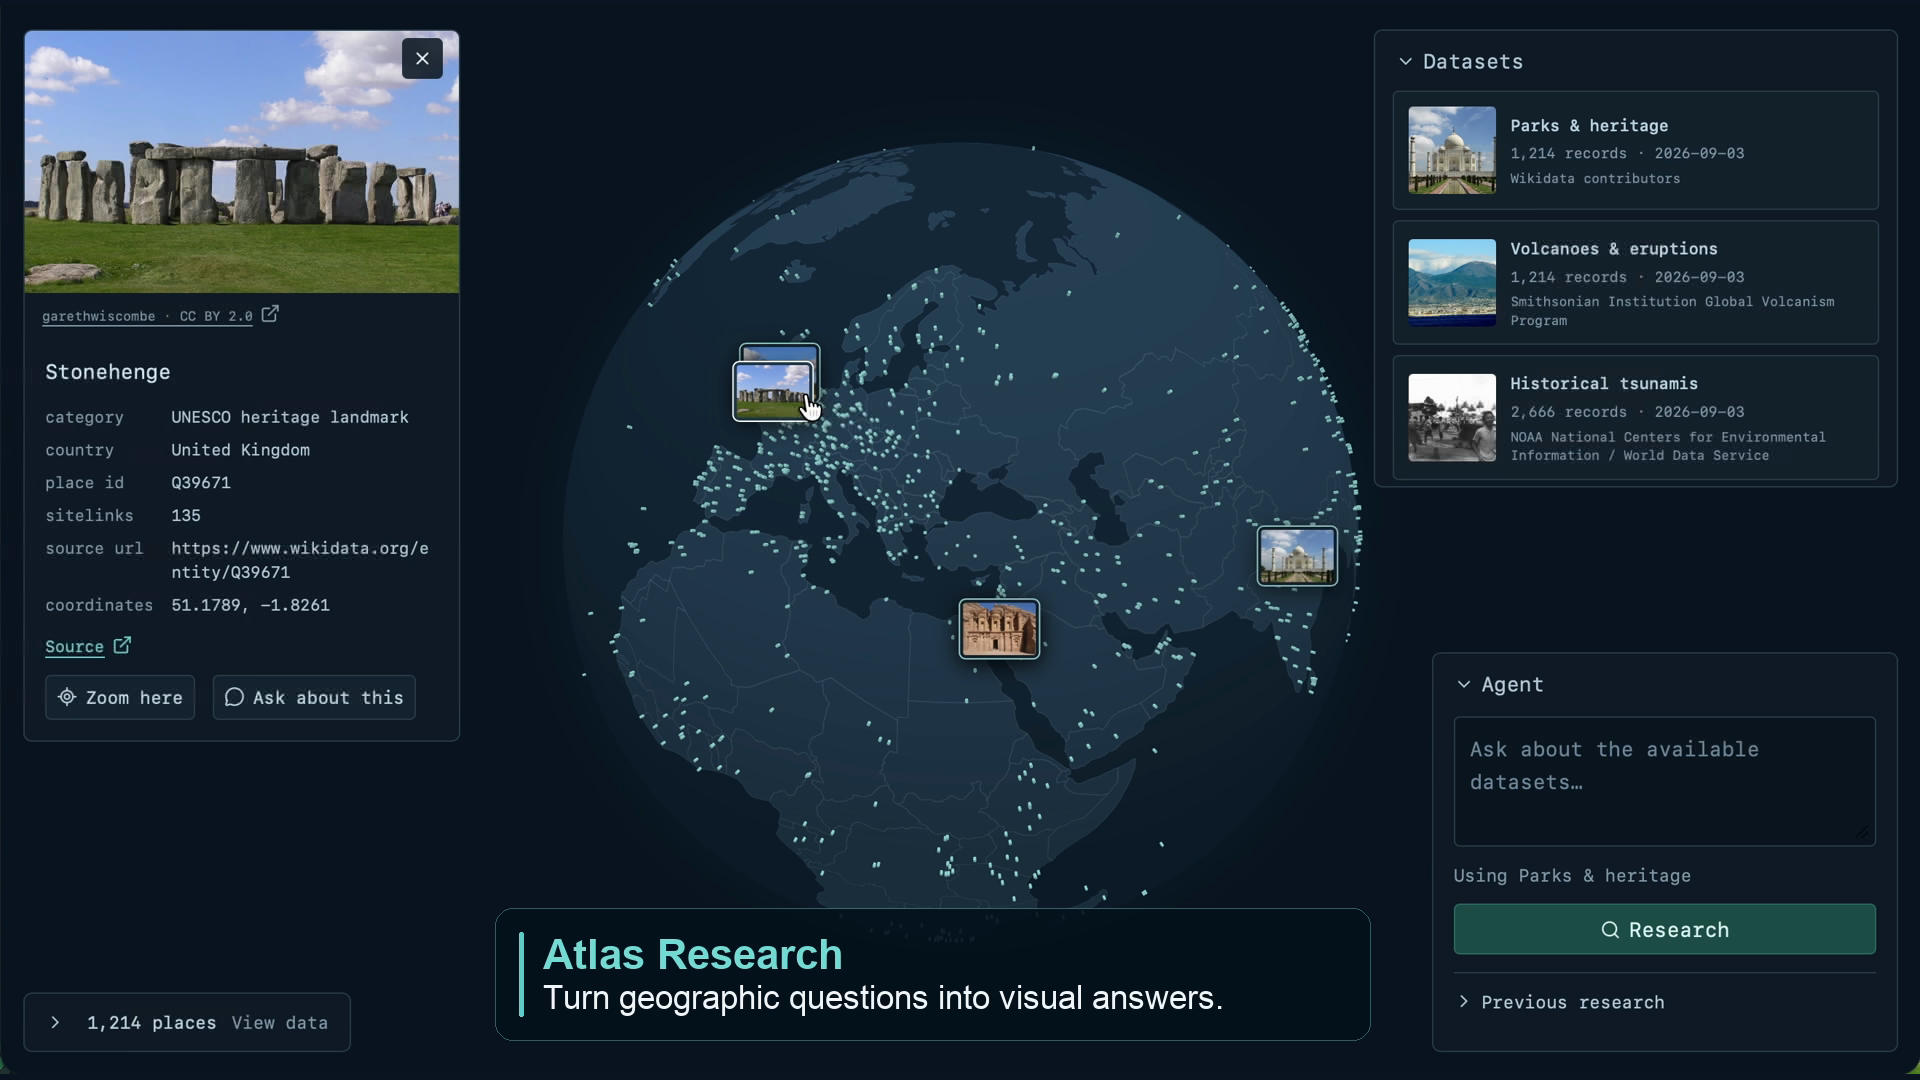
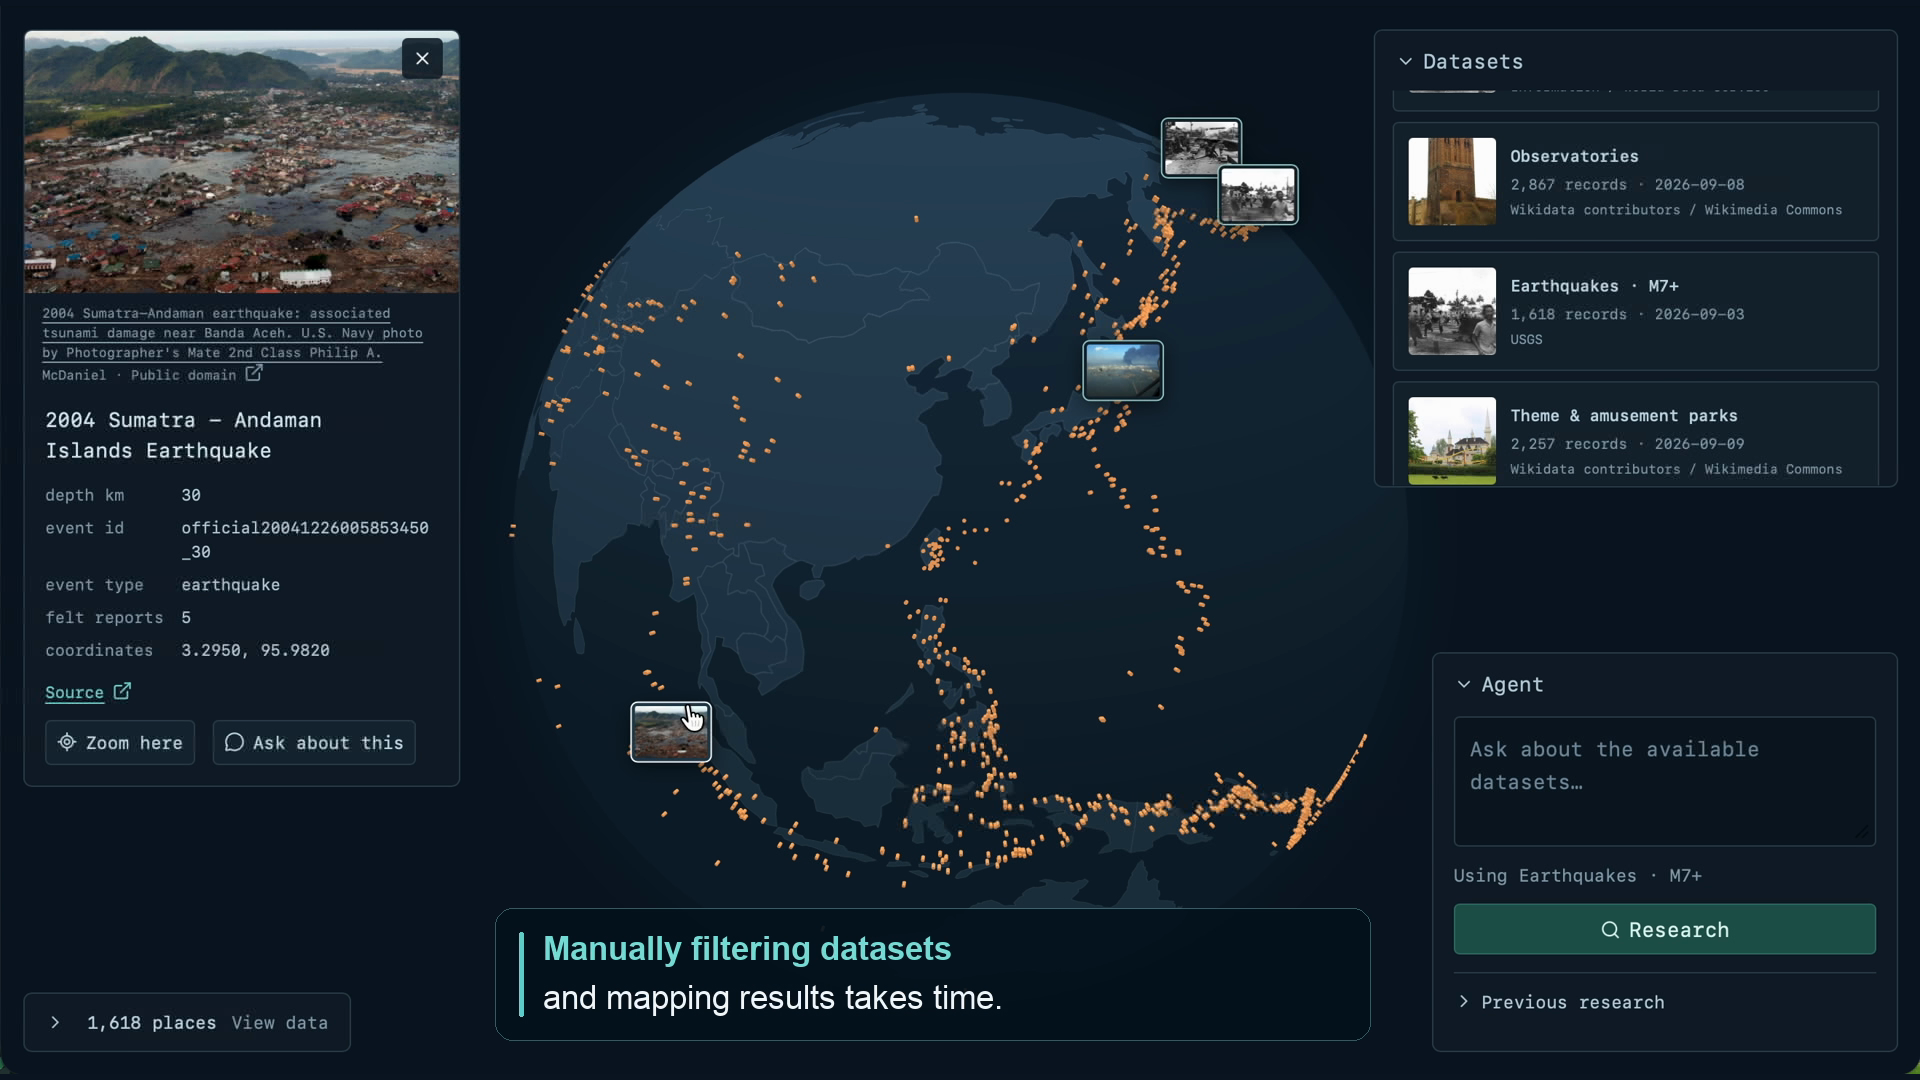
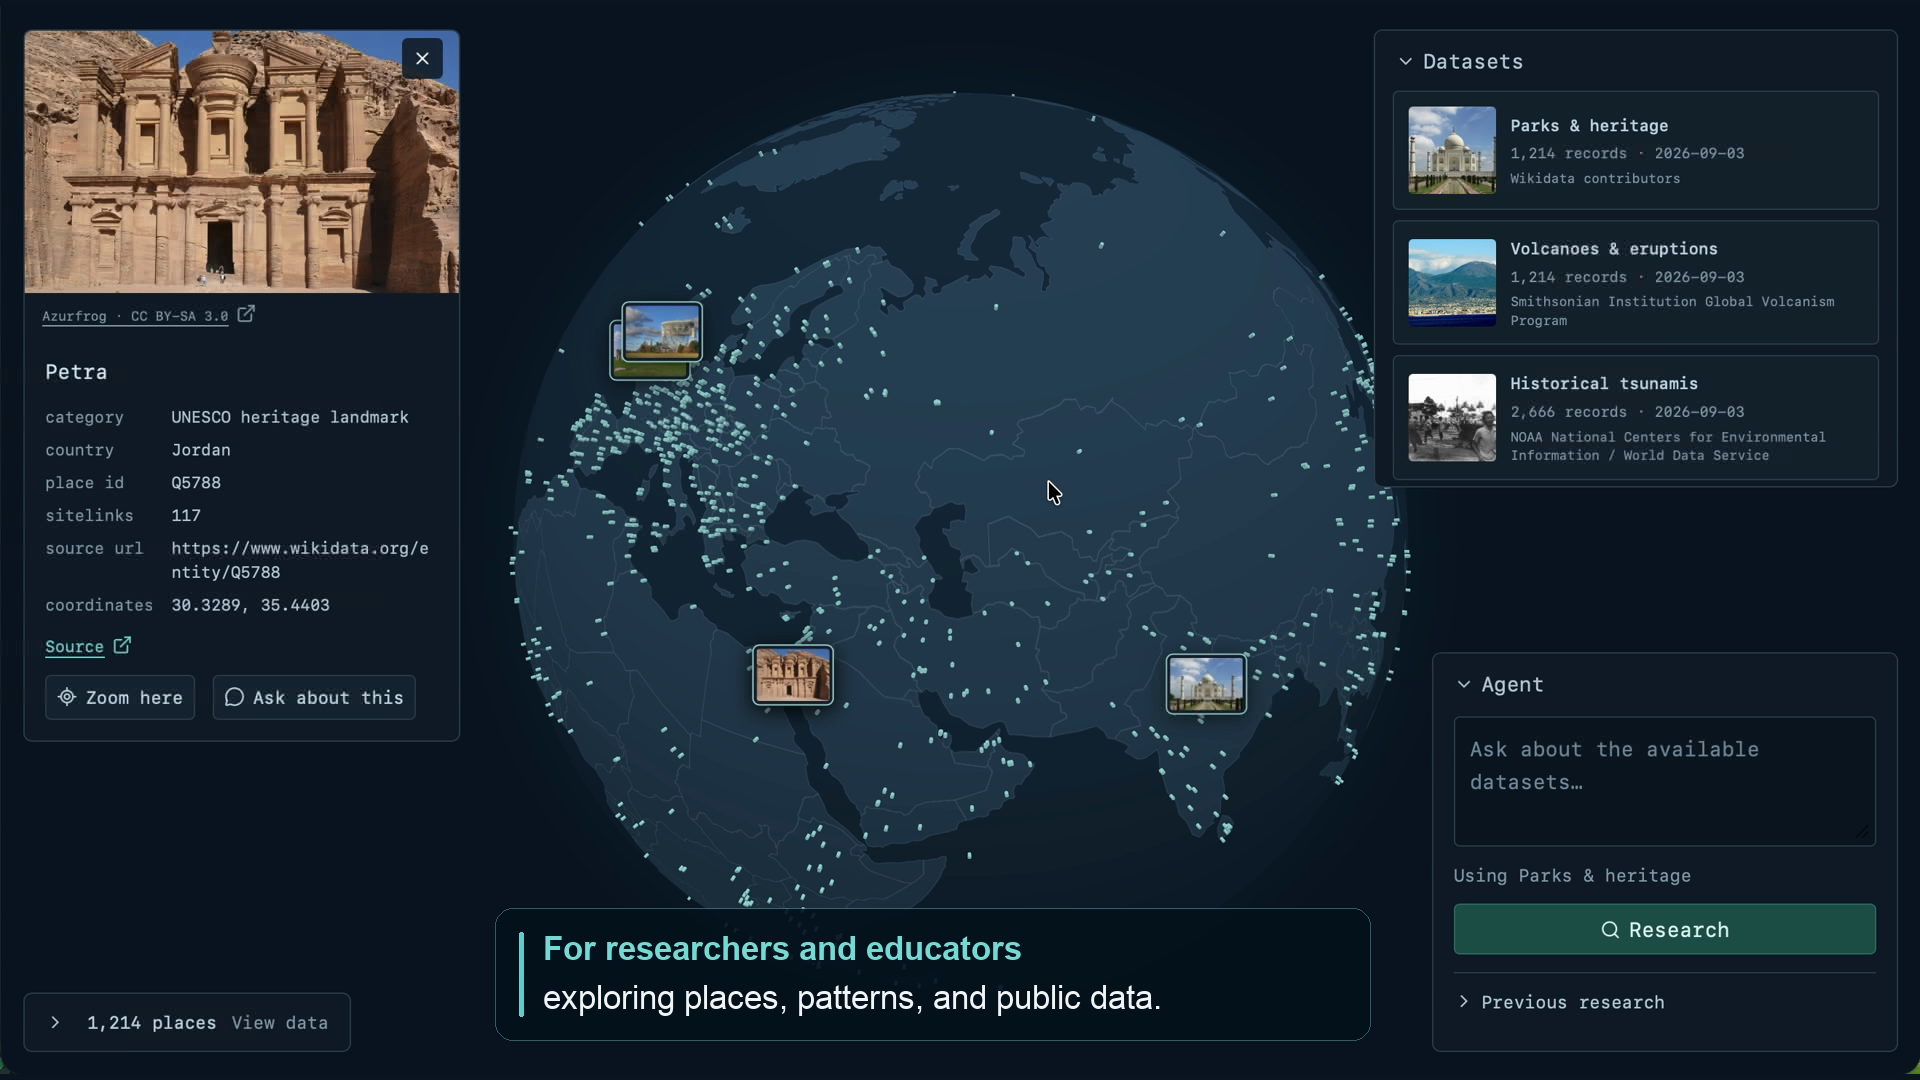
Atlas Research turns natural-language questions into interactive geographic results. Users can ask about available datasets, explore matching records on a globe, inspect photographs and source details, and select a location to ask a follow-up question.
The current datasets cover volcanoes and eruptions, earthquakes, historical tsunamis, parks and heritage sites, observatories, temperature observations and country boundaries. The agent can filter records, join related tables, calculate aggregates and perform supported geographic comparisons.
Investigations retain their history, and users can download CSV results or reproducible ZIP packages containing queries and supporting data. Answers reflect the coverage and dates of the available snapshots.
How we built it
We built a TypeScript frontend with Globe.gl and Three.js, backed by a Python FastAPI application. SQLite stores investigation history, while DuckDB handles data analysis.
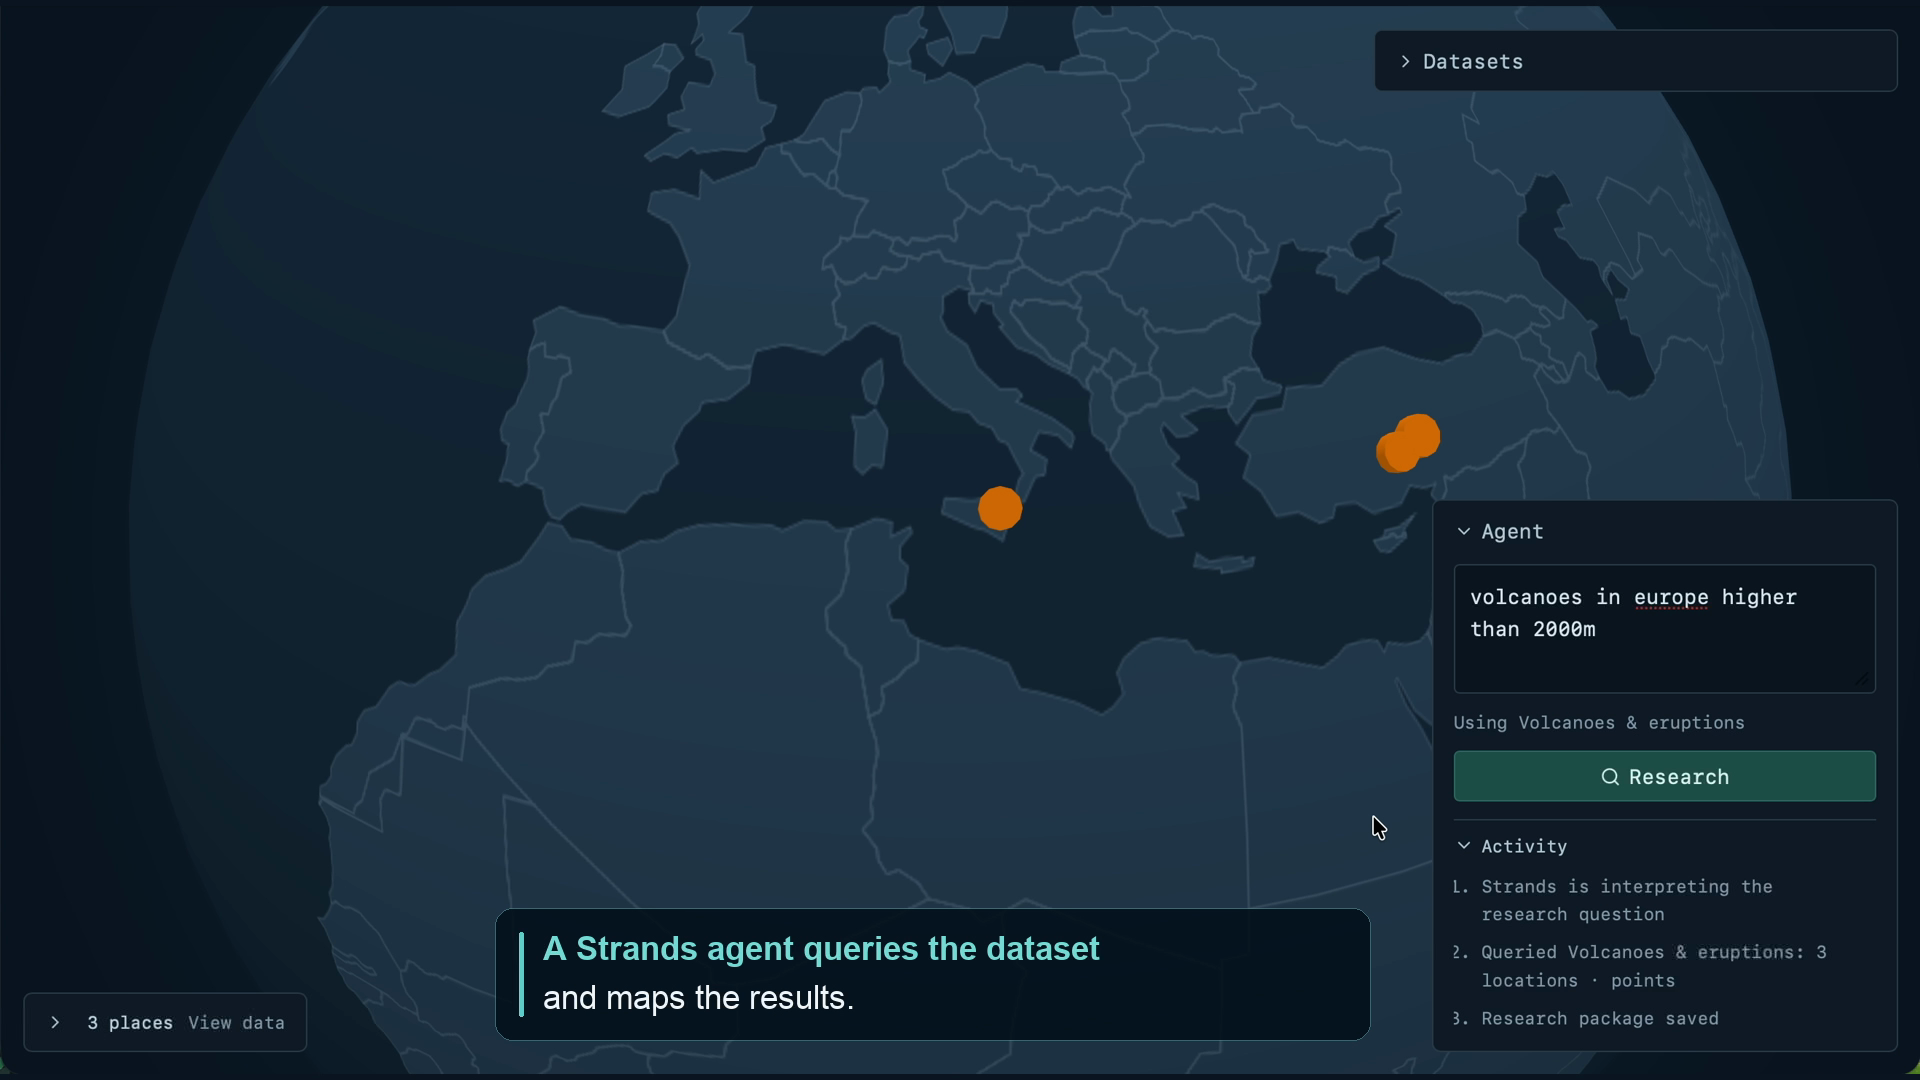
The Strands Agents SDK connects the model to four focused tools: list datasets, inspect a dataset, query it and request clarification. The agent examines schemas before writing read-only SQL and can specify how results should appear through points, photographs, labels or country boundaries.
The application validates queries and visualization instructions, preserves source attribution, and keeps model credentials on the server. We also included an AgentCore-compatible entrypoint and container recipe for a future AWS deployment.
Challenges we ran into
A major challenge was preserving the meaning of public data. Missing coordinates, incomplete time periods, uneven station coverage and generalized country boundaries can all produce misleading results unless their limitations remain visible.
We also had to connect flexible agent reasoning to predictable execution. Queries need resource limits, results need stable identifiers, and follow-up questions need the right context. Provider rate limits required explicit pacing, cancellation handling and bounded research runs.
On the visual side, we worked through overlapping photographs, globe rendering artifacts and panel behavior to keep detailed evidence accessible without overwhelming the map.
Accomplishments that we're proud of
We’re proud of connecting a complete investigation workflow: a question leads to a query, a geographic result, inspectable source records and an export that preserves how the result was produced.
The implementation goes beyond simple map filtering. It supports related tables, including volcanoes with eruption records and temperature stations with monthly observations, alongside geographic comparisons using country polygons.
We also built clarification, saved history and contextual follow-ups into the experience, so users can refine an investigation without starting over.
What we learned
Useful research agents depend on clear tool boundaries and well-described data. Schema inspection, coverage notes and explicit relationships give the model a stronger basis for choosing a valid analysis.
We learned that reproducibility must be designed into the workflow. Preserving source data, hashes, queries and visualization settings makes results easier to inspect and revisit.
We also learned how much interface design matters: the globe invites exploration, while nearby tables, photographs and source links help users understand what they are seeing.
What's next for Atlas Research
We want to test Atlas with researchers, educators and analysts to understand which investigations it helps with most and measure reliability, time saved and cost.
Next steps include broader dataset coverage, carefully scoped source discovery, richer time comparisons and additional visualization types. We also want to improve shared workspaces and durable background execution.
Built With
- amazon-web-services
- bedrock
- duckdb
- sqlite
- strands

Log in or sign up for Devpost to join the conversation.