-
-

Logo
-
Home Screen
-
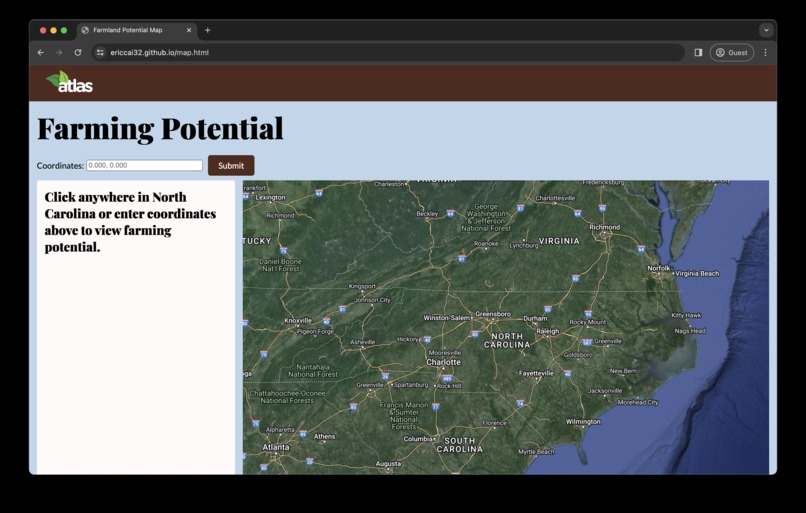
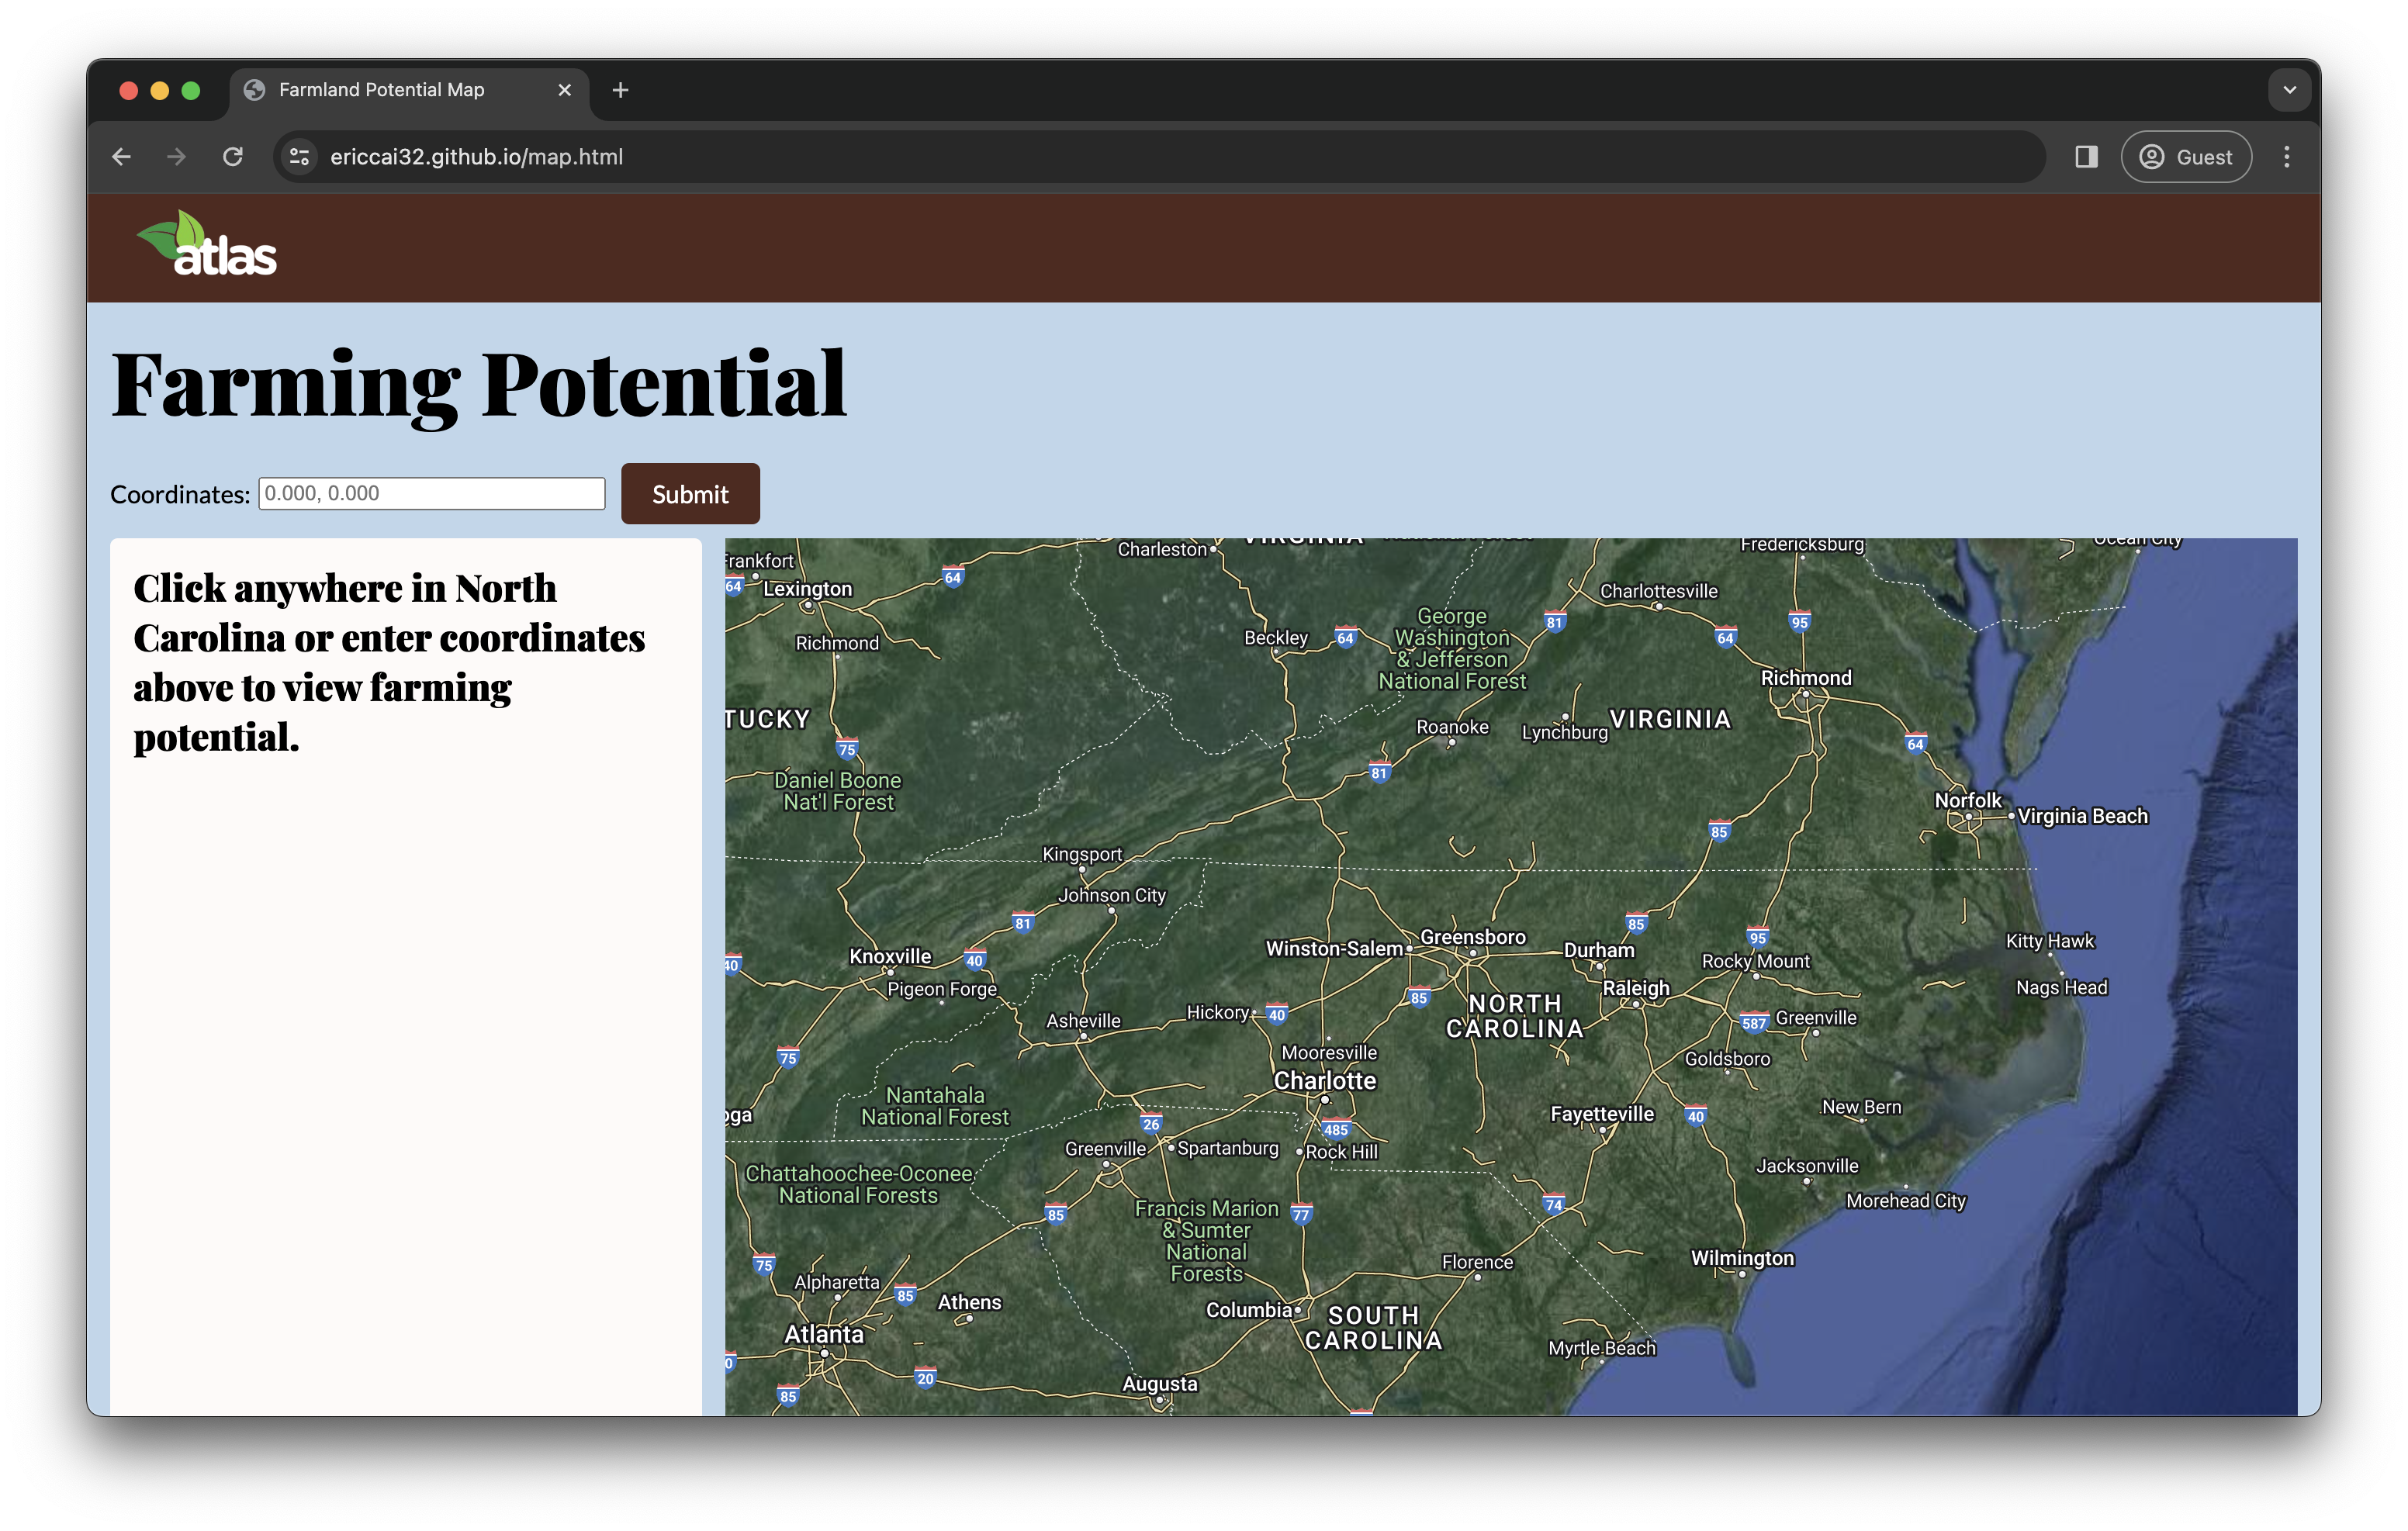
Map
-
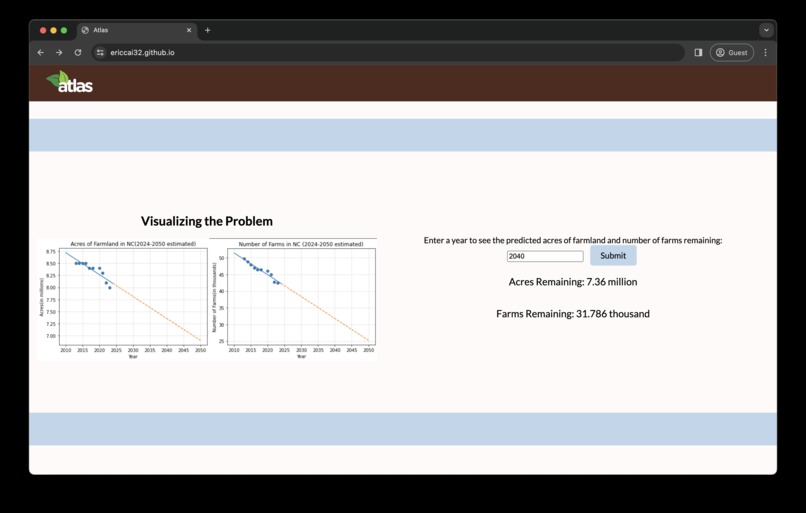
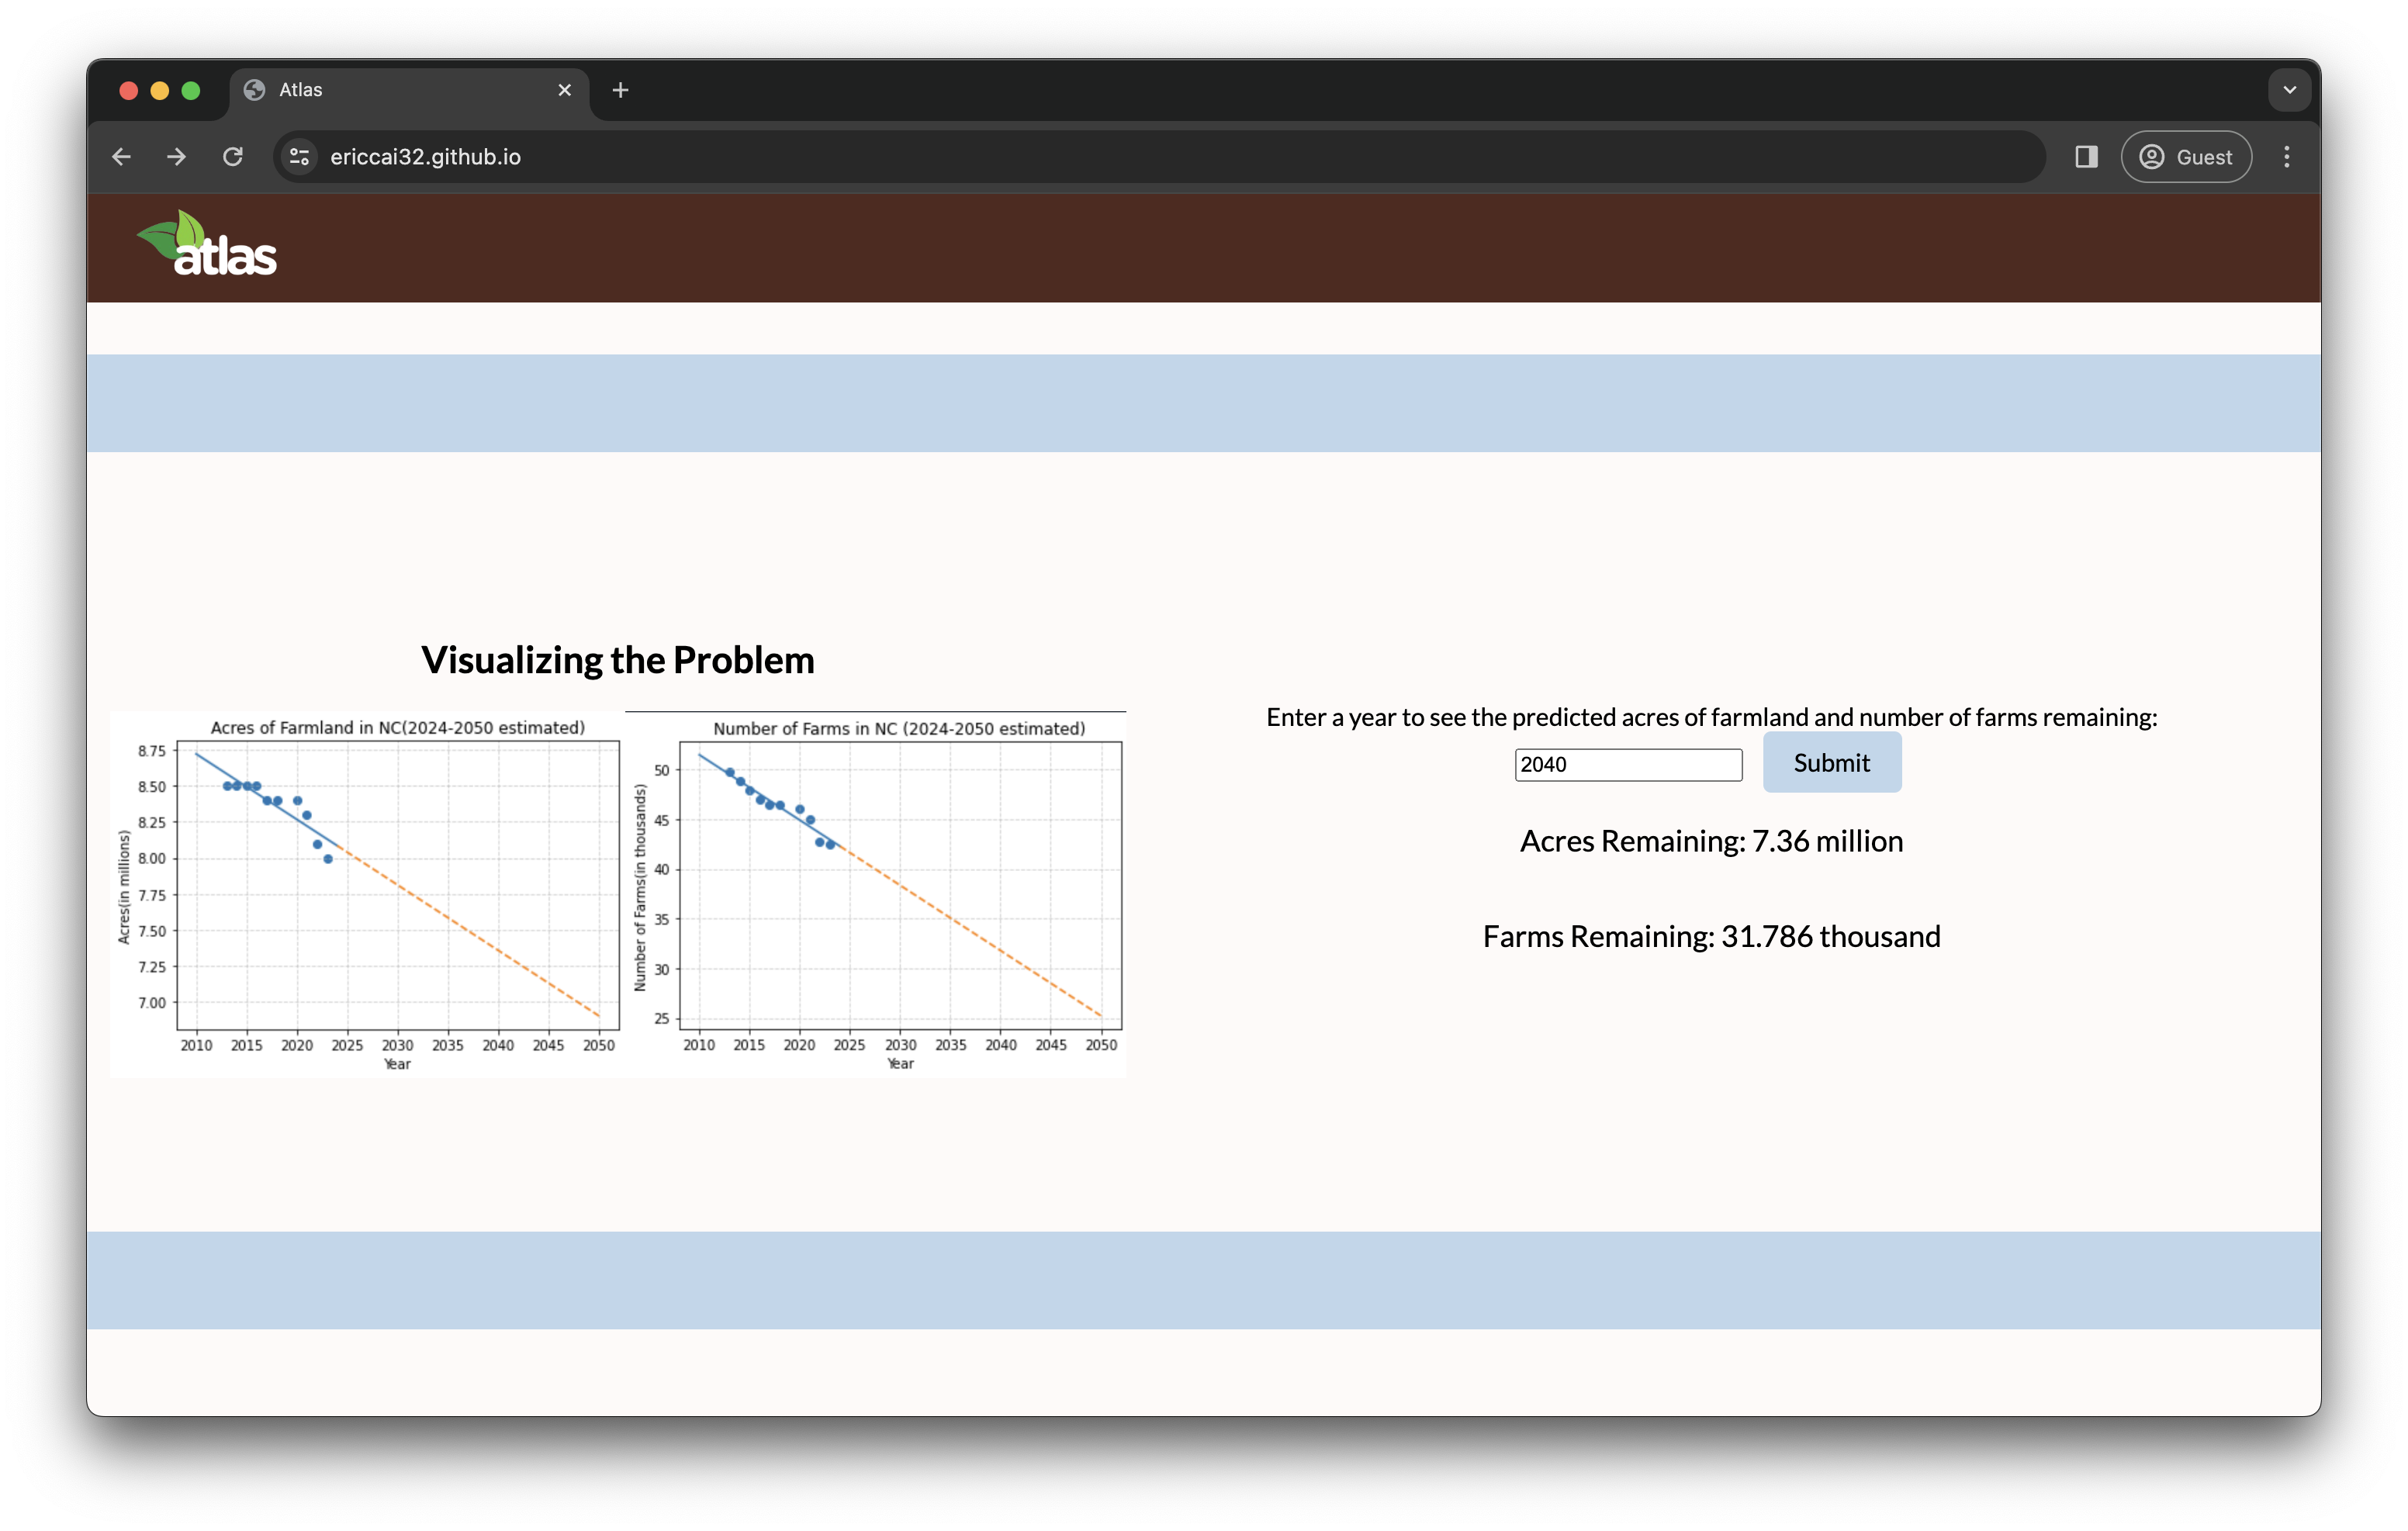
Data Visualization
Inspiration
All of our members have seen the effects of farmland loss in North Carolina. Our members come from both Charlotte and Raleigh, two of the fastest-growing cities in NC. As these cities grow, farmland is being taken over by urban developments. Farming has always been a major part of North Carolina's industries — most significantly, North Carolina is the largest tobacco producer in the United States. According to the American Farmland Trust, North Carolina is the second-most threatened state in regard to losing farmland. When we discovered this, we decided to take action. We know that North Carolina's rising population will require more urban development, but we hope to protect North Craolina's farms and farmers.
What it does
We created a website that determines which land is optimal for farmland and which land is better utilized for urbanization. It uses a machine learning model using data trained from OpenMeteo and Google Earth Engine API. When the user clicks on any point in North Carolina, our tool considers various variables such as distance from urban areas, soil moisture, and temperature to determine how important that land is for farming. Our website also displays information about the decline of North Carolina farmland. The user can play around with the inputs to see how NC’s farmland will do if we continue under current trends.
How we built it
Using Git, we created a GitHub repository to collaborate and share code. We used Visual Studio code to code our project. Our project was coded in HTML, CSS, AND JavaScript. GitHub Pages was used for the website demo.
Challenges we ran into
We ran into challenges while integrating the Google Maps API with our website's map. After much research and reading of the docs, we realized that the most user-friendly implementation would be to allow the user to click on a certain point on the map and we will find the coordinates for that point, making it much simpler for the user. We still kept the feature to input coordinates manually for more precise locations. This was a tricky problem to solve and we went through docs and lots of information online to figure out how to convert a click on a map into coordinates. We also ran into issues with creating the machine learning model as we initially created it in Python but then realized that combining a website with a Python aspect would be too difficult to implement so we converted our algorithm into Javascript. This proved to be difficult because numerous features in Python such as numpy were unavailable in Javascript and we had to find roundabout methods.
Accomplishments that we're proud of
We are proud of our map feature. Our map allows the user to click on a point and it will output information from that location. We are also proud of our integration of machine learning to analyze if a certain area on the map is more suitable for farmland or urban land. Our model can analyze numerous features and can even make predictions about land use in the future to see if the land is good or not for farming.
What we learned
Through this experience, we learned how to create machine-learning models in Javascript. We also learned how to implement a Google map into our website and allow the user to search for a certain location on the map by clicking on it.
What's next for Atlas
We hope to expand our dataset in the future so that our machine learning model will be able to better predict more remote areas in North Carolina. We are also hoping to include more features so that our predictions become more accurate. Furthermore, with better data, we can expand the reach of our project outside of North Carolina.
Built With
- css
- google-earth-engine-api
- google-maps
- html
- javascript
- openmeteo


Log in or sign up for Devpost to join the conversation.