-
-
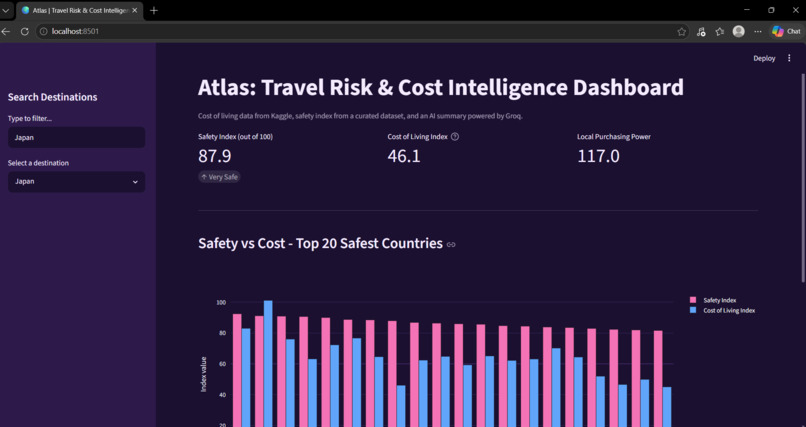
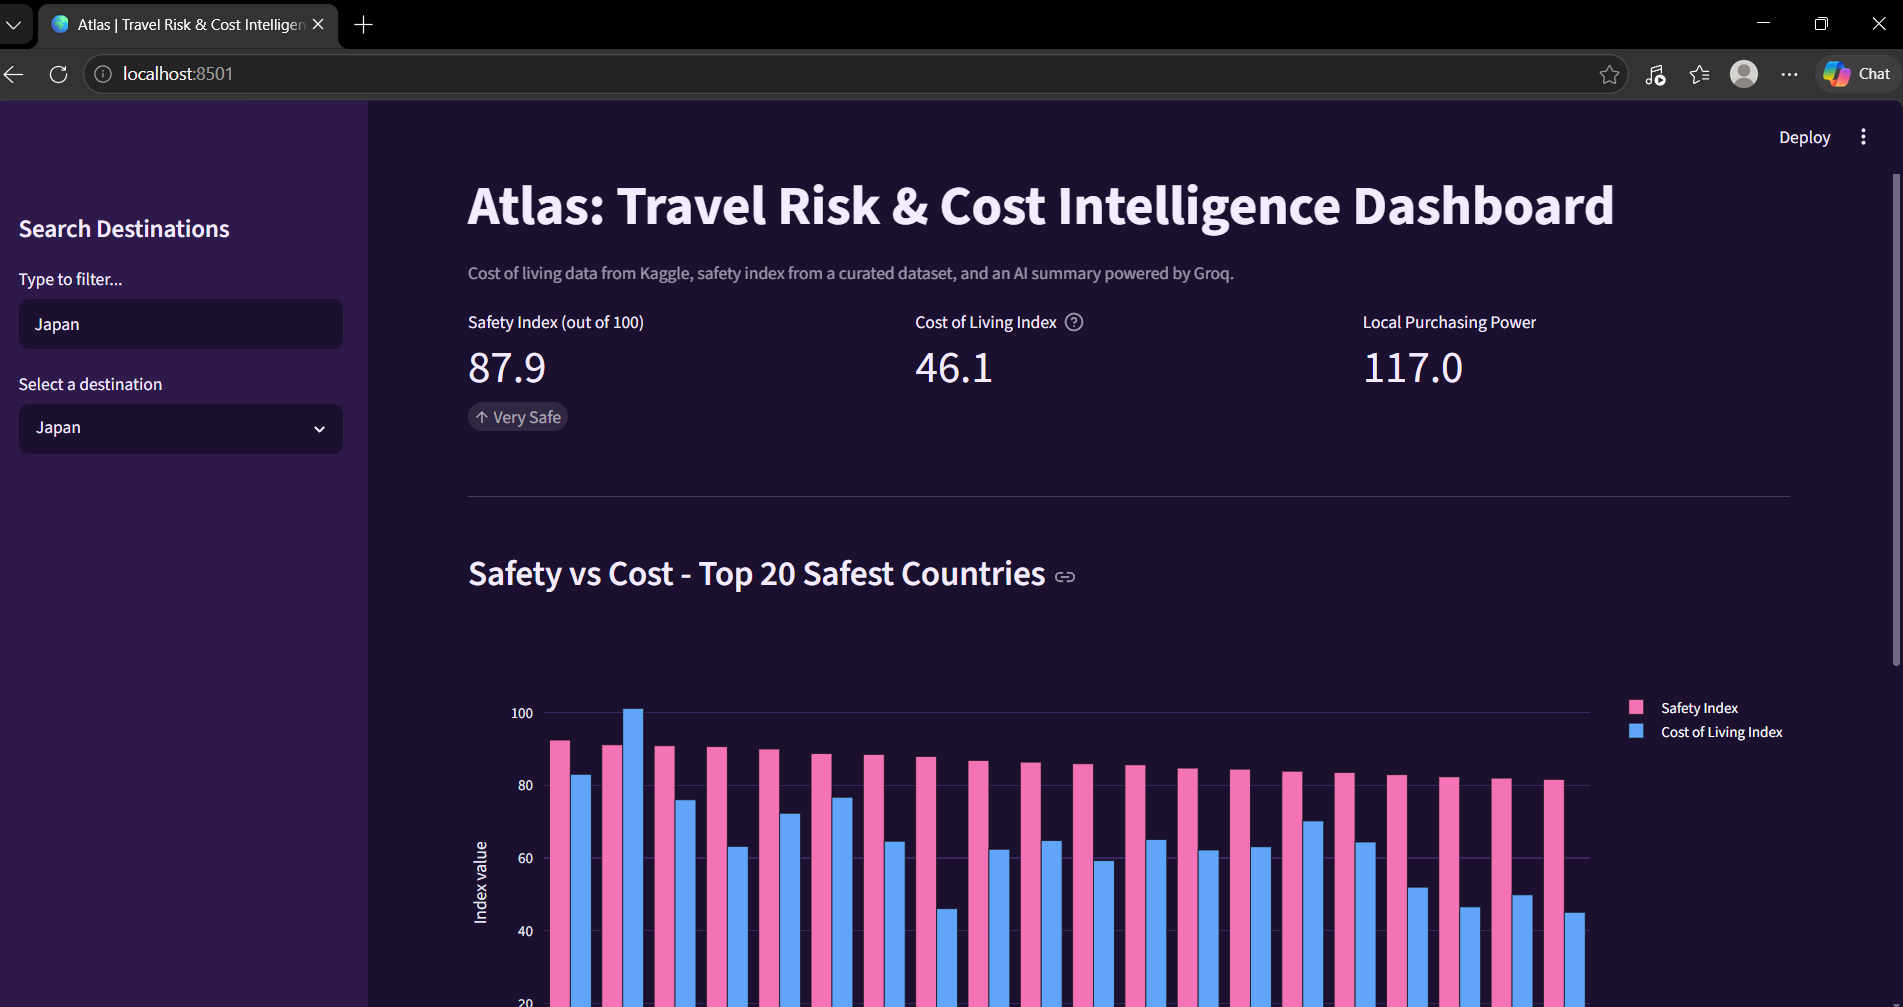
Atlas dashboard showcasing live travel metrics like Safety Index and Cost of Living alongside dynamic Plotly comparison charts.
-
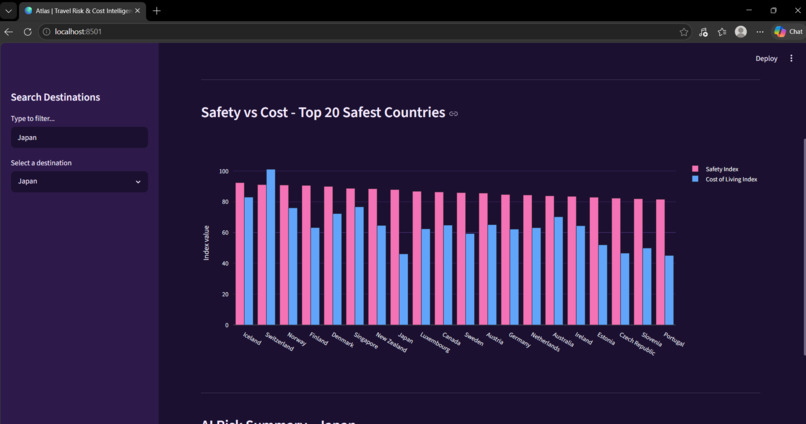
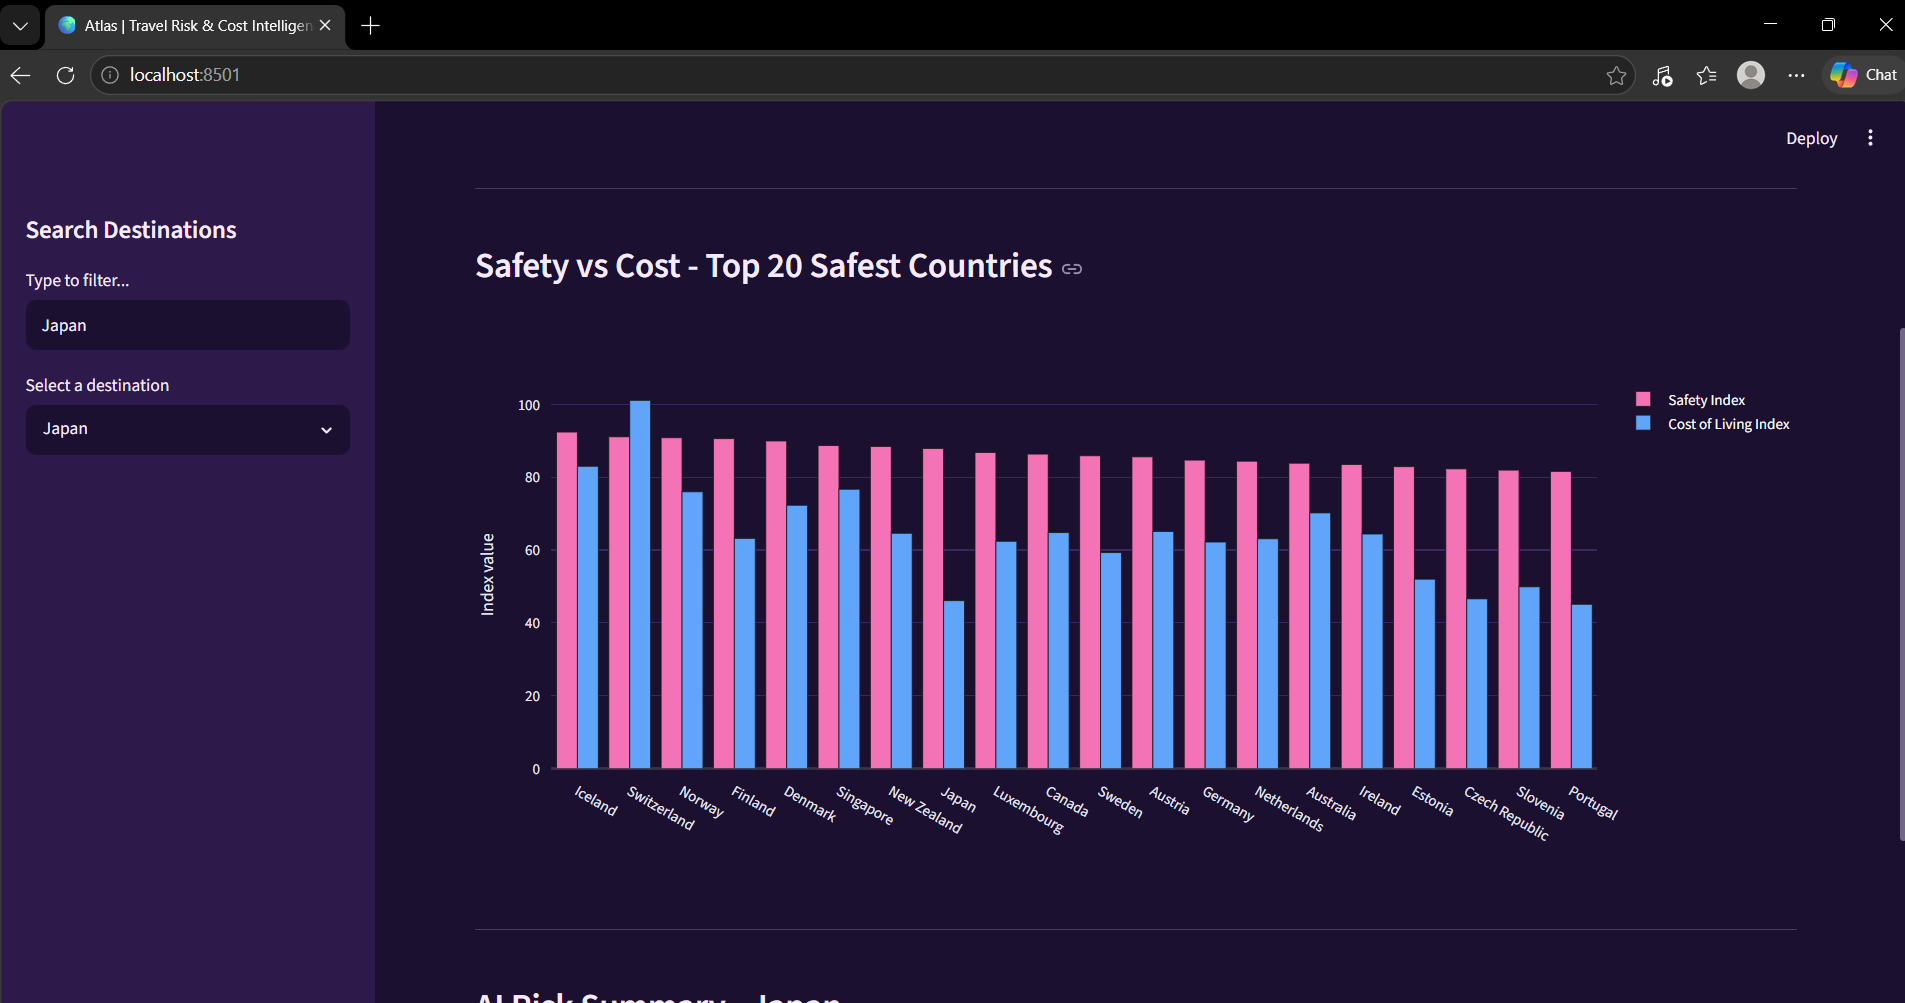
An interactive Plotly bar chart comparing safety versus cost index data for the top 20 safest countries globally.
-
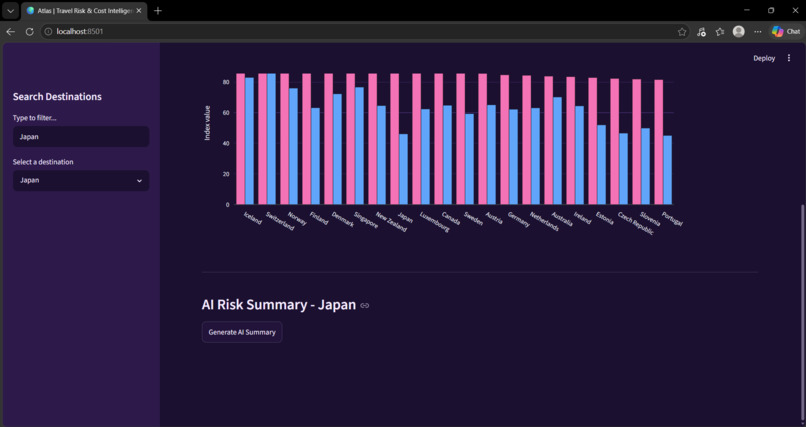
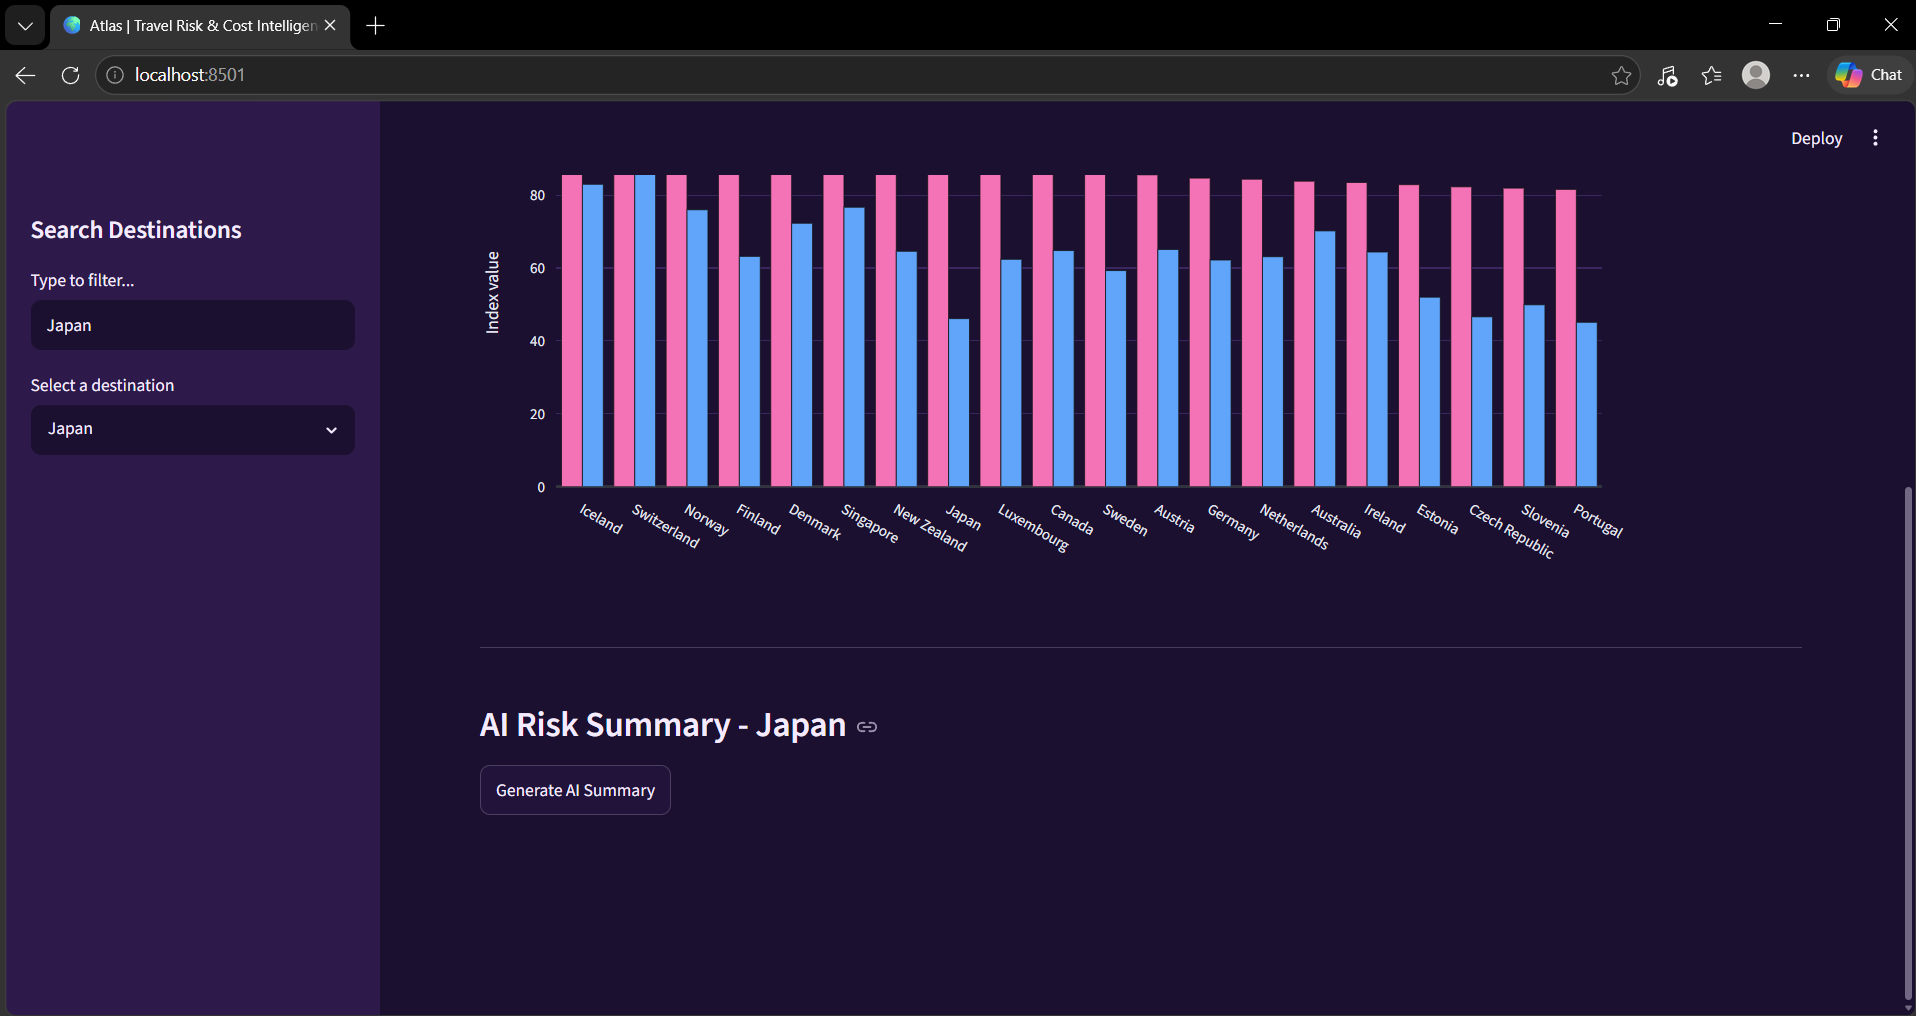
On-demand AI Travel Risk Summary button integration powered by Groq API for instant contextual insights.
-
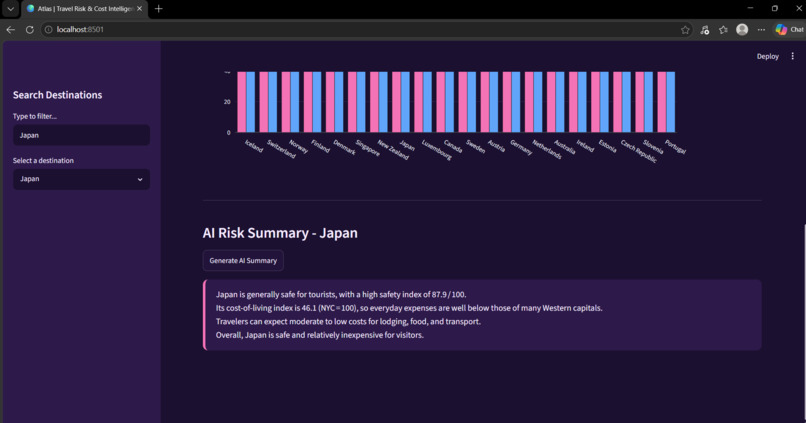
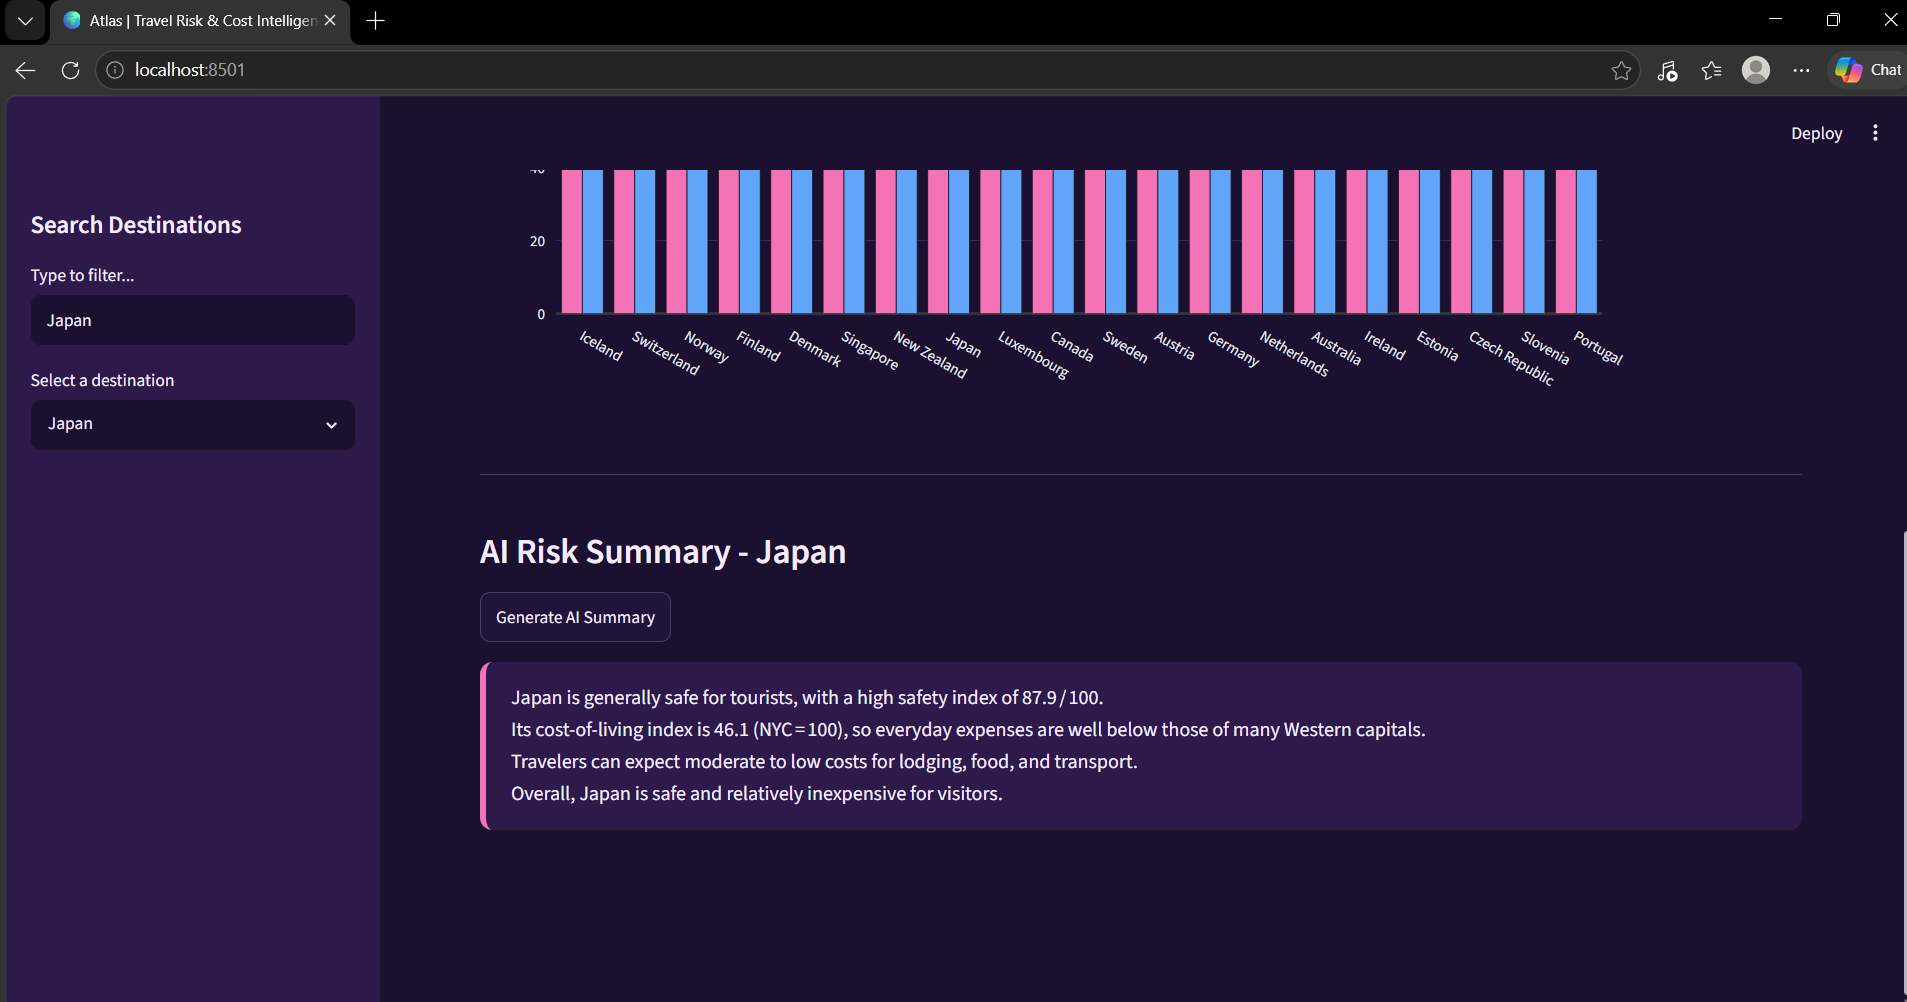
Live generated AI Travel Summary output leveraging Groq LLM to instantly evaluate country destination risks.
Inspiration
Planning an international trip often requires jumping between multiple websites to check safety ratings, dynamic accommodation costs, and local purchasing power. This fragmented process makes it exhausting for travelers to decide if a destination truly fits their budget and security comfort zone. We wanted to build a single, unified interface that solves this hassle instantly using data and AI.
What it does
Atlas is an interactive intelligence dashboard that empowers travelers:
- Comprehensive Metrics: Displays three critical benchmarks for any selected country: Safety Index, Cost of Living Index, and Local Purchasing Power.
- Visual Benchmarking: Uses interactive Plotly charts to dynamically compare safety versus cost against the world's top 20 safest countries.
- AI Travel Intelligence: Integrates an on-demand AI travel assistant that generates a concise, contextual risk and financial summary for the selected destination. ## How we built it The project is built entirely on a modern open-source Python stack:
- Frontend/UI: Built using Streamlit for a highly responsive, clean, and interactive user interface.
- Data Engineering: Powered by Pandas to programmatically clean, merge, and map historical safety data alongside real-time Kaggle datasets via KaggleHub.
- Visualizations: Implemented Plotly to create rich, high-fidelity interactive data charting for country comparisons.
- AI Brain: Integrated lightning-fast LLM capabilities using the Groq API to produce instant text summaries based on live numeric inputs. ## Challenges we ran into One of the biggest hurdles was data normalization. Merging disparate datasets with varying country name formats (e.g., standard names vs acronyms) required thorough data validation and strict cleaning workflows in Pandas. Additionally, ensuring secure management of third-party API keys within a Streamlit deployment structure required implementing secure .toml secret management practices. ## Accomplishments that we're proud of We are incredibly proud of building a fully functional, end-to-end data product in such a short time. Successfully integrating live datasets from Kaggle alongside low-latency AI generation using the Groq API—and wrapping it all in a beautiful, responsive Streamlit UI—feels like a massive achievement. ## What we learned Through this project, we mastered data engineering workflows in Pandas, specifically handling external dataset downloads programmatically. We also learned how to leverage low-latency inference providers like Groq to make user-facing AI applications feel instantaneous and seamless. ## What's next for Atlas: AI-Driven Travel Risk & Cost Intelligence Dashboard
- Introduce side-by-side comparative analysis tools for two countries simultaneously.
- Add a built-in travel budget calculator extension based on user input dates.
- Layer additional risk filters including real-time weather alerts and healthcare stability metrics.


Log in or sign up for Devpost to join the conversation.