-
-
Main Page
-
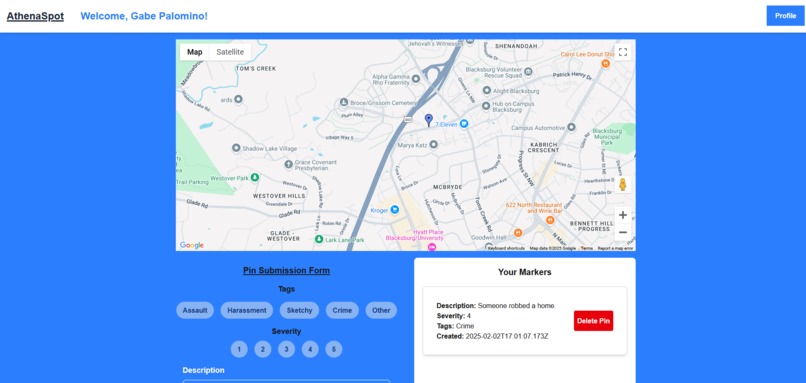
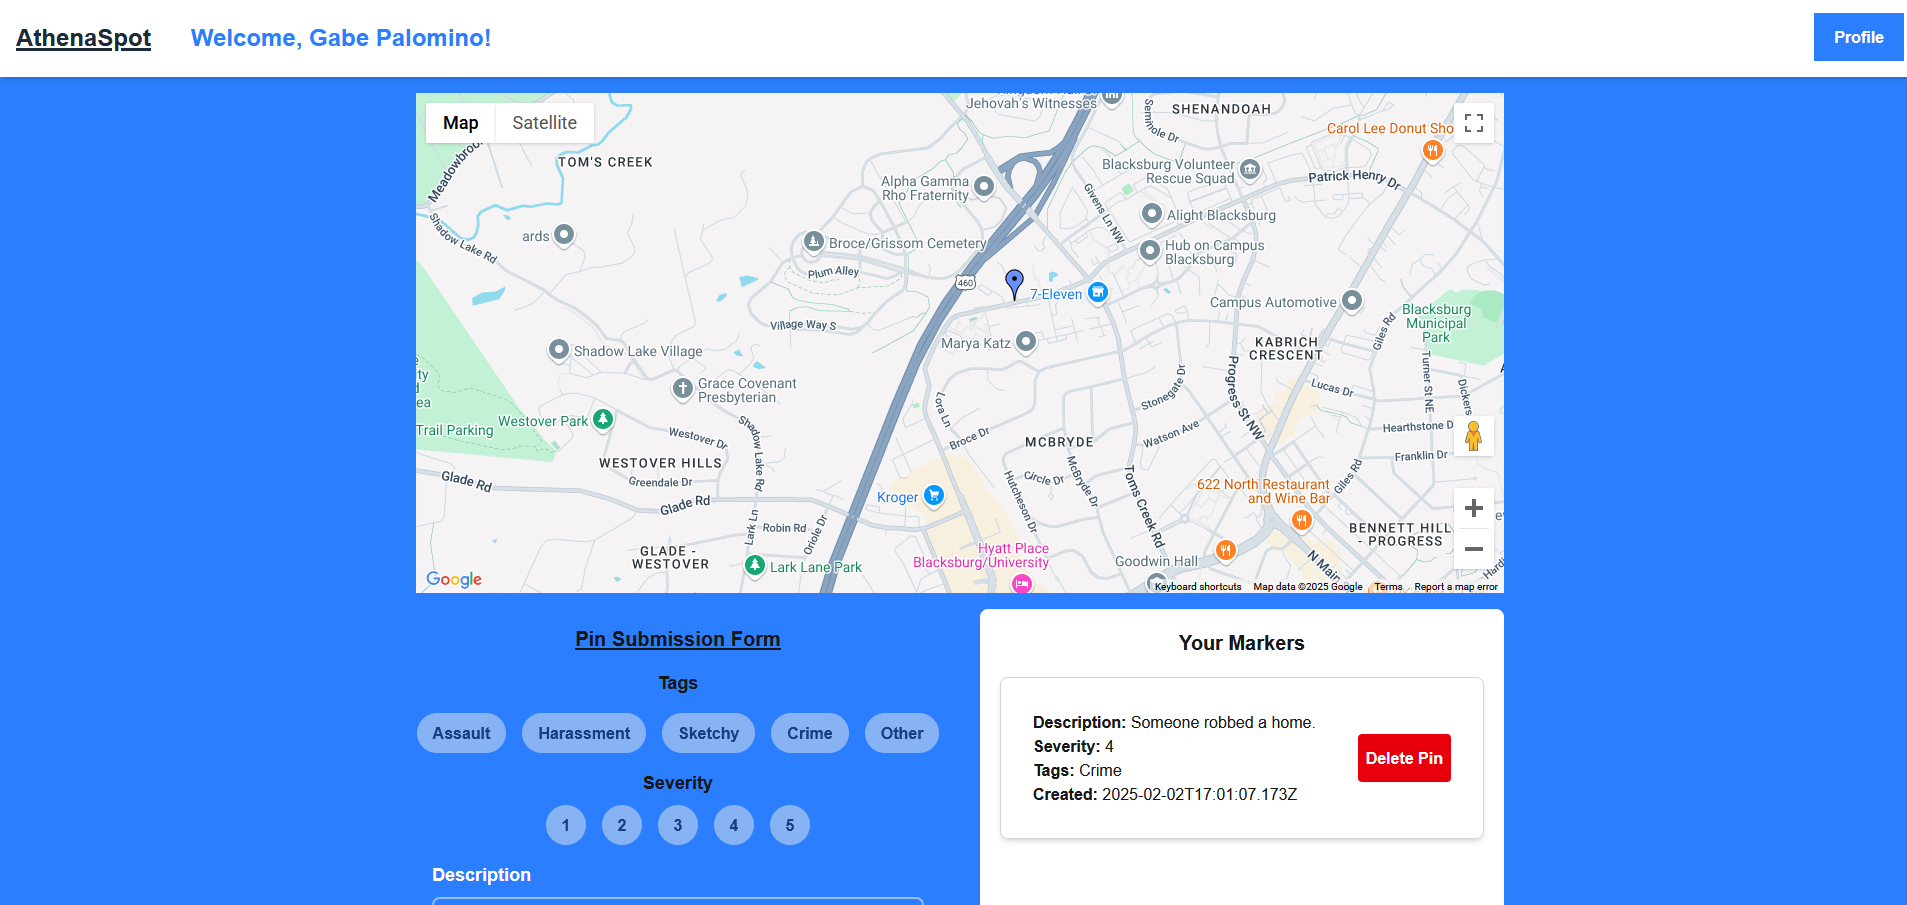
dashboard

Inspiration
Our goal was to create a simple application that allows users from all backgrounds to report incidents or dangers related to harassment, violence, and assault.
What it does
This application allows the user to place map pins around their area, tagging them with specific events that have happened in that location. They can provide a description and rate the severity of the situation. Other users can see the pins that the community has made as well! So that everyone stays informed.
How we built it
We utilized Next.js to develop the frontend. We integrated the Google Maps API and Firebase Auth to display pins on the global map for signed-in users. Additionally, we used MongoDB and Express.js to create an API that stores and retrieves pins for both the map and the user.
Challenges we ran into
One key challenge was implementing the database. Initially, we intended to use Firebase Firestore, but due to dependency issues, we opted for other backend frameworks to achieve our goals. Another challenge involved a bug related to signing out and loading a new map. The Google Maps API allows only one LoadScript component in the DOM tree, which caused an error when switching users. To resolve this, we created a LoadScript provider for the app, ensuring the component is rendered once and then passed down the DOM tree
Accomplishments that we're proud of
We are proud to have developed a fully functional application that displays pins for multiple users. This information can be especially useful for everyone, particularly women who may encounter such dangers on the street or campus.
What we learned
We learned how to effectively integrate APIs into our frontend application and gained deeper knowledge of the Google Maps API. This API provides valuable, user-generated information that can be crucial for mapping out potential dangers.
What's next for AthenaSpot
We aim to expand the number of tags available for users and potentially allow them to create their own. Additionally, we plan to integrate different pin colors to indicate the severity of each situation. Lastly, implementing a heat map feature for a zoomed-out perspective would be a valuable enhancement, as it would visually represent the density of pins in a given area.

Log in or sign up for Devpost to join the conversation.