-
-
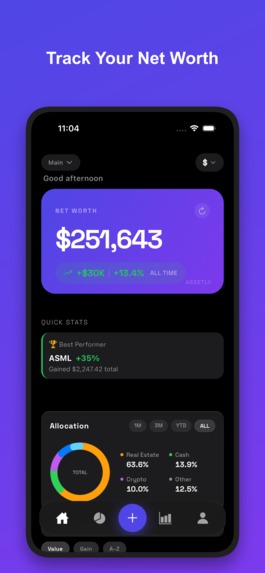
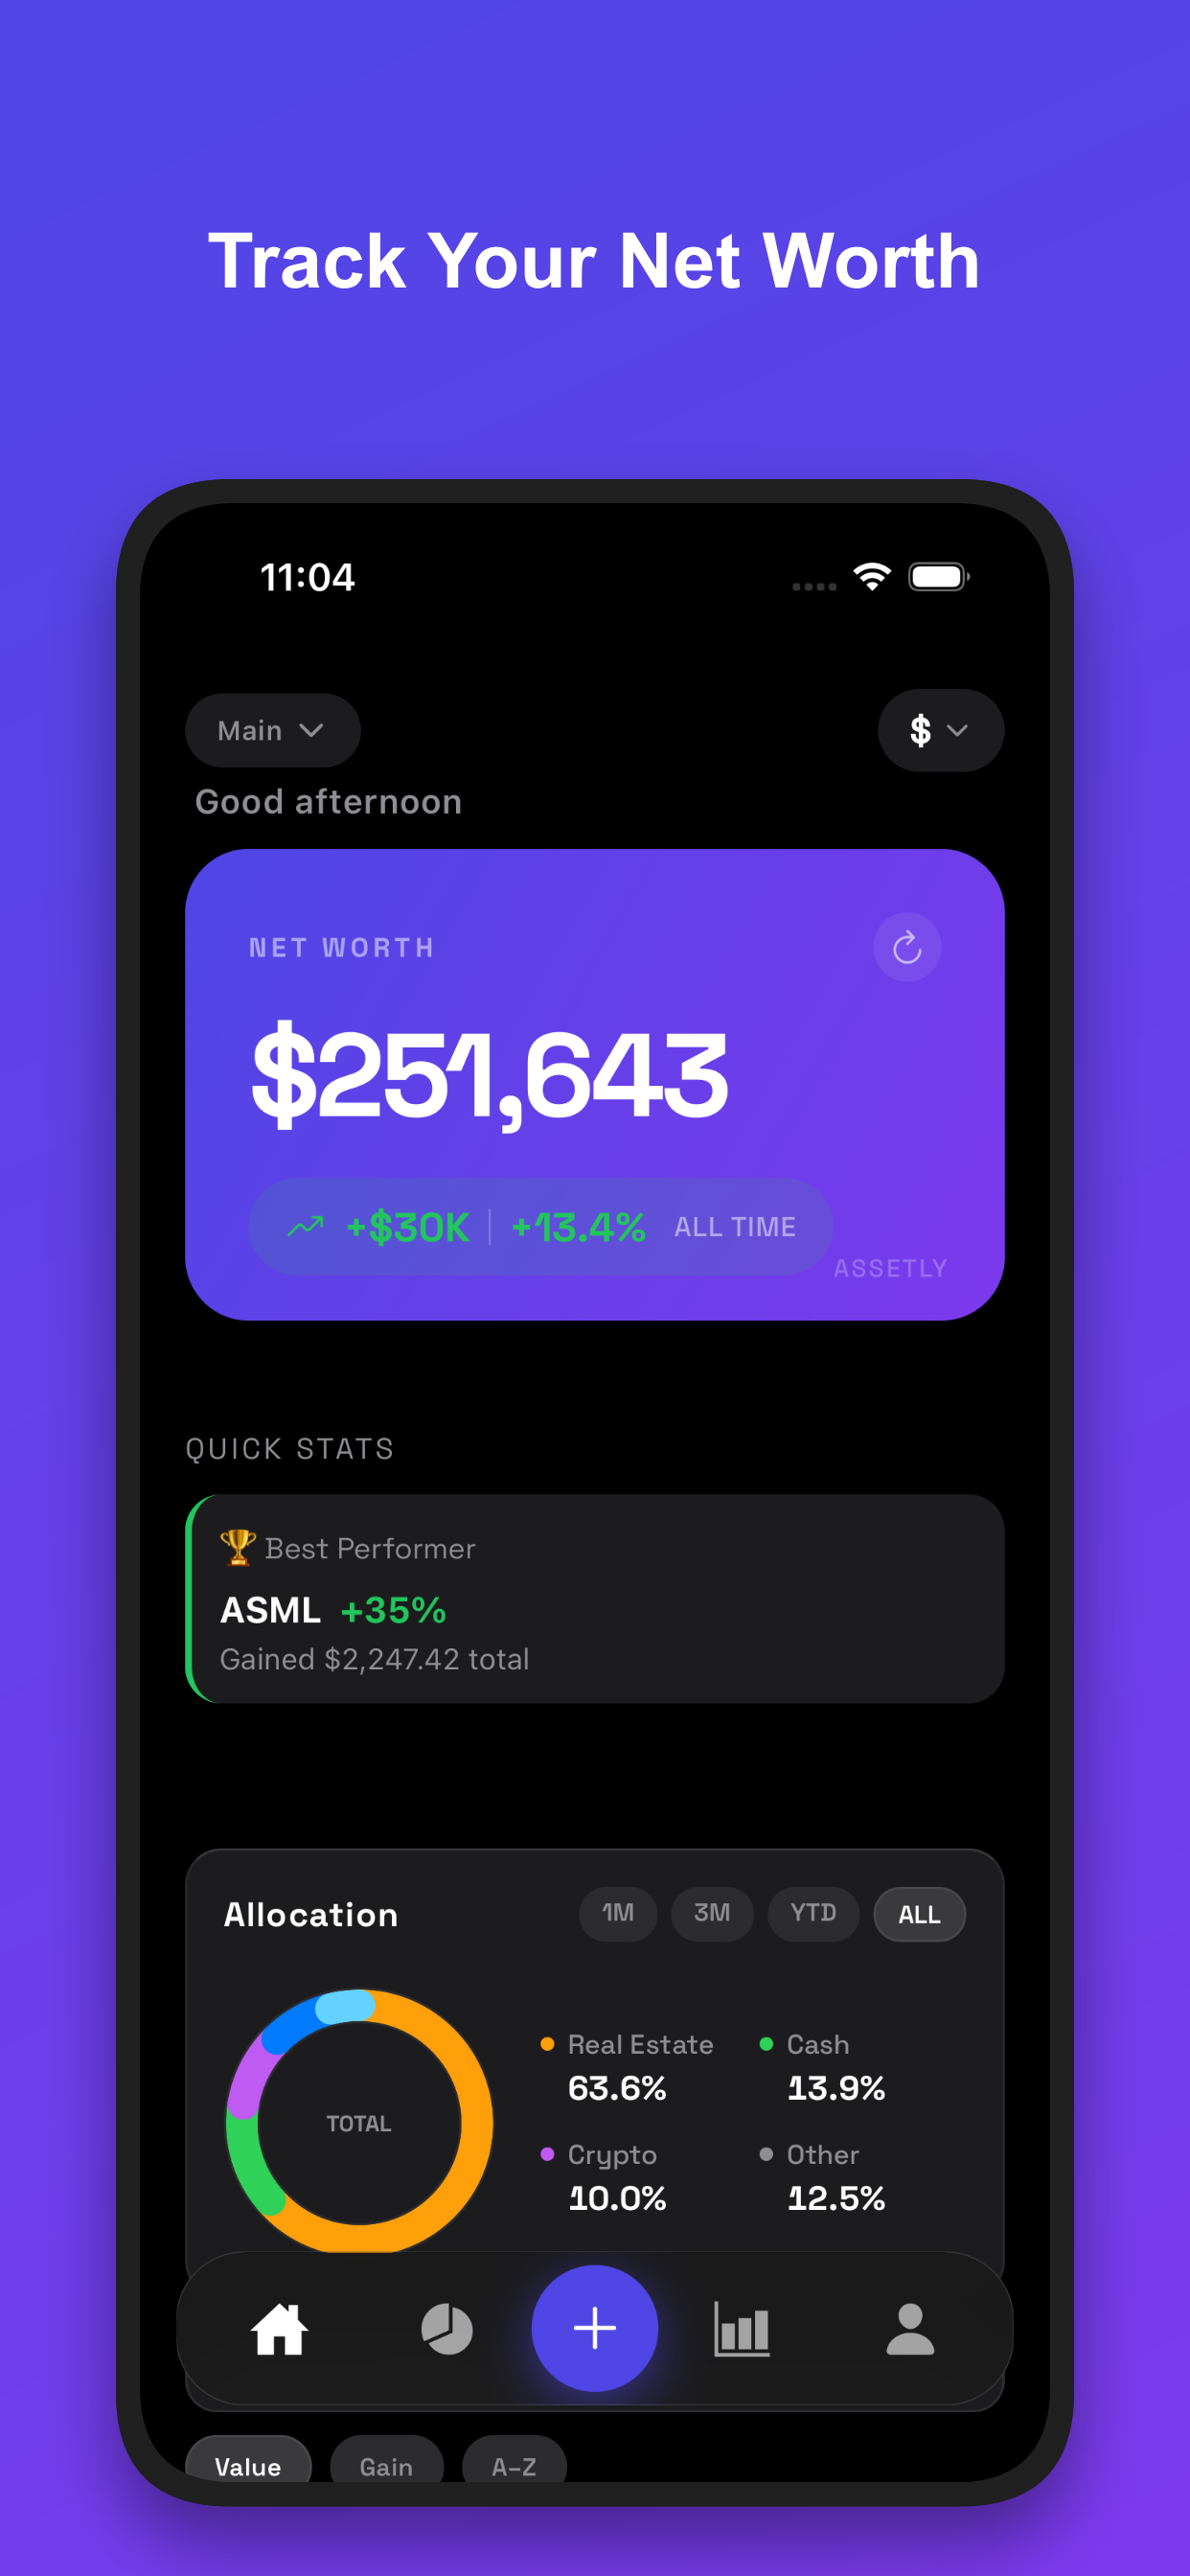
Track your net worth
-

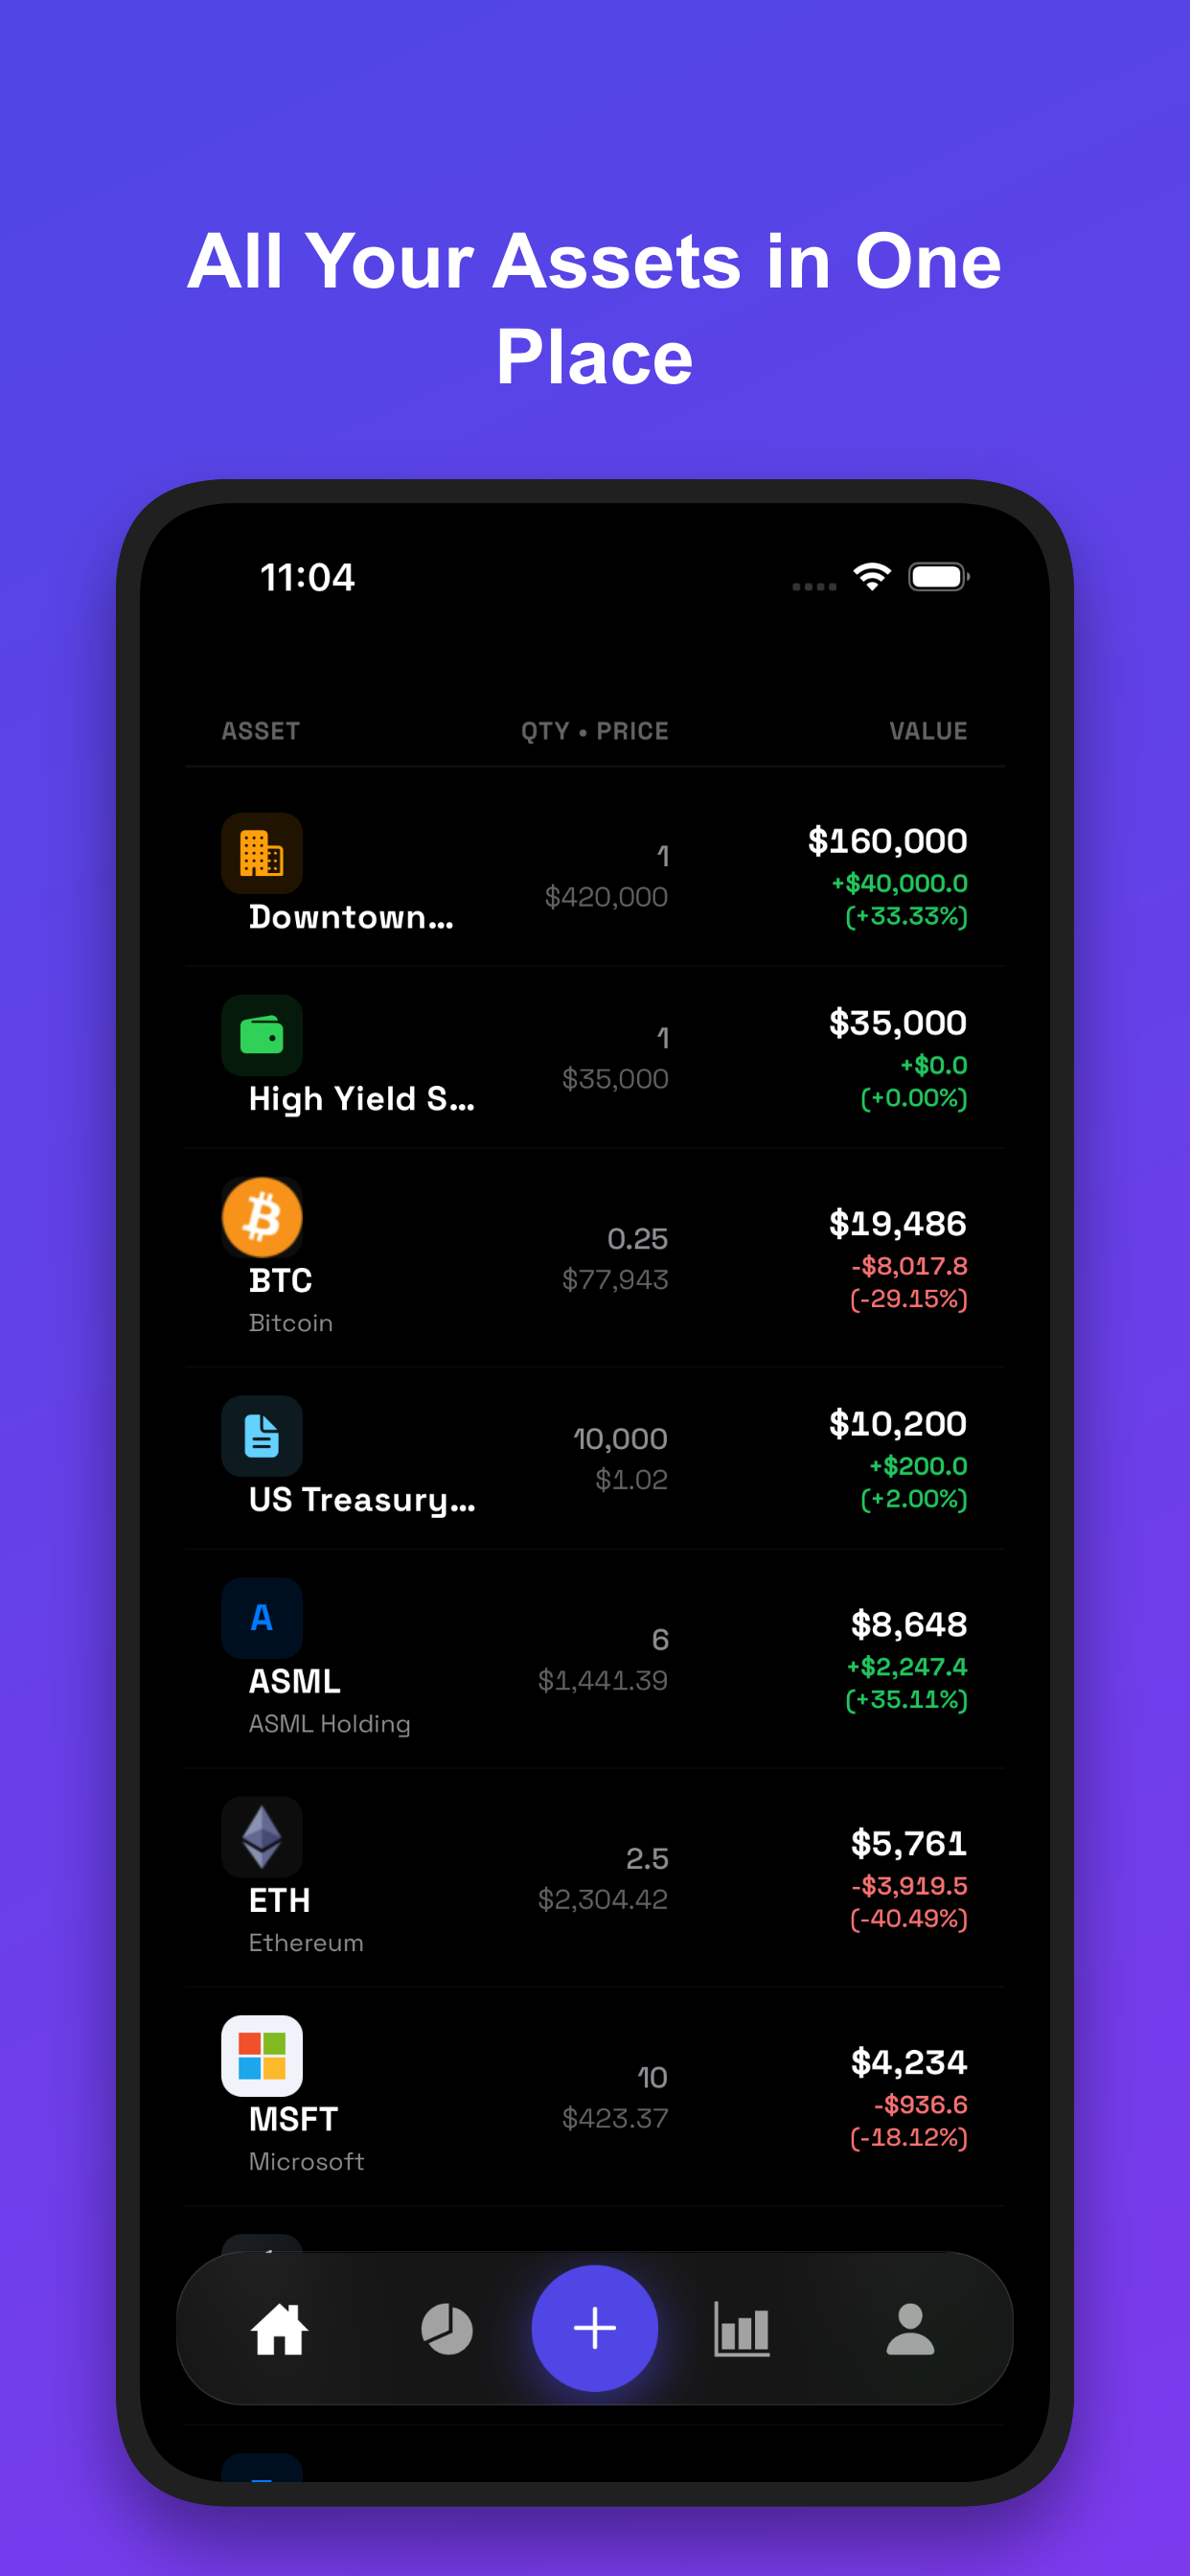
All your assets in one private book
-

Risk analysis
-
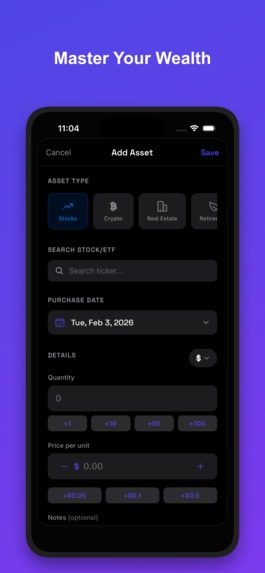
Master your wealth
-

Unlock Insights

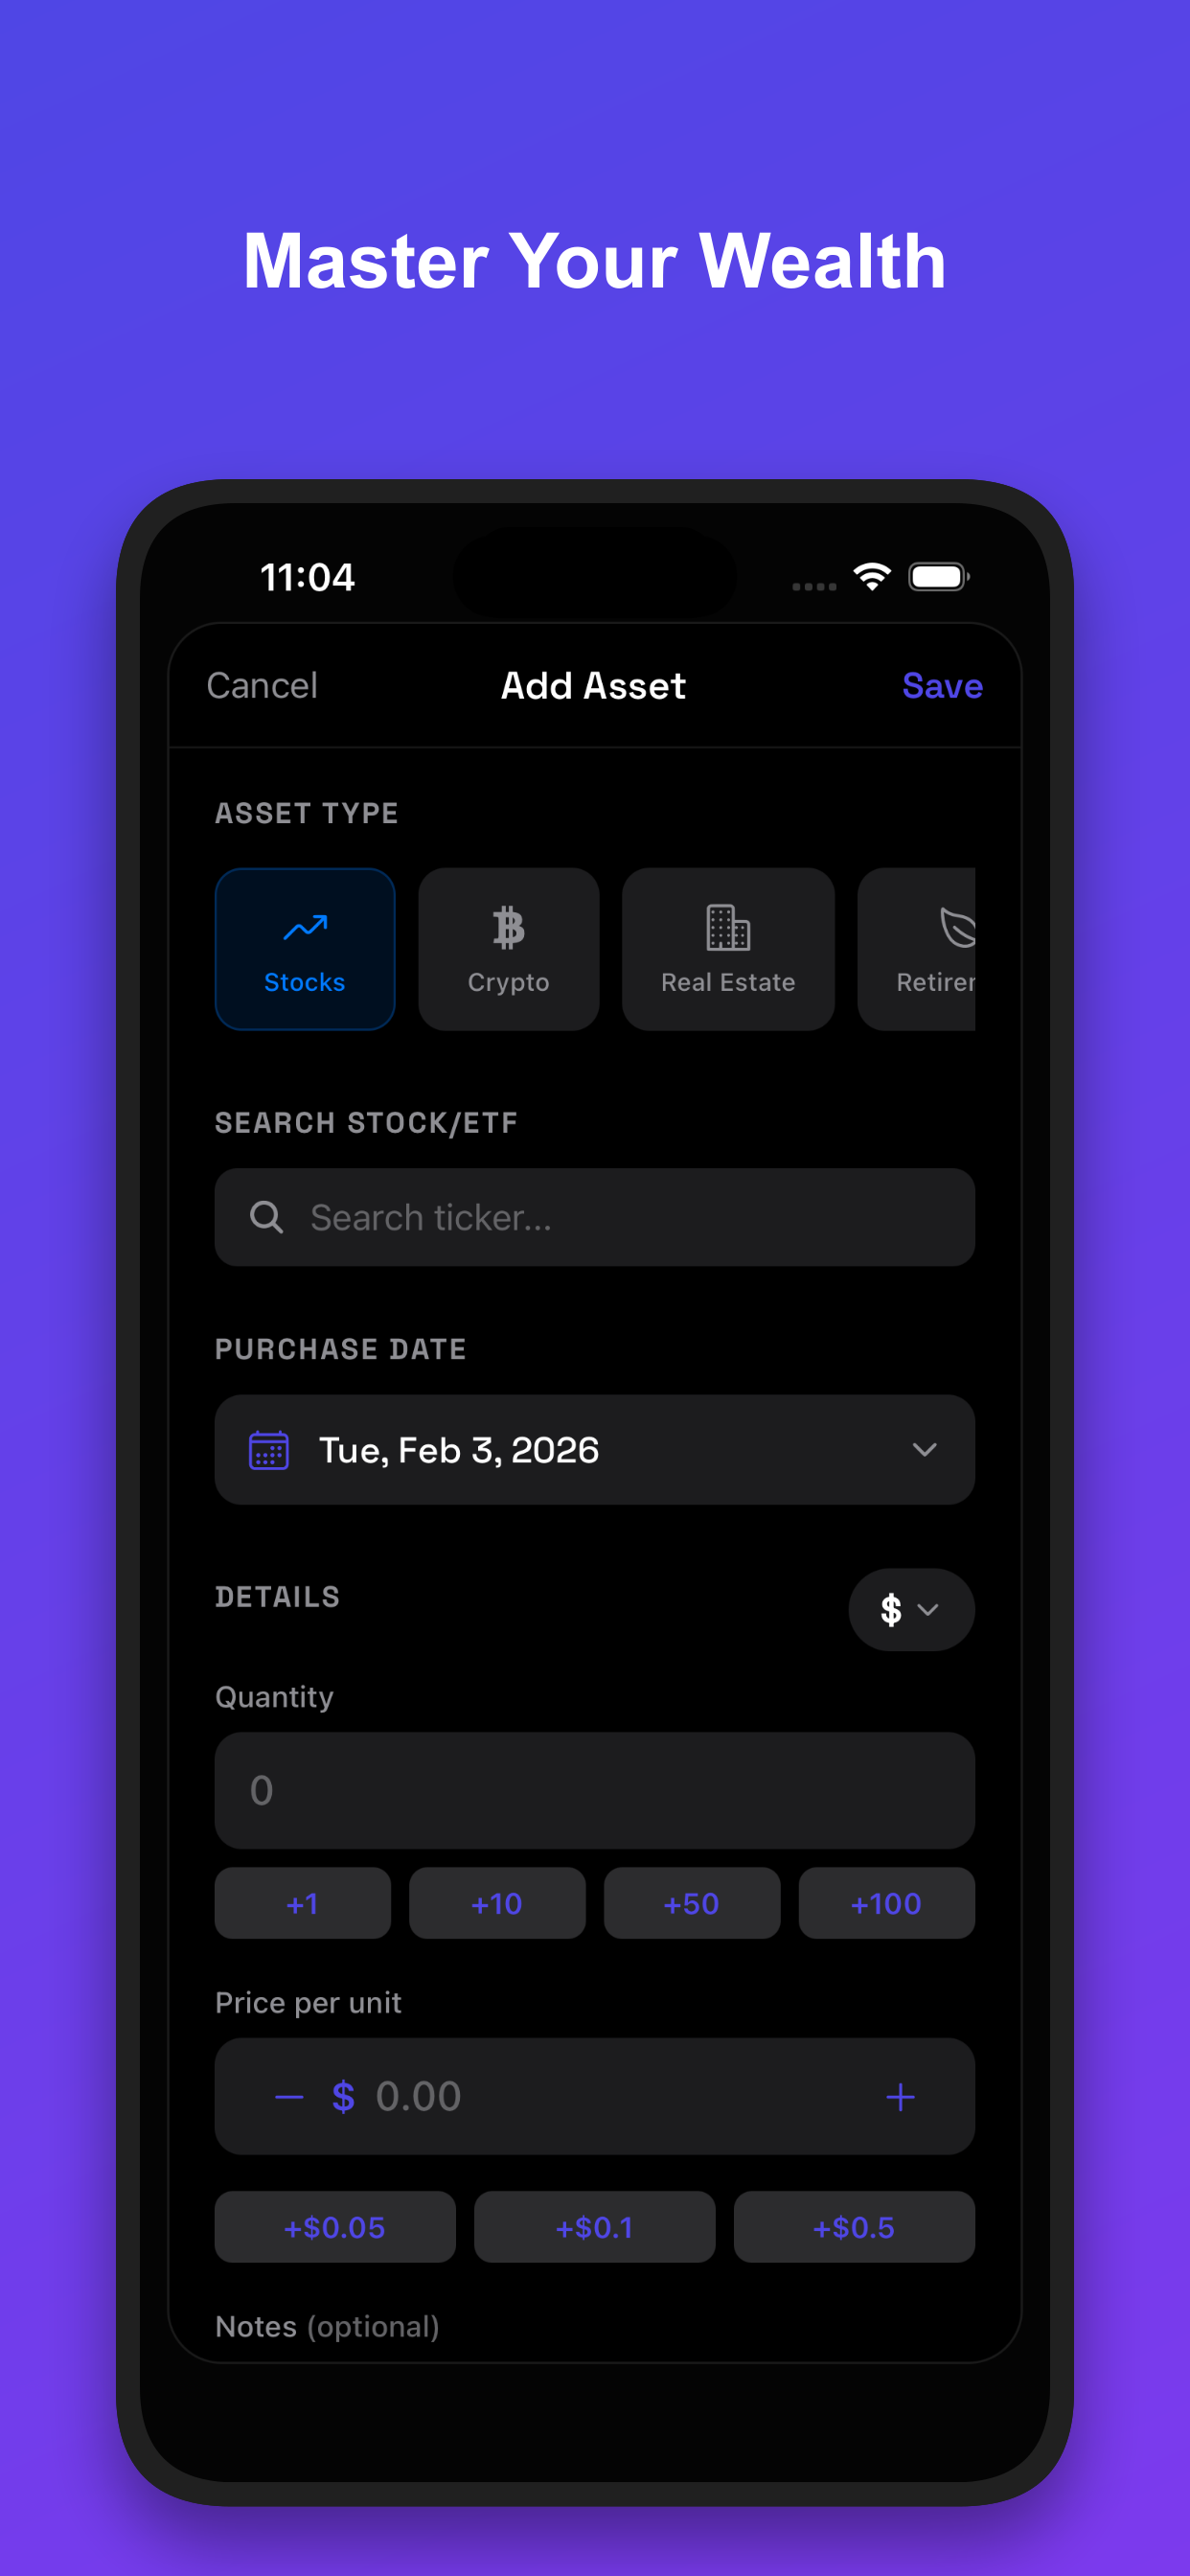
The Assetly Story Inspiration The idea for Assetly was born from a simple, painful truth that Josh highlighted: Modern investing is a fragmented mess.
Most of us don't just use one bank anymore. we have stocks in one app (e.g., Renta 4), commodities like Gold/Silver in another (e.g., XTB), crypto in cold storage, and real estate offline. Trying to answer the simple question "What is my total net worth?" requires a spreadsheet, three logins, and a calculator.
We were inspired to build the "Private Notebook" for the modern investor—a single, privacy-focused dashboard that brings order to this chaos without demanding your bank passwords.
What it does Assetly is a cross-platform wealth tracker that unifies every asset class.
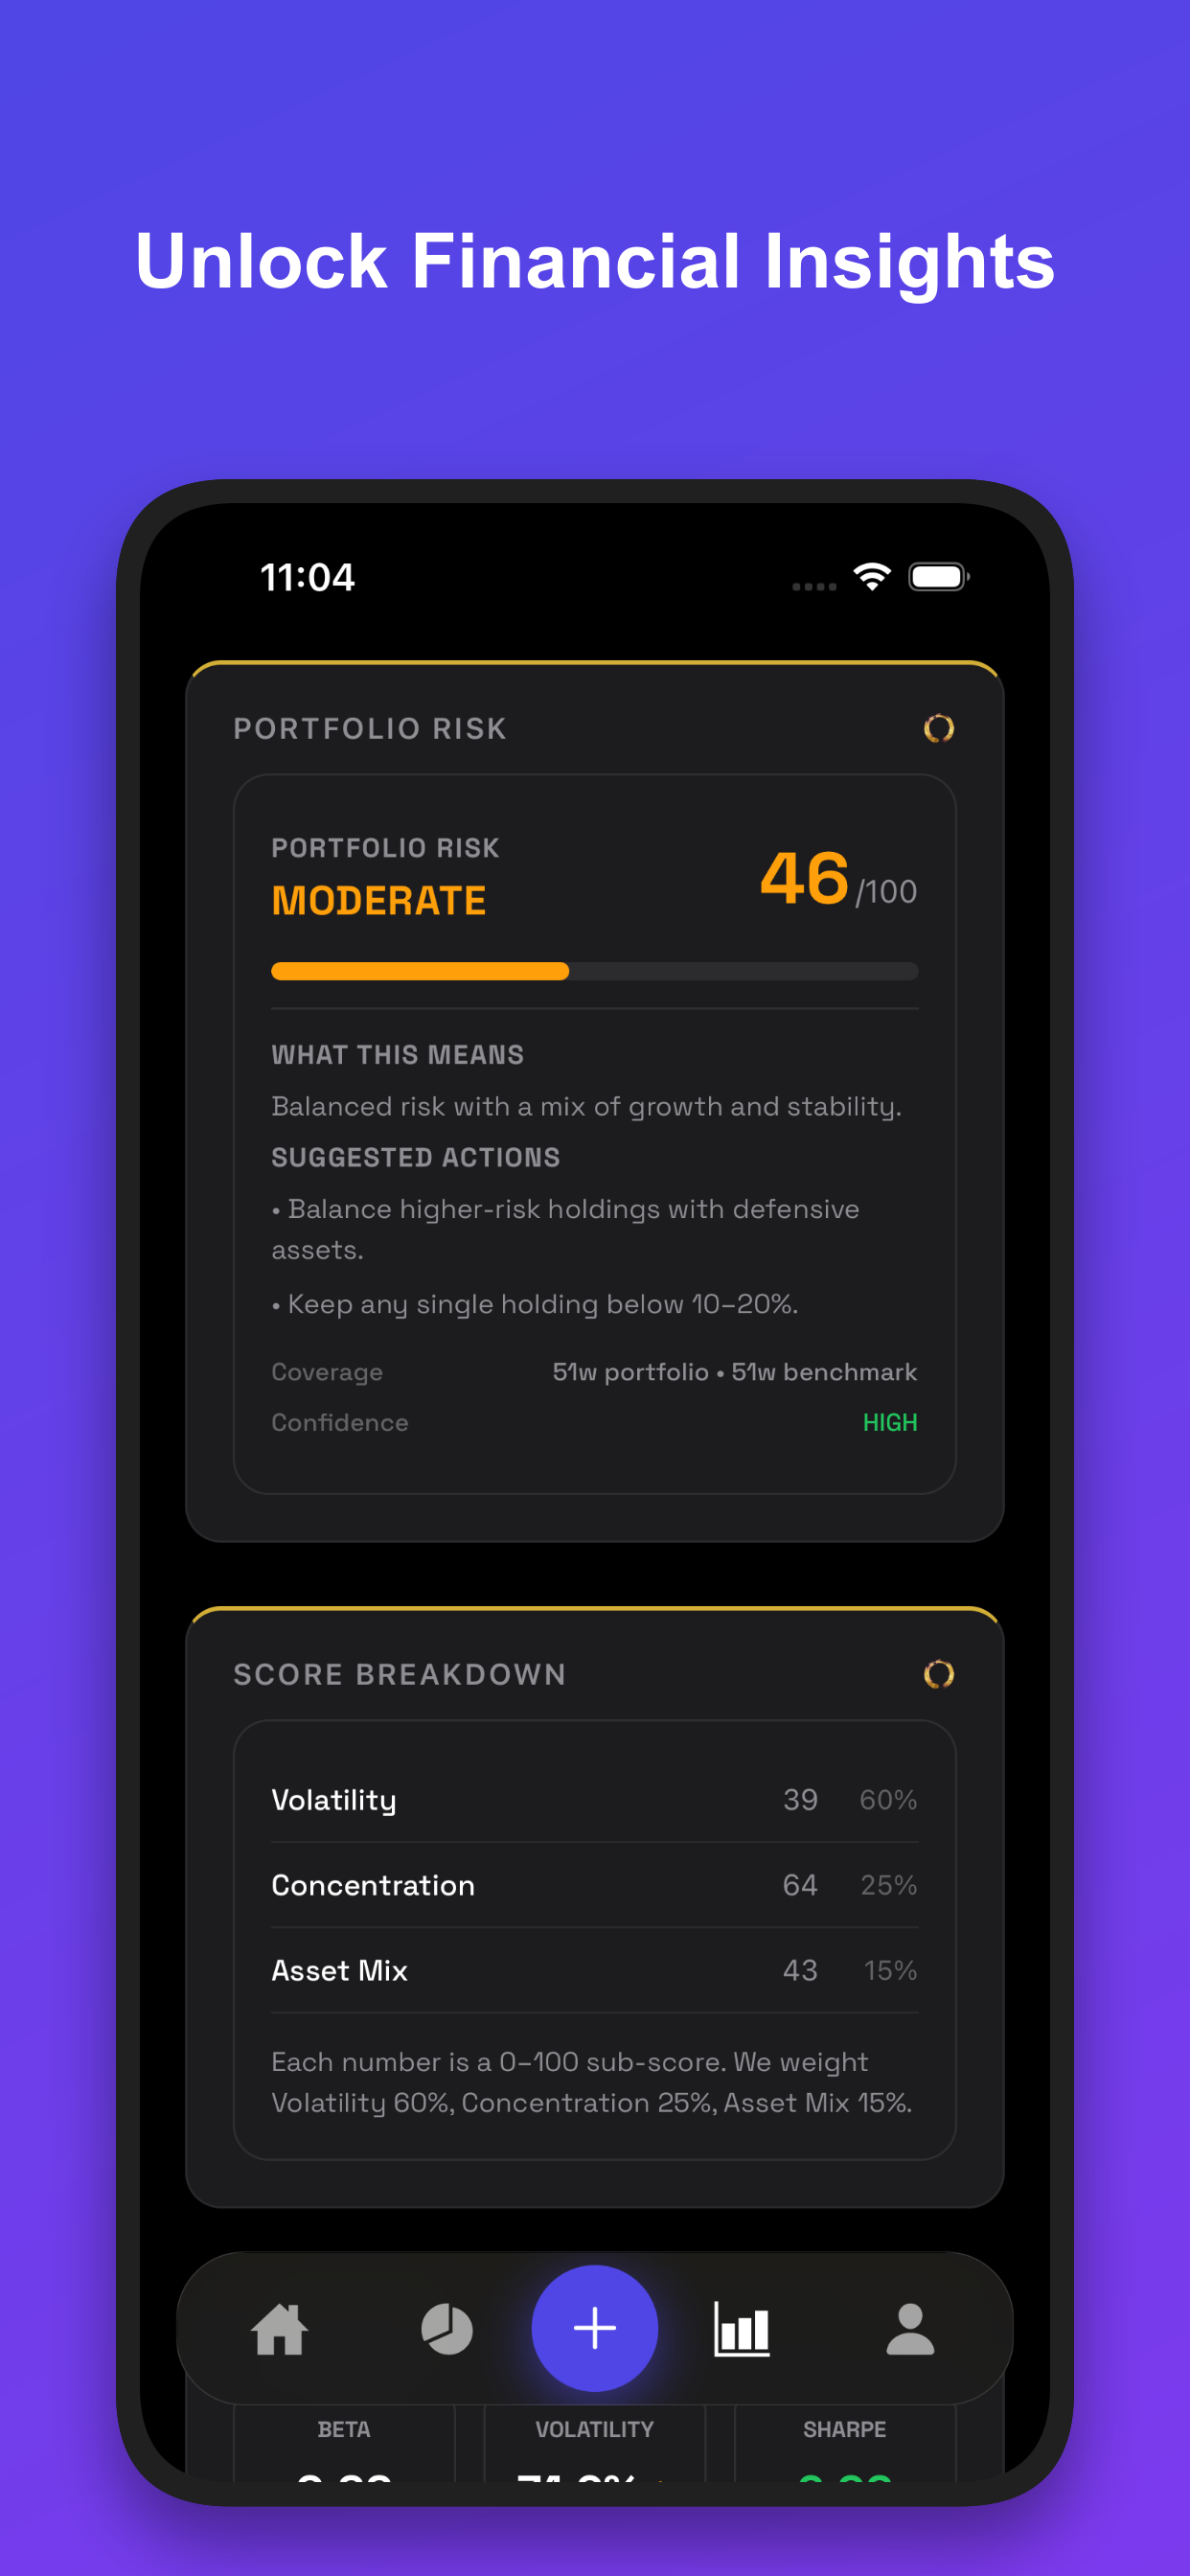
Universal Tracking: Whether it's US Tech stocks, physical gold bars, or a rental apartment, it all lives in one view. Automated Privacy: Prices update in real-time for public assets, but the data never leaves the user's device. Pro Risk Analysis: Directly inspired by Josh's request, we built a premium "Risk Engine" that analyzes portfolio diversification. How we built it We prioritized performance and privacy above all else.
Core: Built with React Native and Expo to ensure a high-performance native experience on both iOS and Android. Data Layer: We used Zustand for complex state management, ensuring that even with thousands of transactions, the app remains buttery smooth. Monetization: We integrated RevenueCat to seamlessly handle subscriptions for the "Assetly Pro" tier, which unlocks the advanced risk metrics. Design: We utilized expo-blur and expo-linear-gradient to create a "Premium Dark" aesthetic that feels professional and trustworthy. Challenges we faced The biggest technical hurdle was standardizing the math across vastly different asset classes. How do you calculate the volatility risk of a "Bitcoin" vs. a "Fixed Rate Bond" vs. a "Vintage Watch" in the same equation?
managed to abstract these into a unified Asset interface, allowing our risk engine to apply portfolio variance formulas universally:
$$ \sigma_p^2 = \sum_{i} w_i^2 \sigma_i^2 + \sum_{i} \sum_{j \neq i} w_i w_j \sigma_i \sigma_j \rho_{ij} $$
Where $\sigma_p$ is portfolio volatility, $w$ is asset weight, and $\rho$ is the correlation between assets.
Solving this on-device without a heavy backend server was a complex optimization challenge, but it allowed us to keep our promise: Your data stays yours.
Built With
- chatgpt
- claude
- gemini
- replit

Log in or sign up for Devpost to join the conversation.