-
-
Landing Page1
-
Landing Page2
-
Landing Page3
-
Landing Page4
-
Landing Page5
-
Signup
-
Signin
-
Dashboard
-
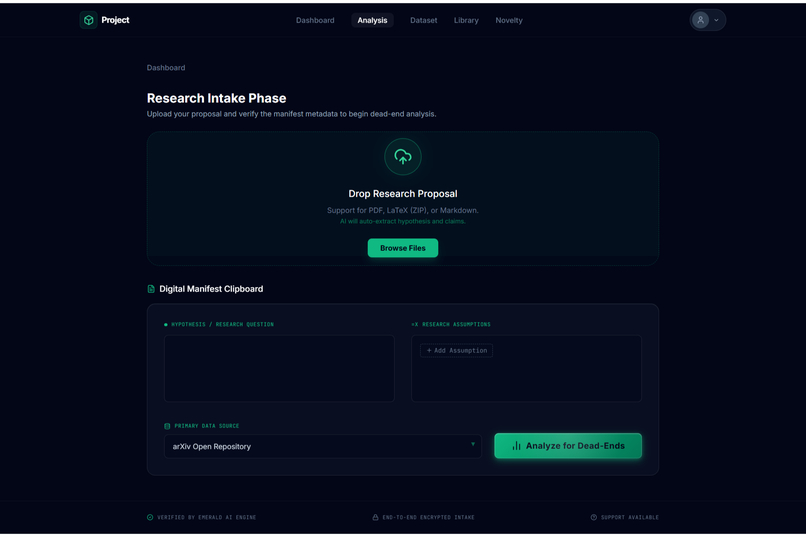
Research Intake/File upload1
-

Research Intake/File upload2
-
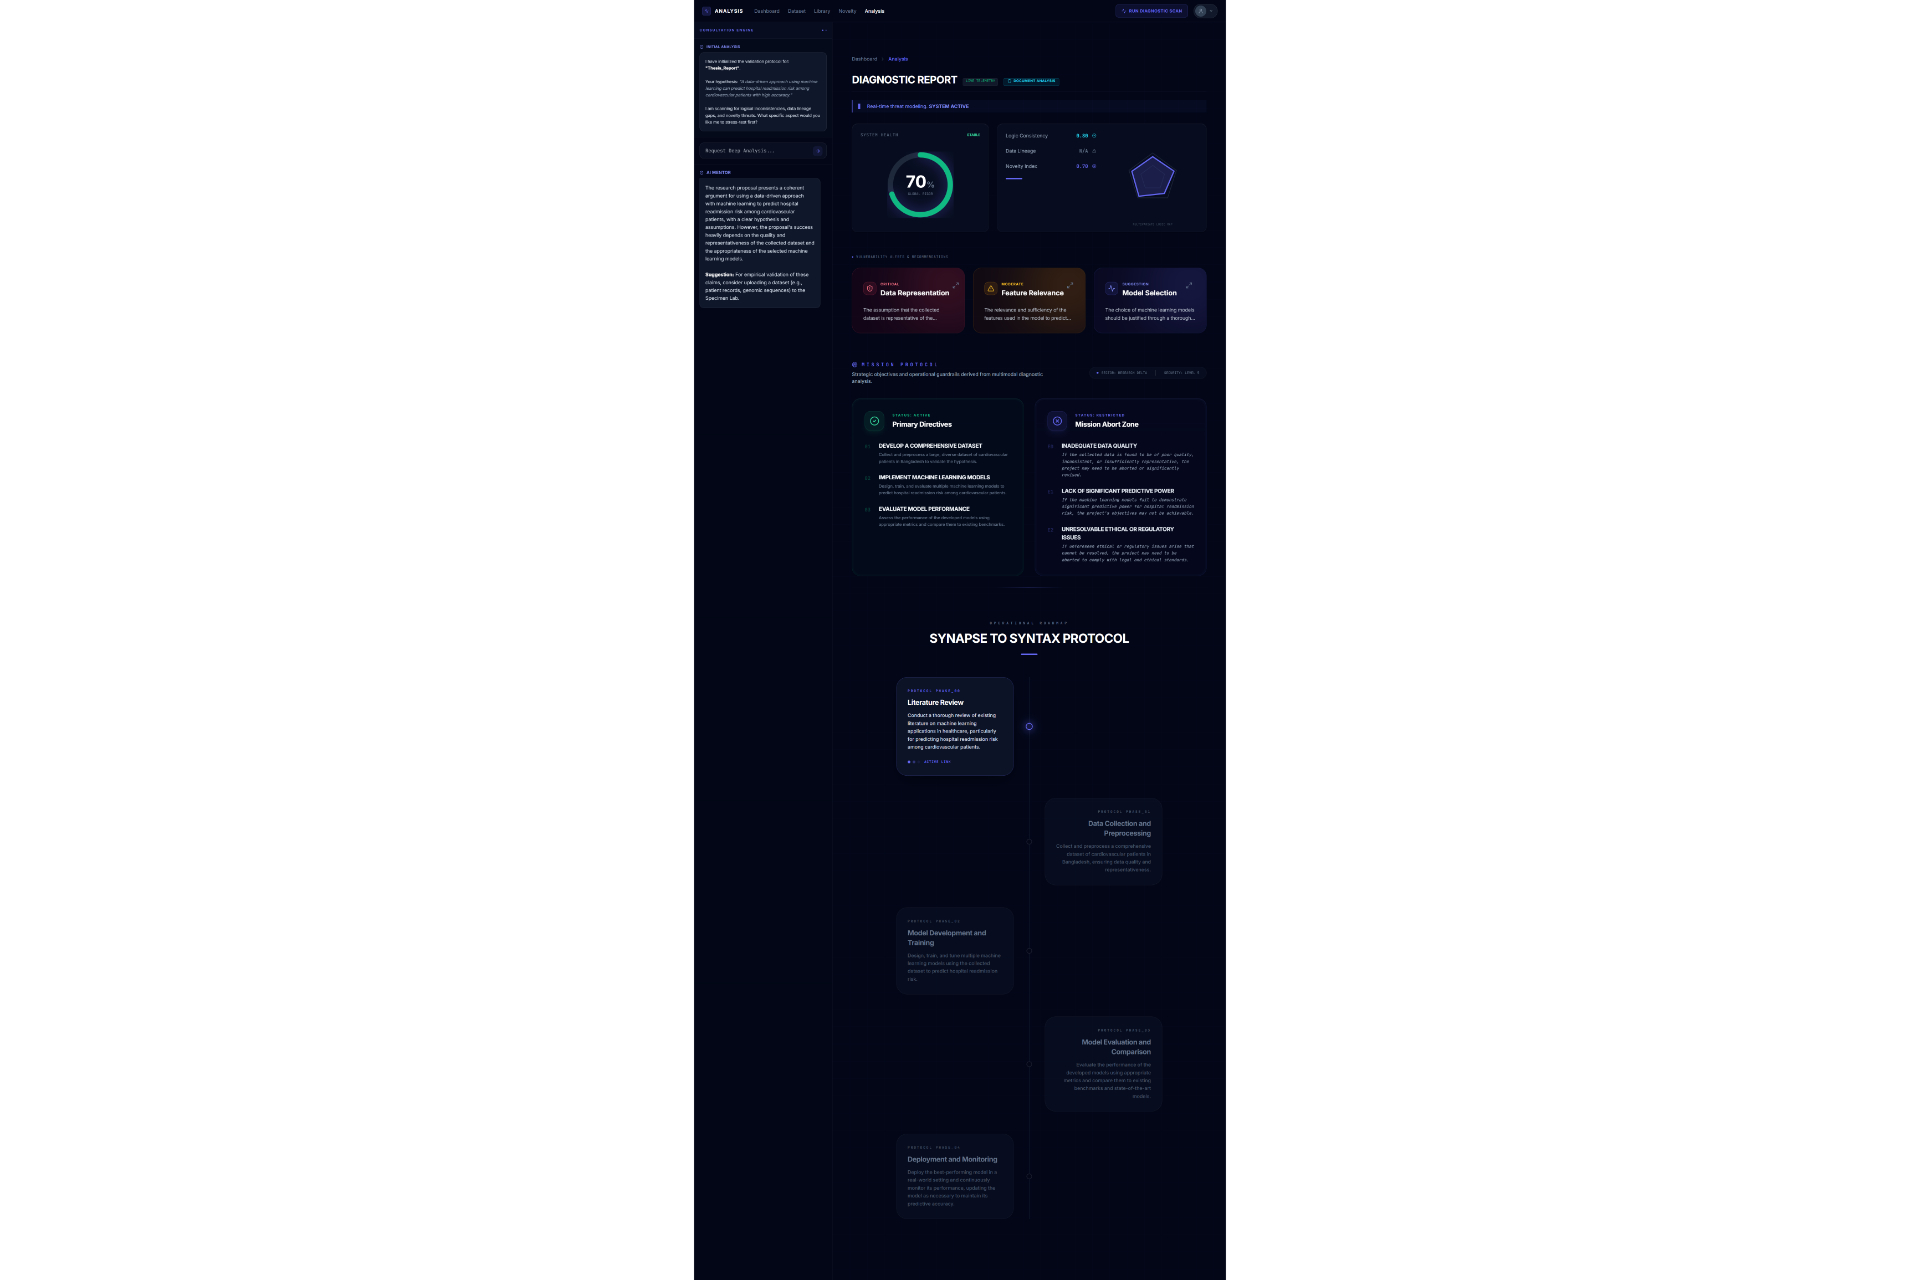
Analysis1
-
Dataset
-
Analysis2
-
Novelty Check1
-
Novelty Check2
-
Library
-
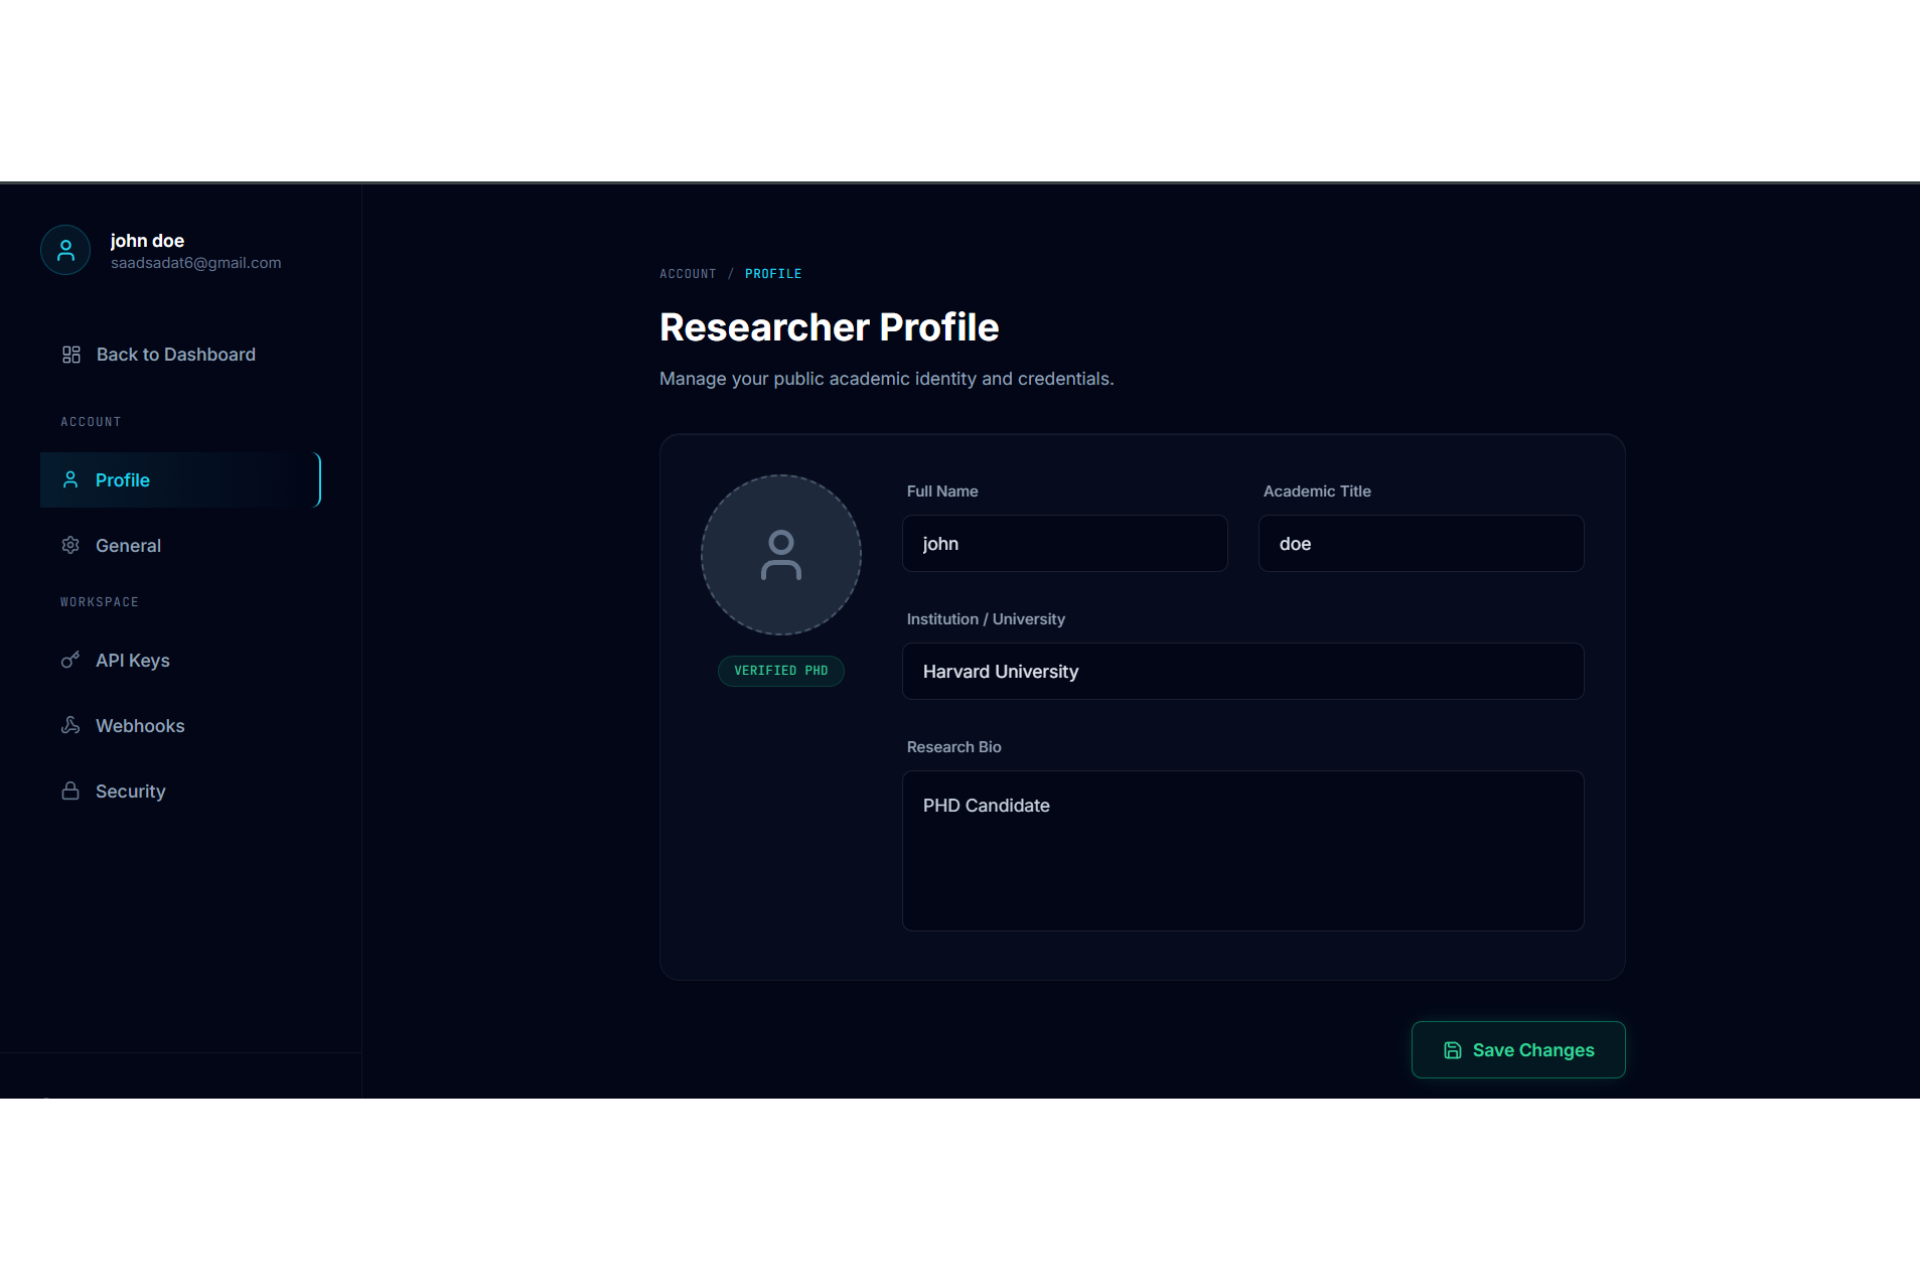
Profile
-
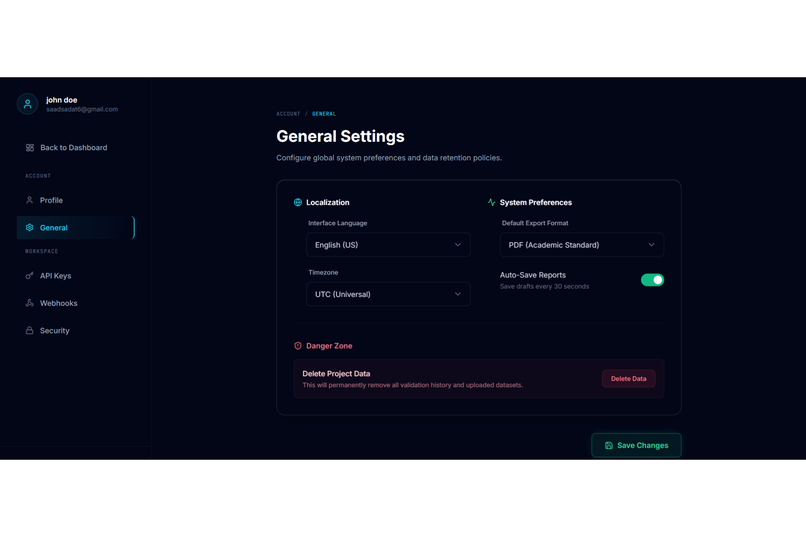
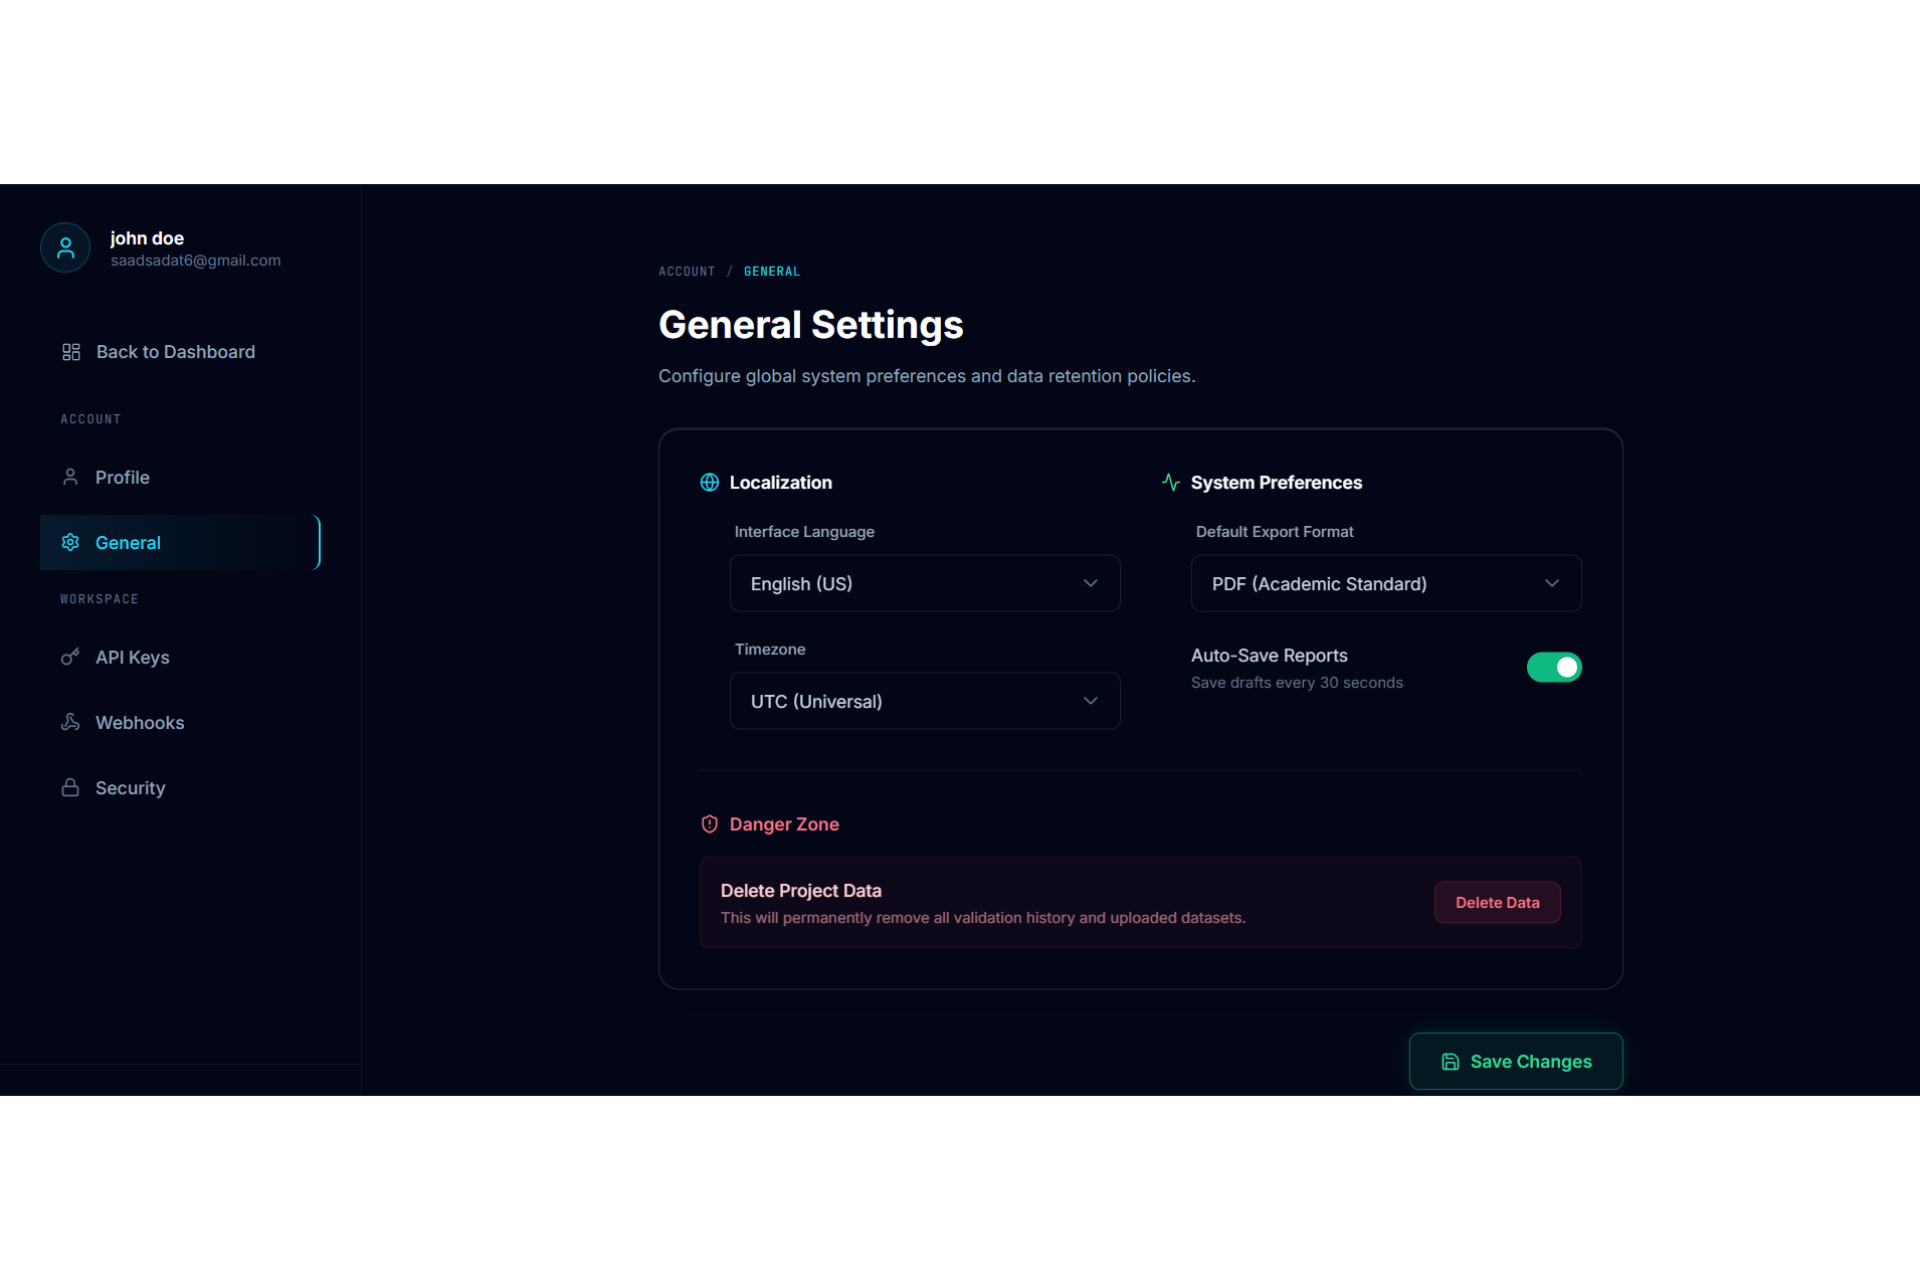
General Settings
-
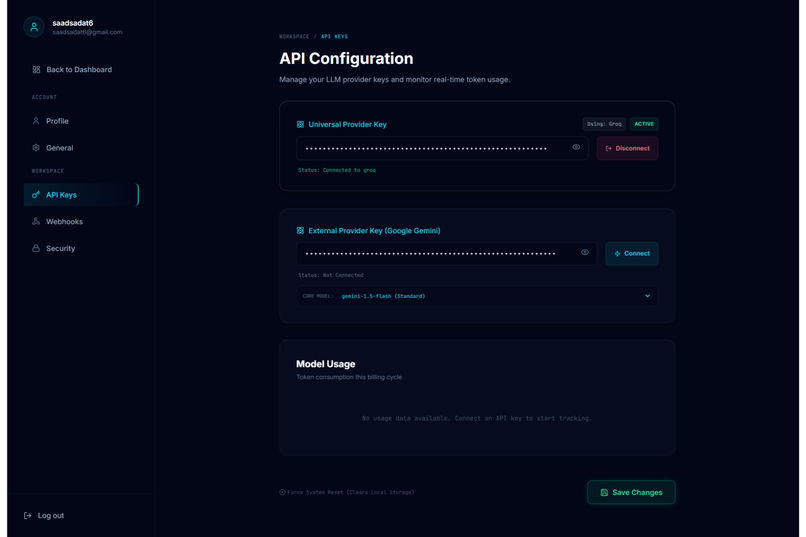
API Configuration
-
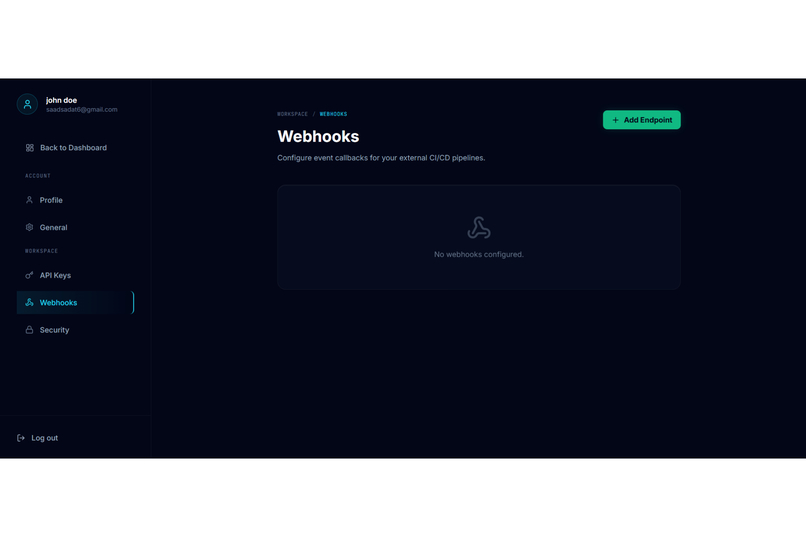
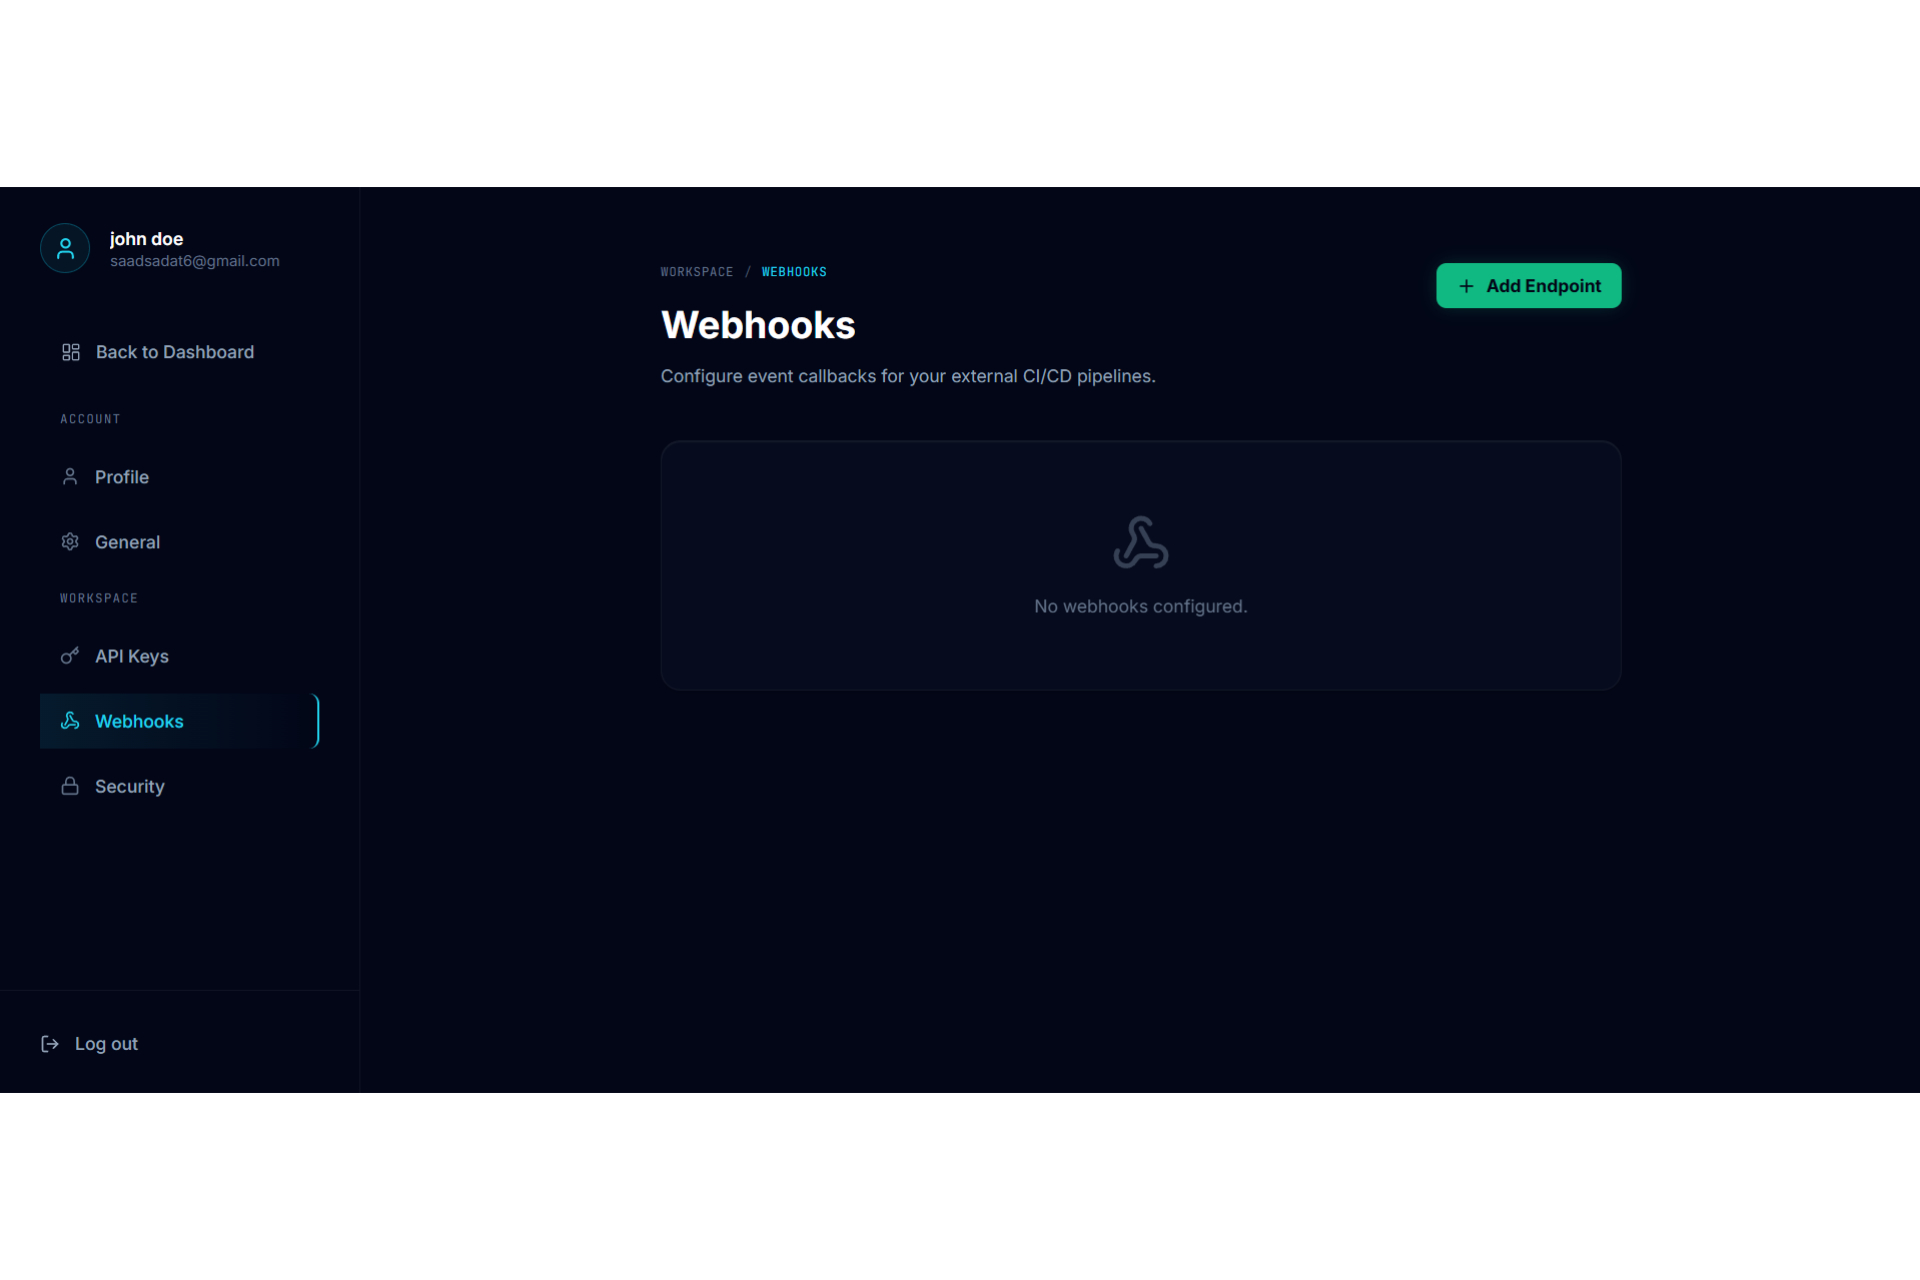
Webhooks
-
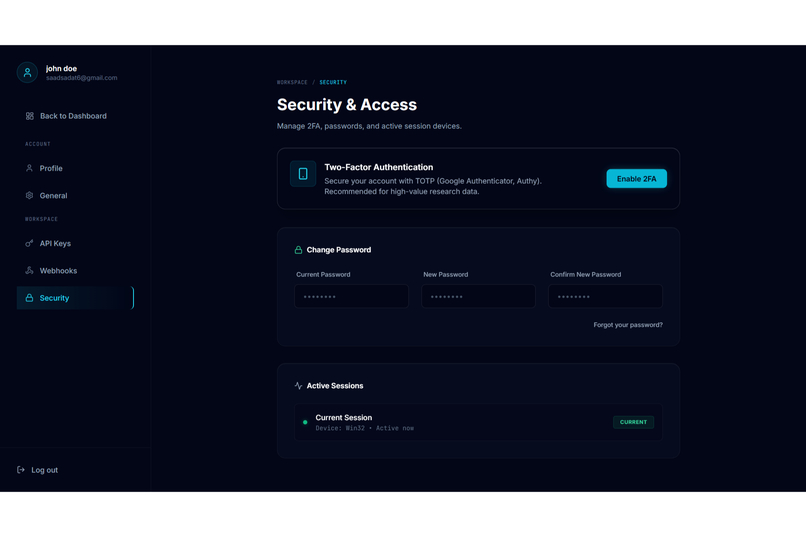
Security

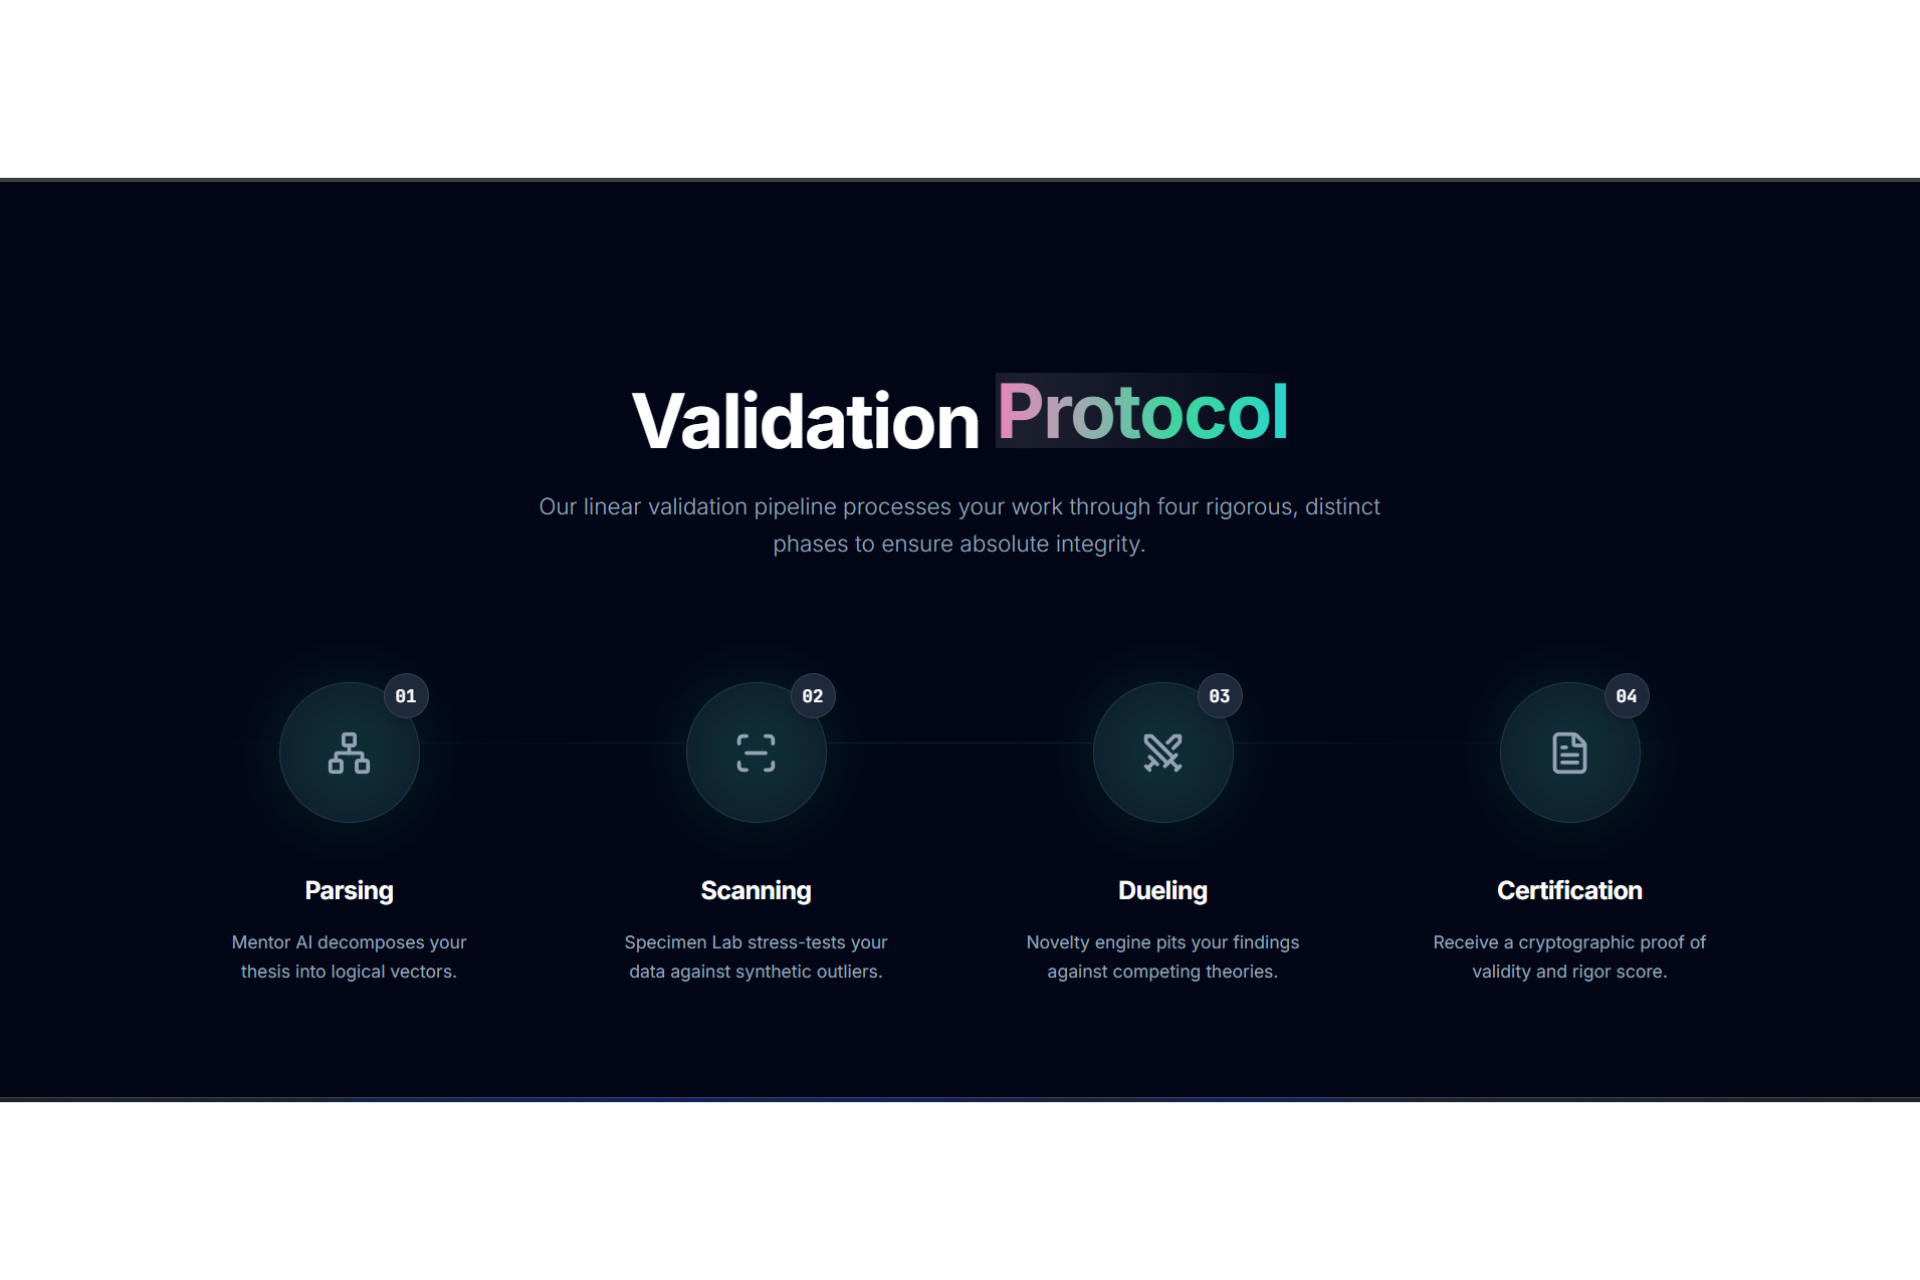


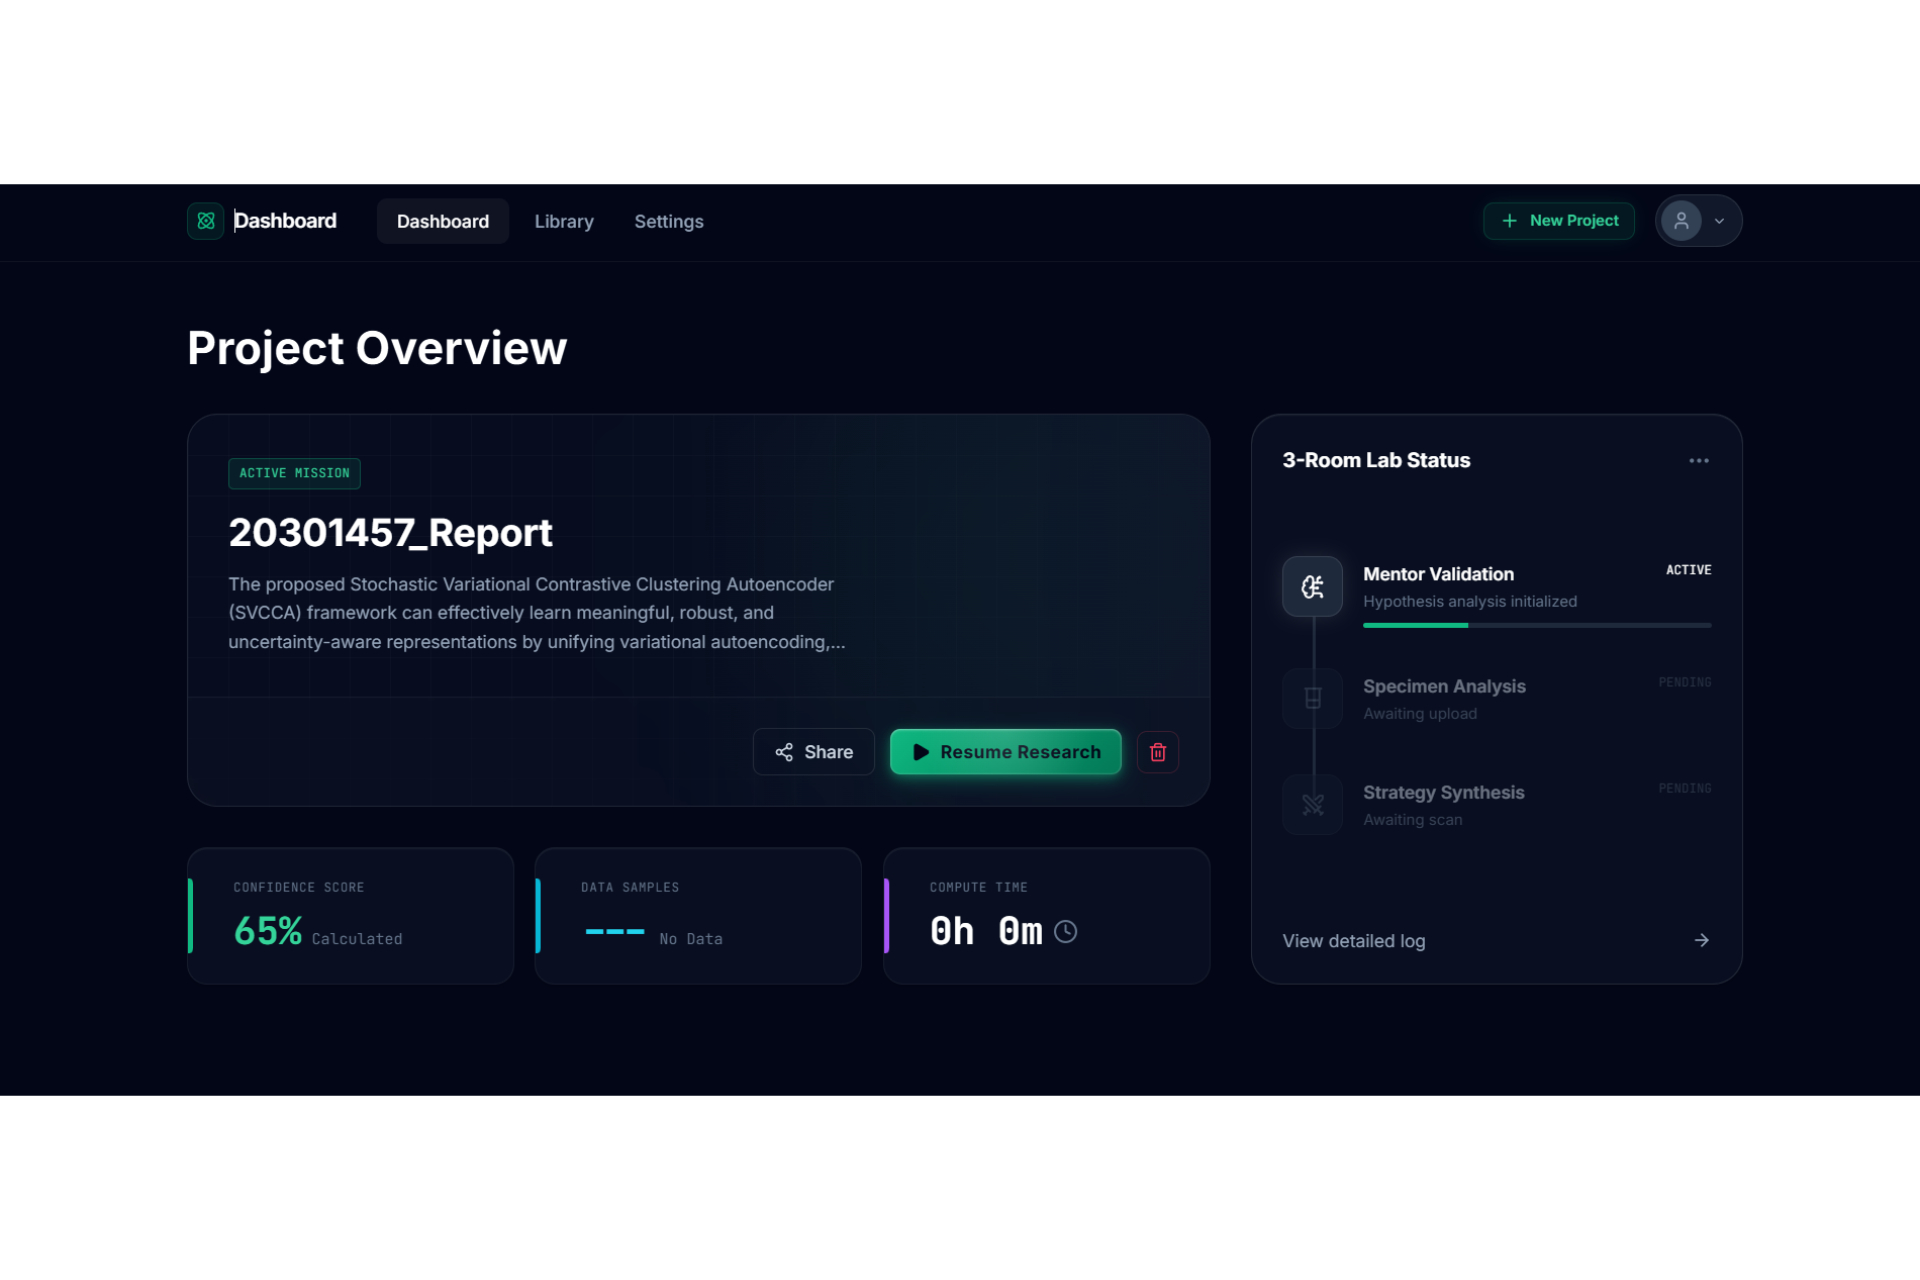
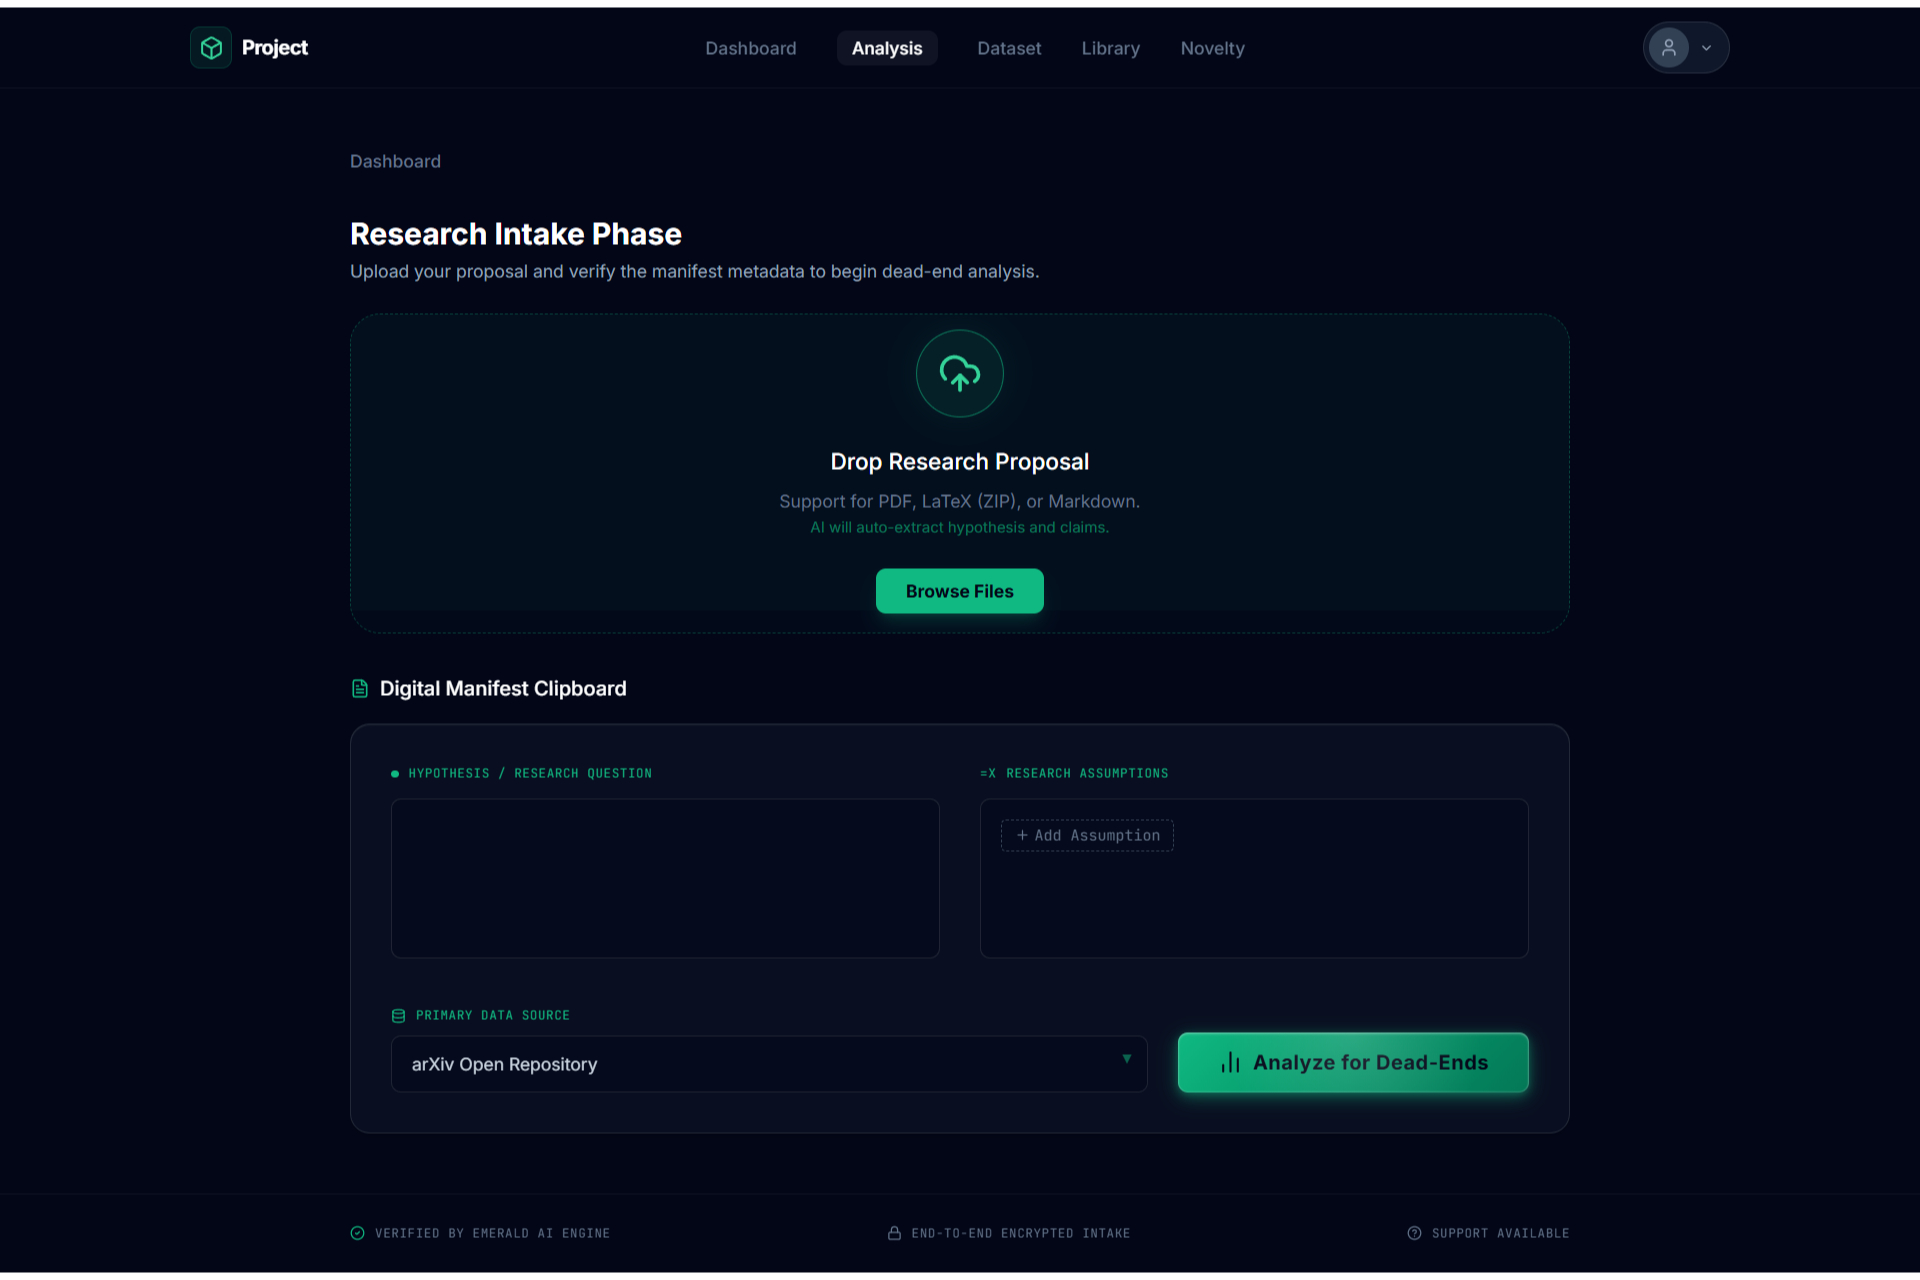
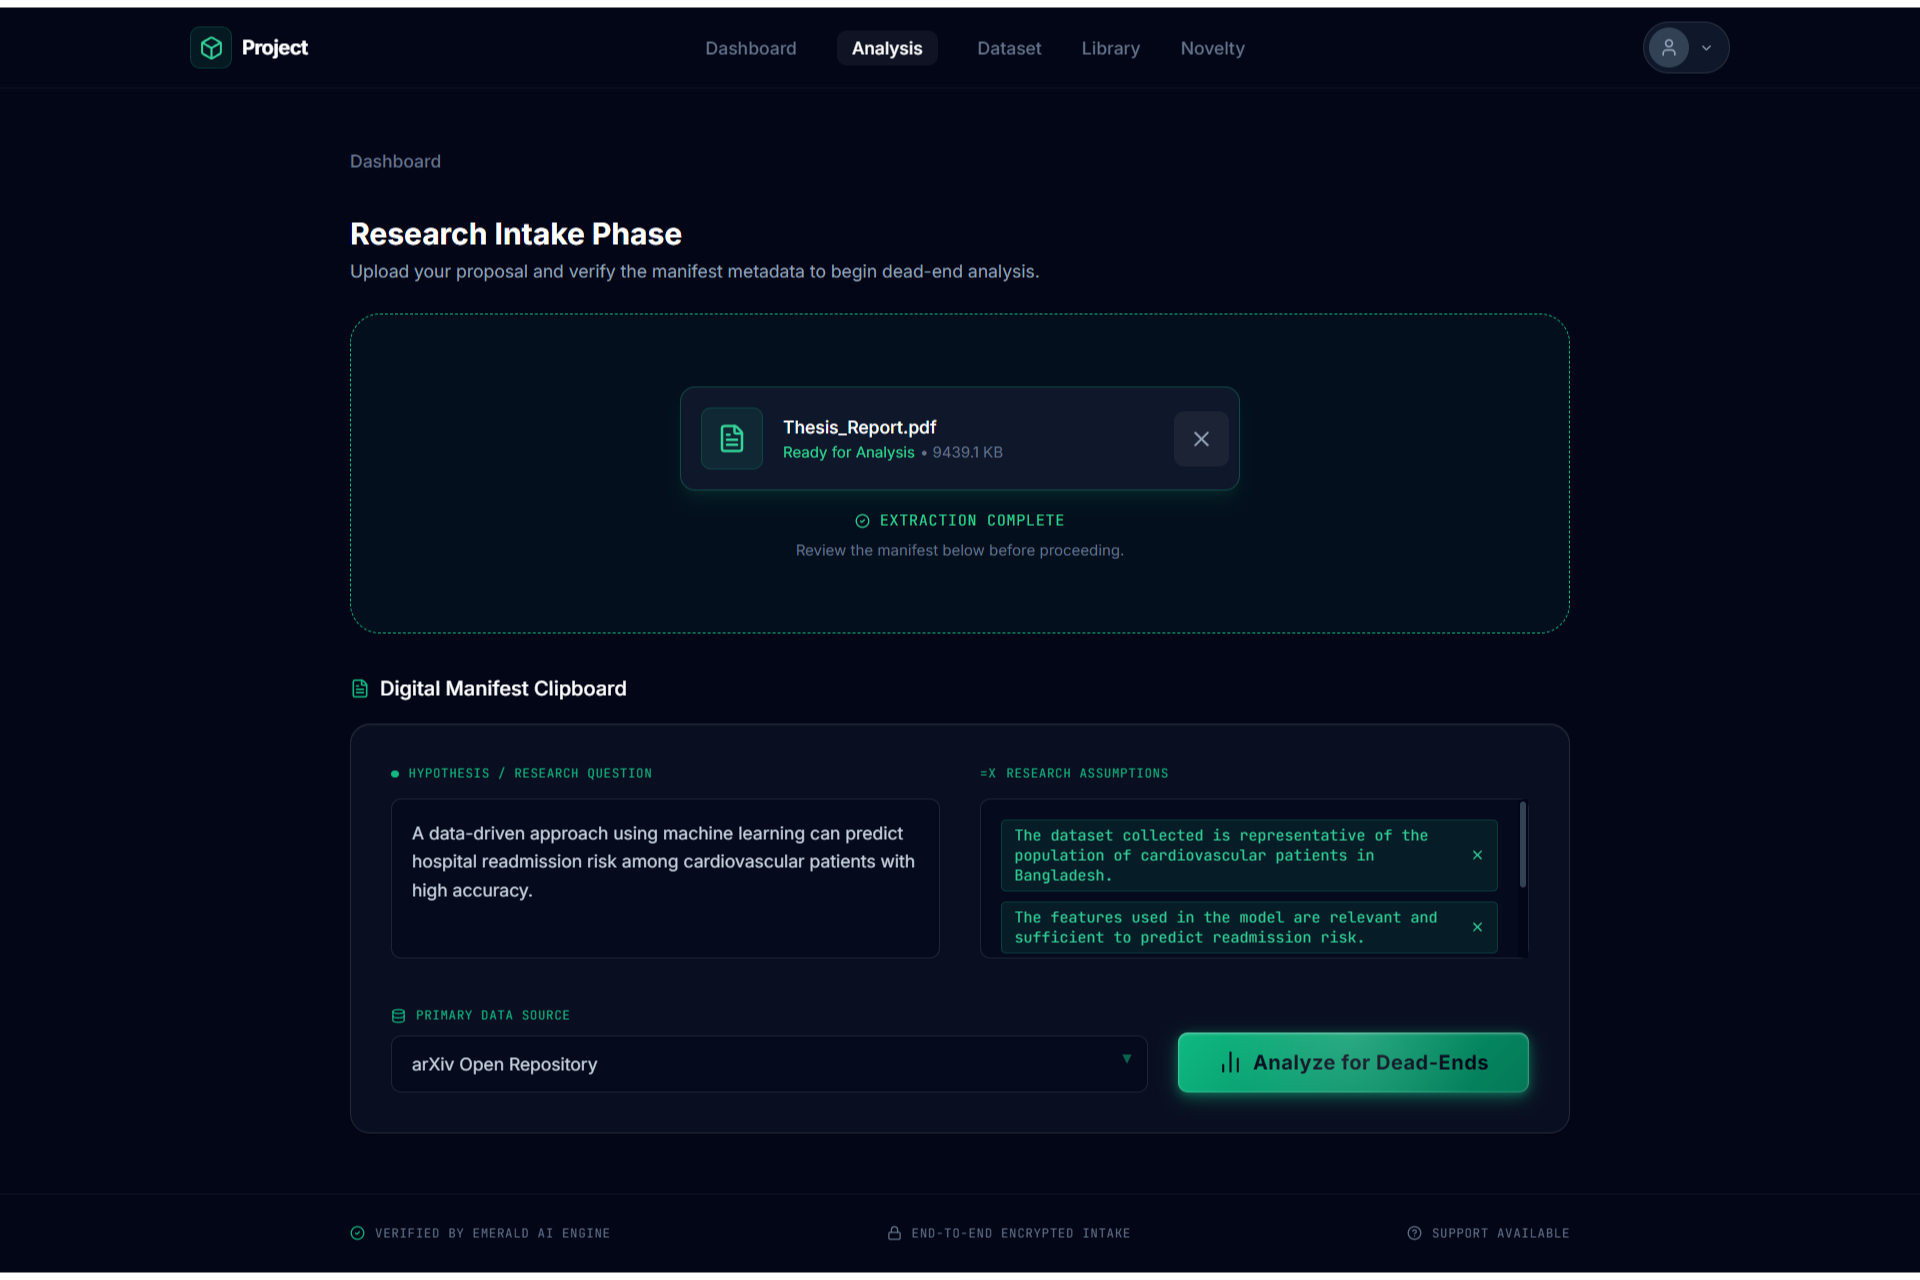

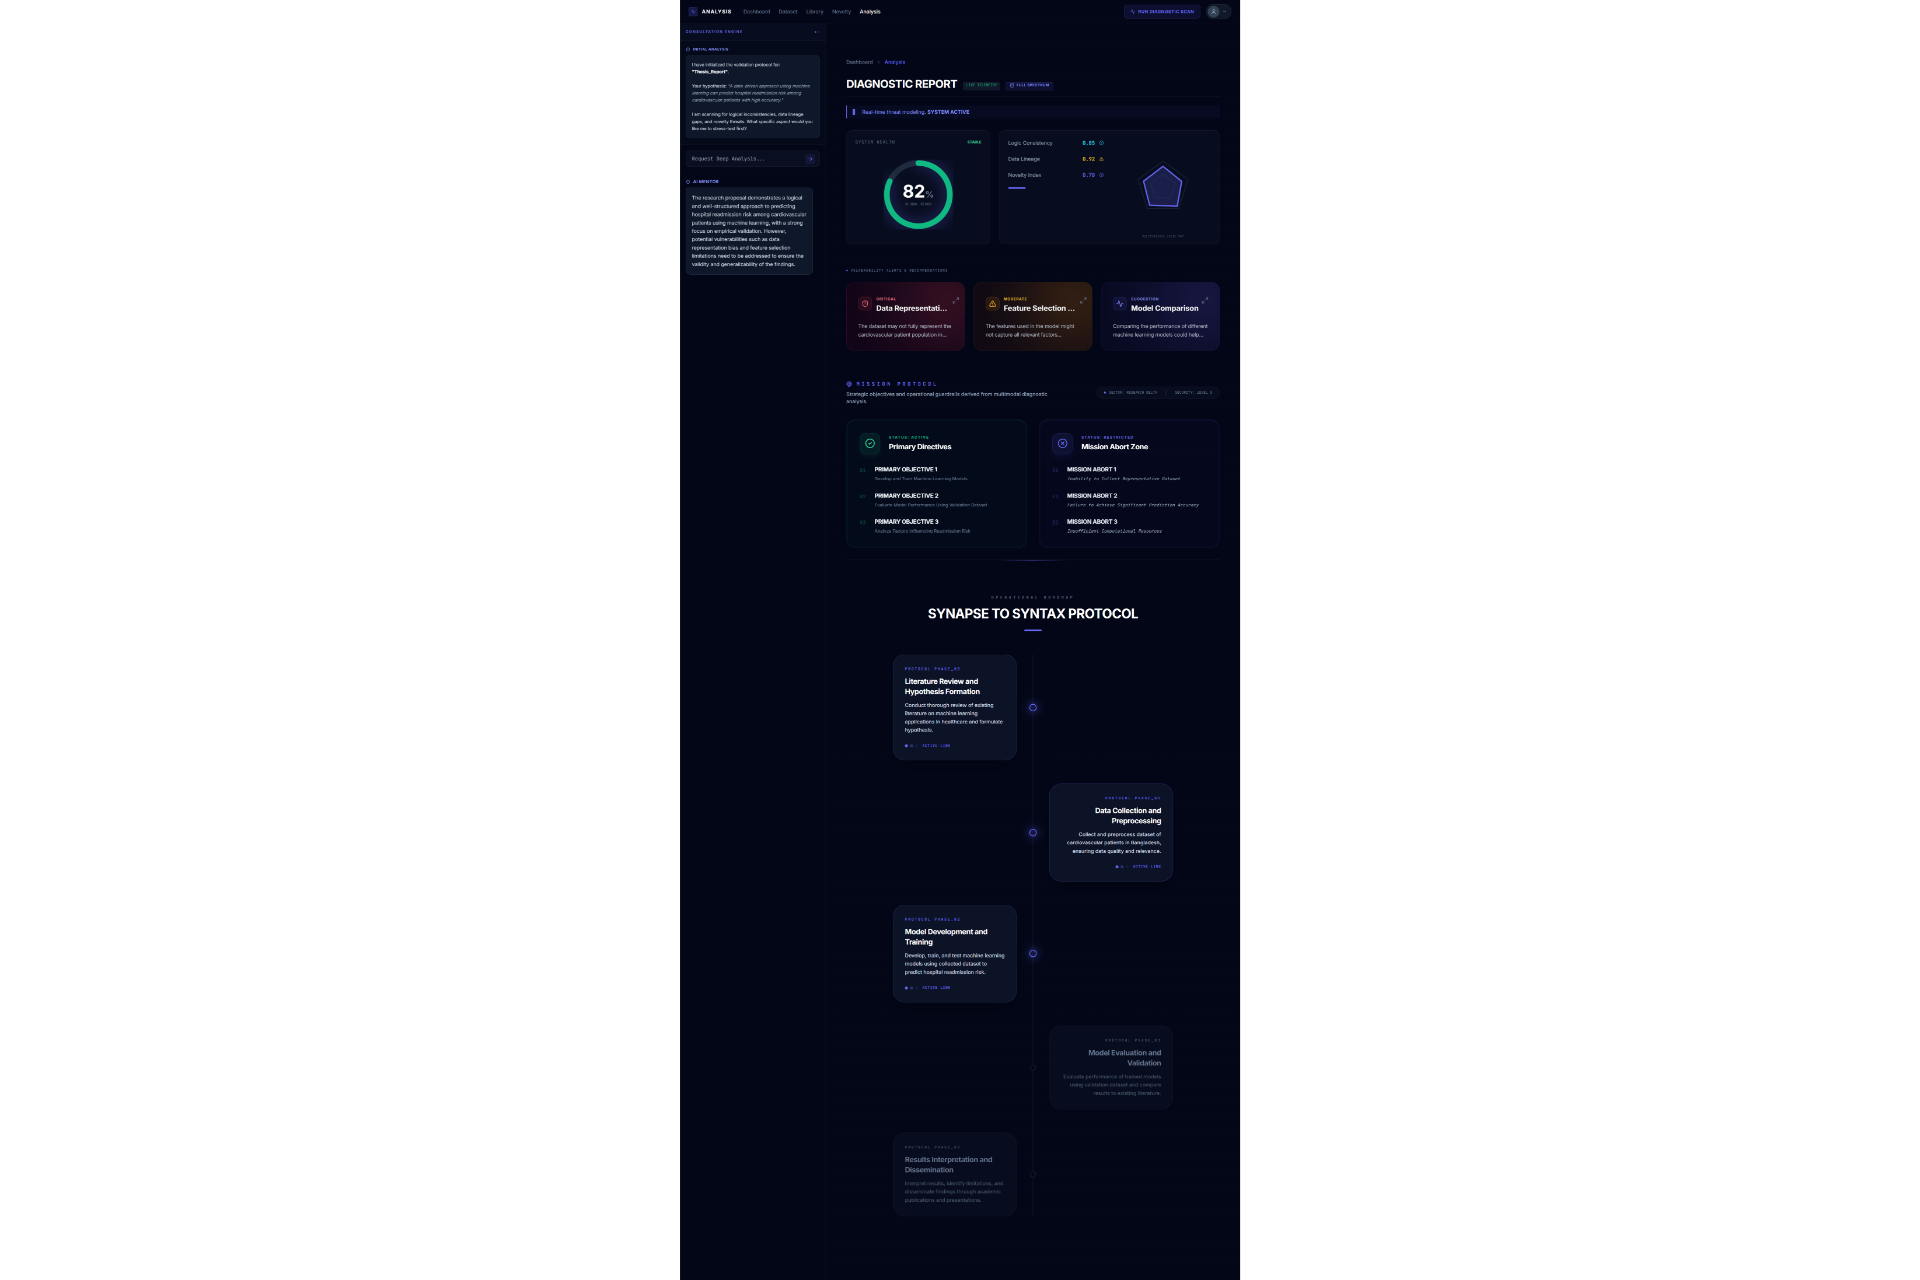


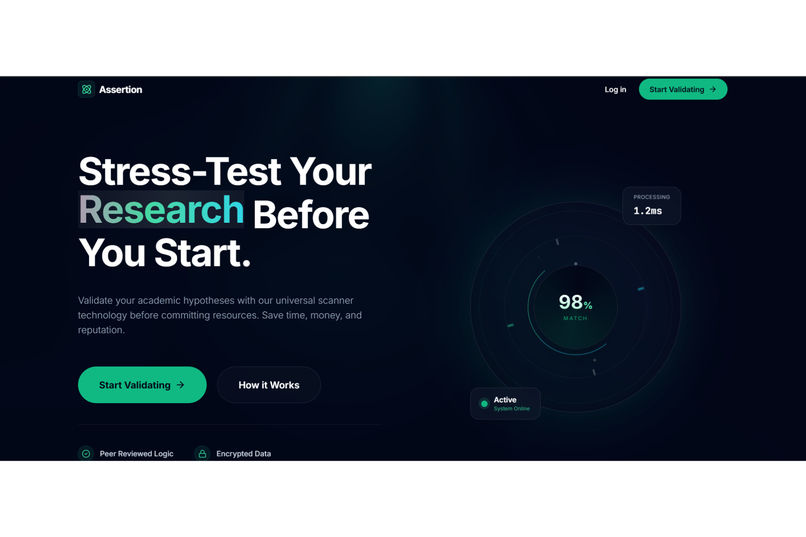
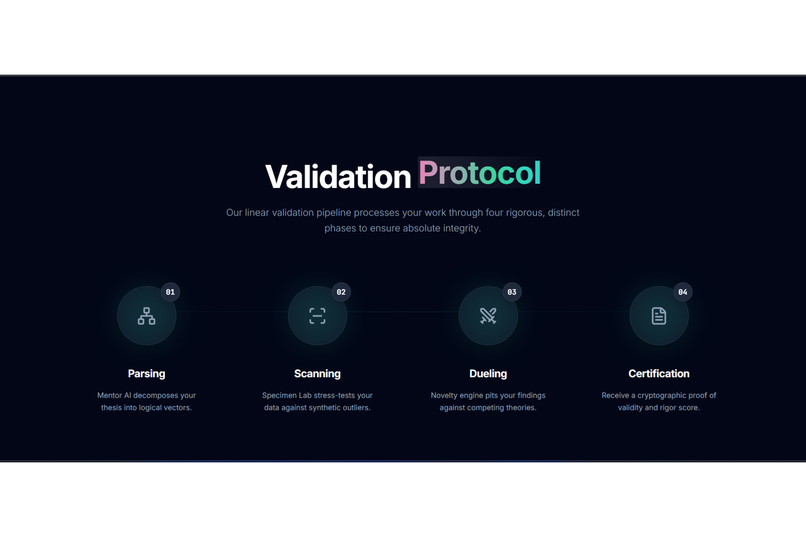
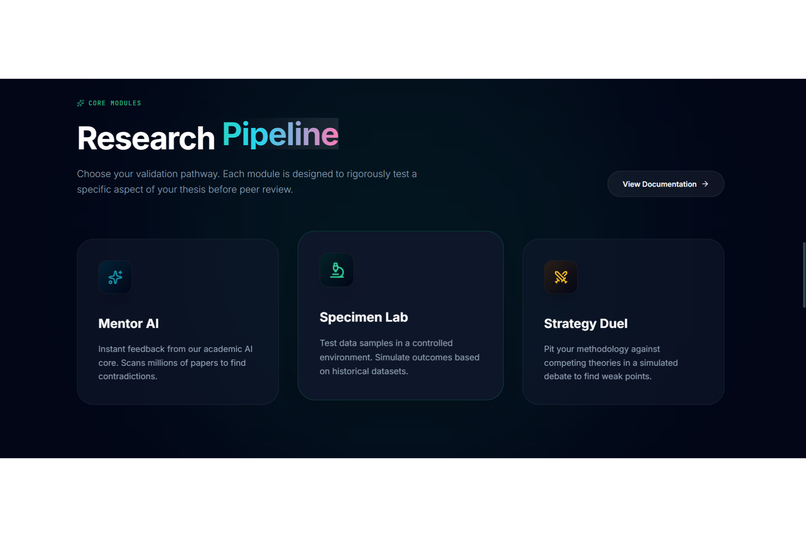
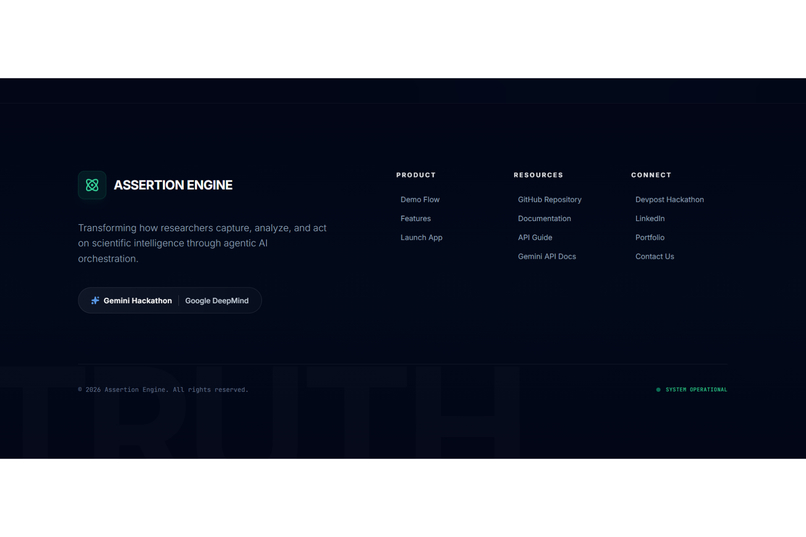
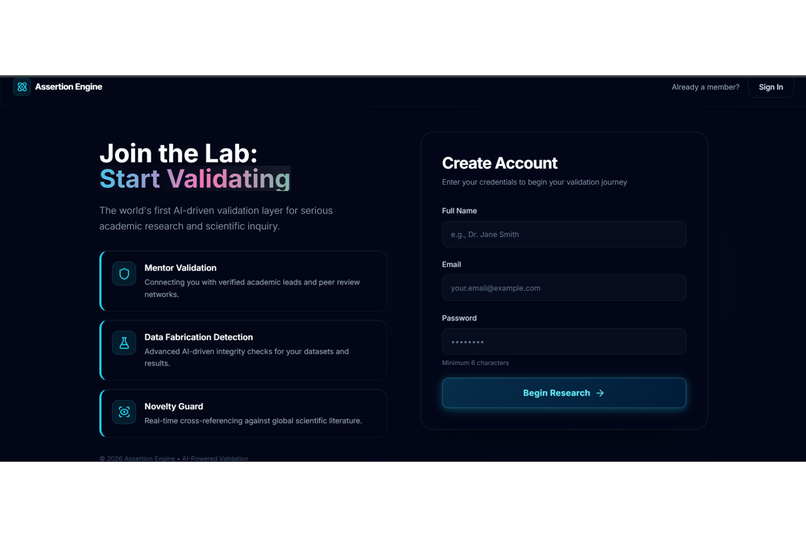
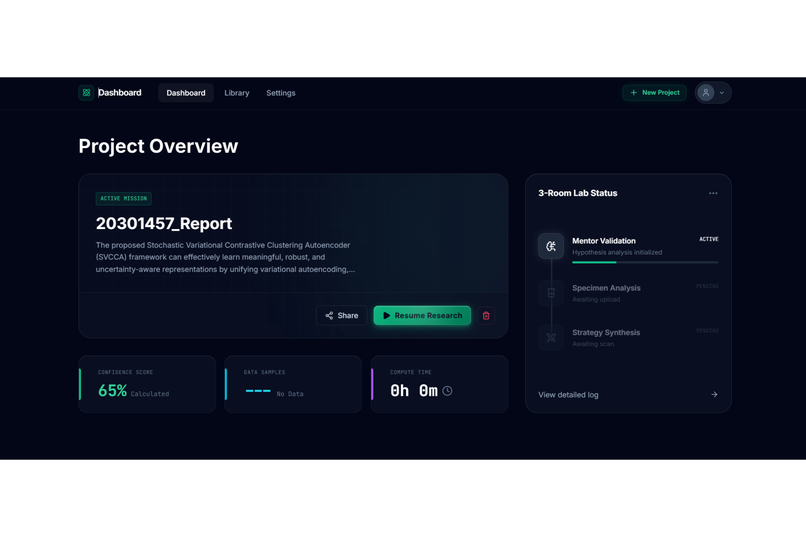
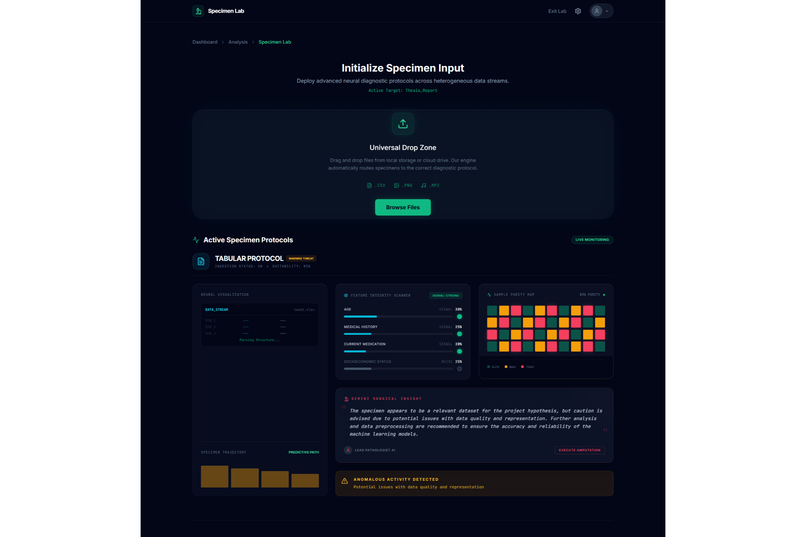
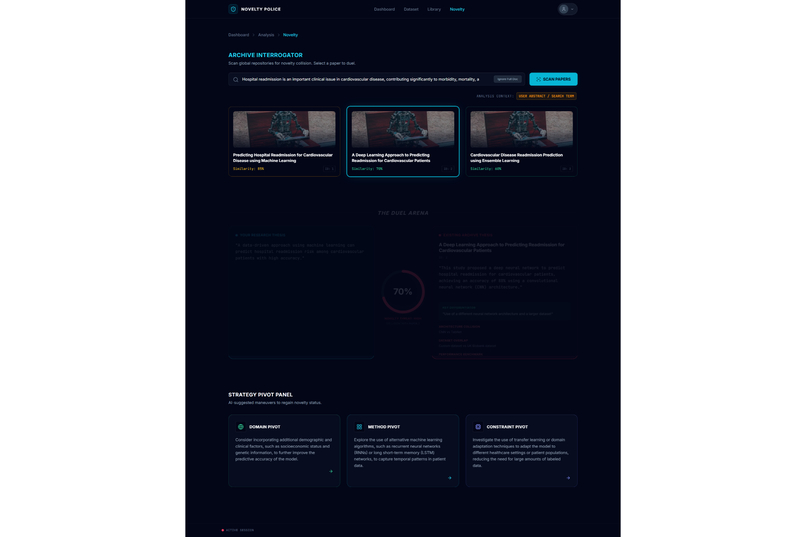
Academic research often feels like a high-stakes gamble where the cost of failure is time. Too often, a researcher spends five months deeply invested in a study, only to reach a breaking point where they realize the data doesn't support the hypothesis or the idea lacks originality. This "five months later" realization is devastating. We were inspired to eliminate this risk by creating a "pre-flight" diagnostic tool. We wanted to build the absolute first step for any researcher,a system that analyzes a proposal and dataset immediately to determine feasibility, ensuring that no one embarks on a doomed journey before they even begin. The Assertion Engine operates as a predictive feasibility scanner that users consult before committing to long-term work. A researcher uploads their initial proposal or lab reports, and the system assesses the probability of success. It answers the critical questions: what features in the dataset are vital, what should be added, and what is irrelevant noise that should be removed? Beyond just data quality, the system creates a safeguard against redundancy. It facilitates a direct comparison between the user's proposal and existing papers or even compares two specific papers against each other,to calculate a novelty score. This ensures the researcher knows exactly where they stand in the scientific landscape before writing a single chapter. We engineered the platform using React 19, TypeScript, and Vite to ensure a blazing-fast, type-safe experience. The aesthetic of a sterile/aesthetic of a sterile, high-tech diagnostic lab was brought to life using Framer Motion and Lenis for smooth, clinical animations, with Lucide React for precise iconography. For the backend and database, we utilized a robust Supabase (PostgreSQL + Auth) architecture. The core intelligence is powered by the Google Gemini 3 API (with multi-AI provider fallback), which executes our diagnostic protocols. To handle the lab report and dataset analysis, we programmed the system to compute a Purity Score (P_{score}), helping users identify the signal-to-noise ratio in their data:
P_{score} = \frac{\sum (S_{signal} - N_{noise})}{T_{total_rows}}
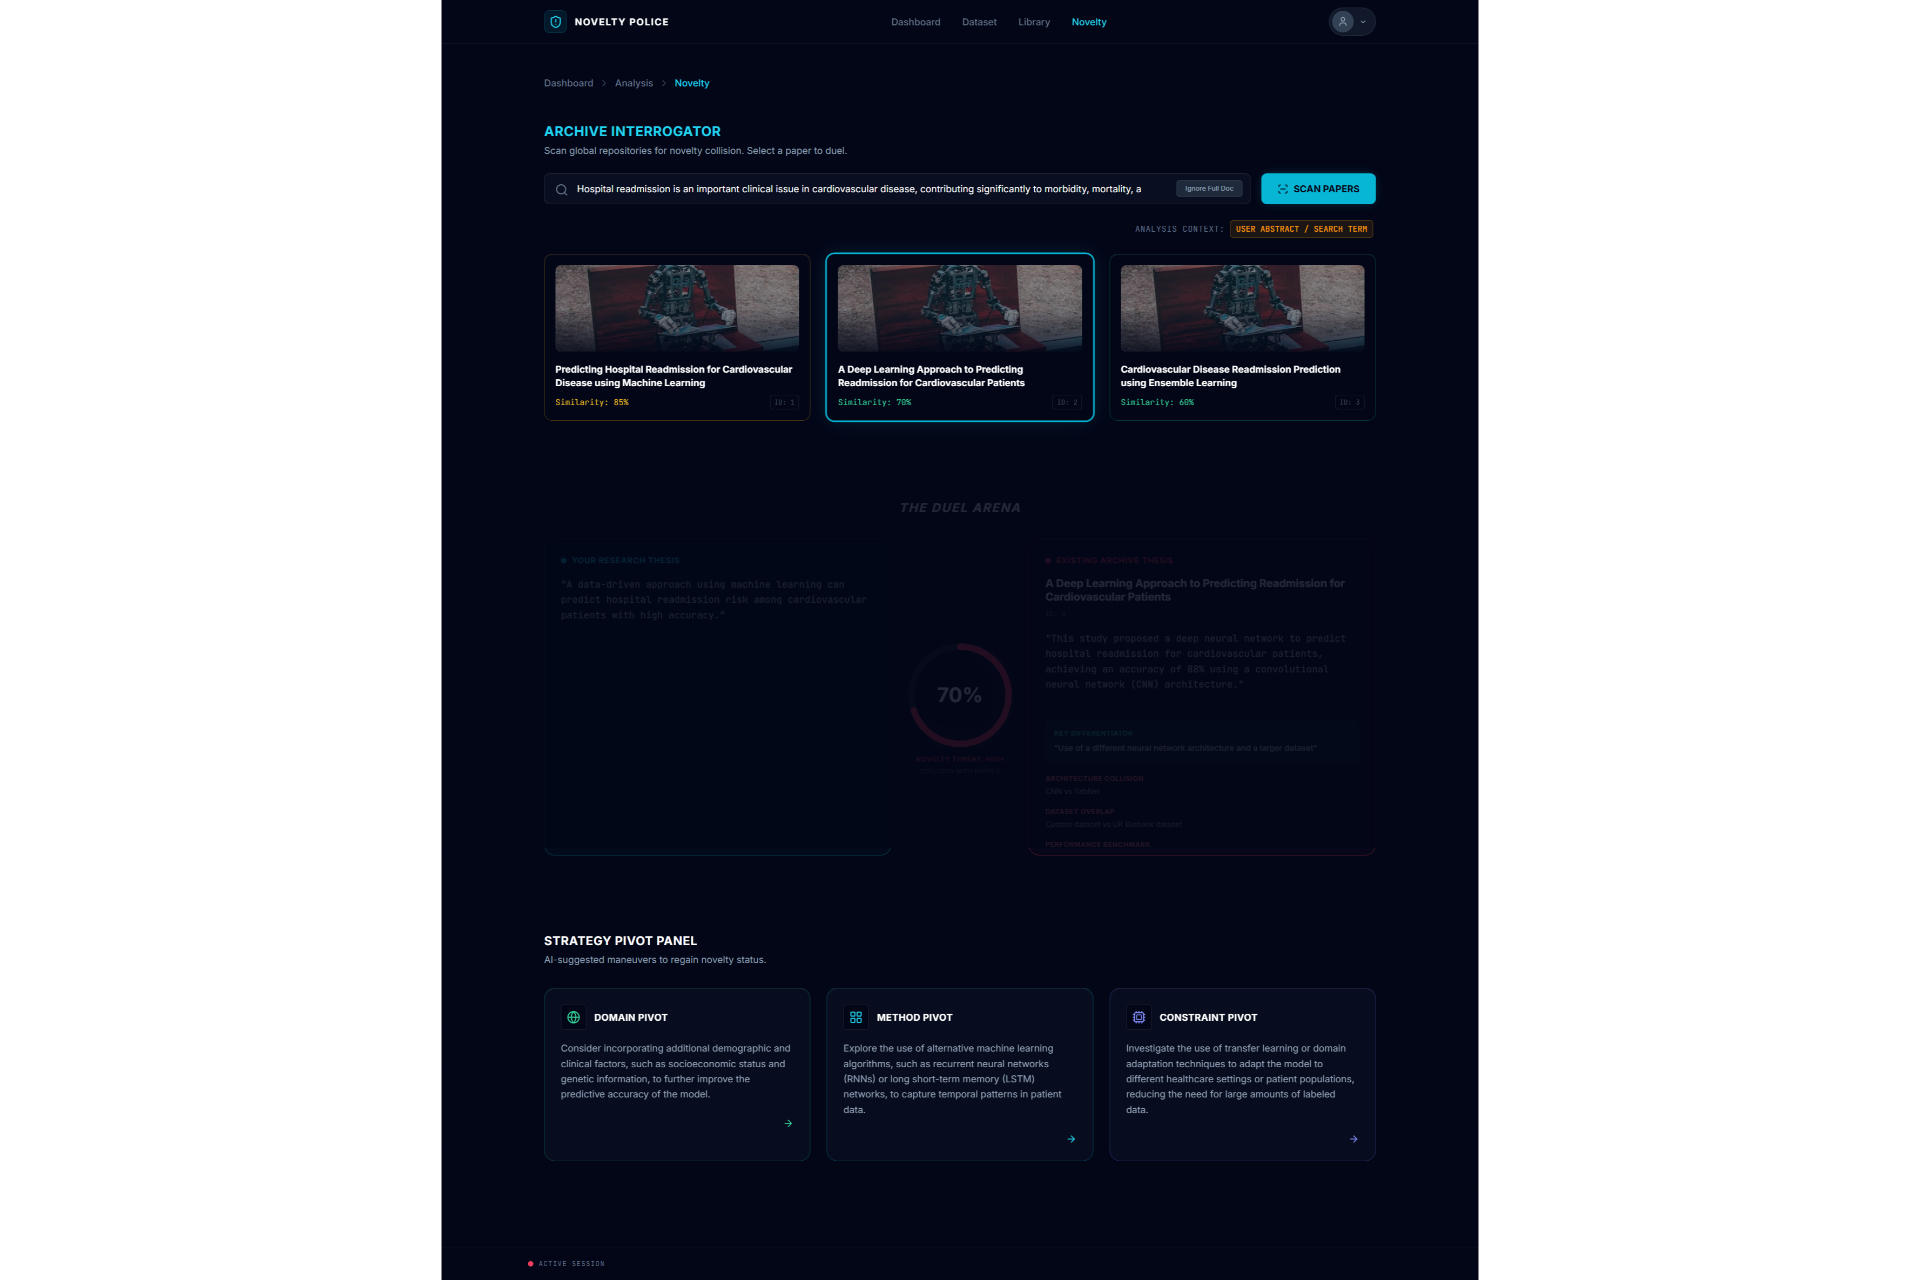
For the novelty and paper-to-paper comparison features, we implemented Vector Embeddings to map text into high-dimensional geometric space. By calculating the Cosine Similarity between the user's proposal vector (\vec{A}) and a target paper's vector (\vec{B}), we can mathematically quantify how original the idea is:
\text{similarity} = \cos(\theta) = \frac{\vec{A} \cdot \vec{B}}{|\vec{A}| |\vec{B}|} = \frac{\sum_{i=1}^{n} A_i B_i}{\sqrt{\sum_{i=1}^{n} A_i^2} \sqrt{\sum_{i=1}^{n} B_i^2}}
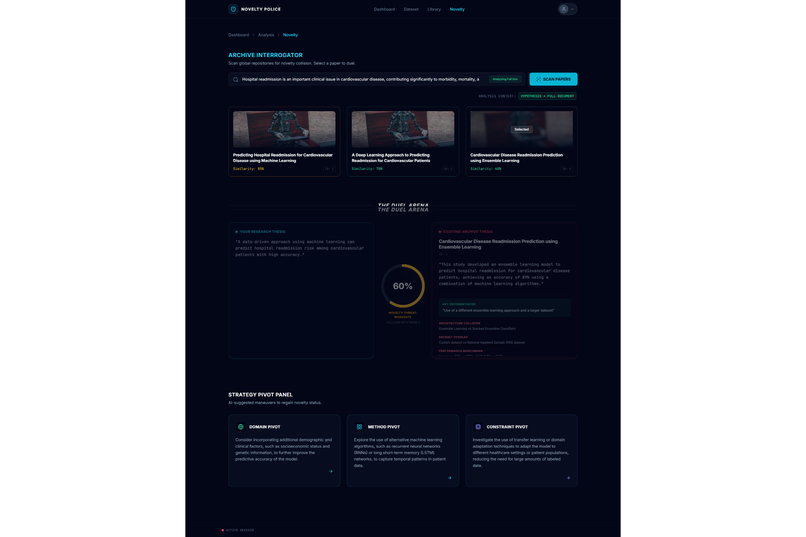
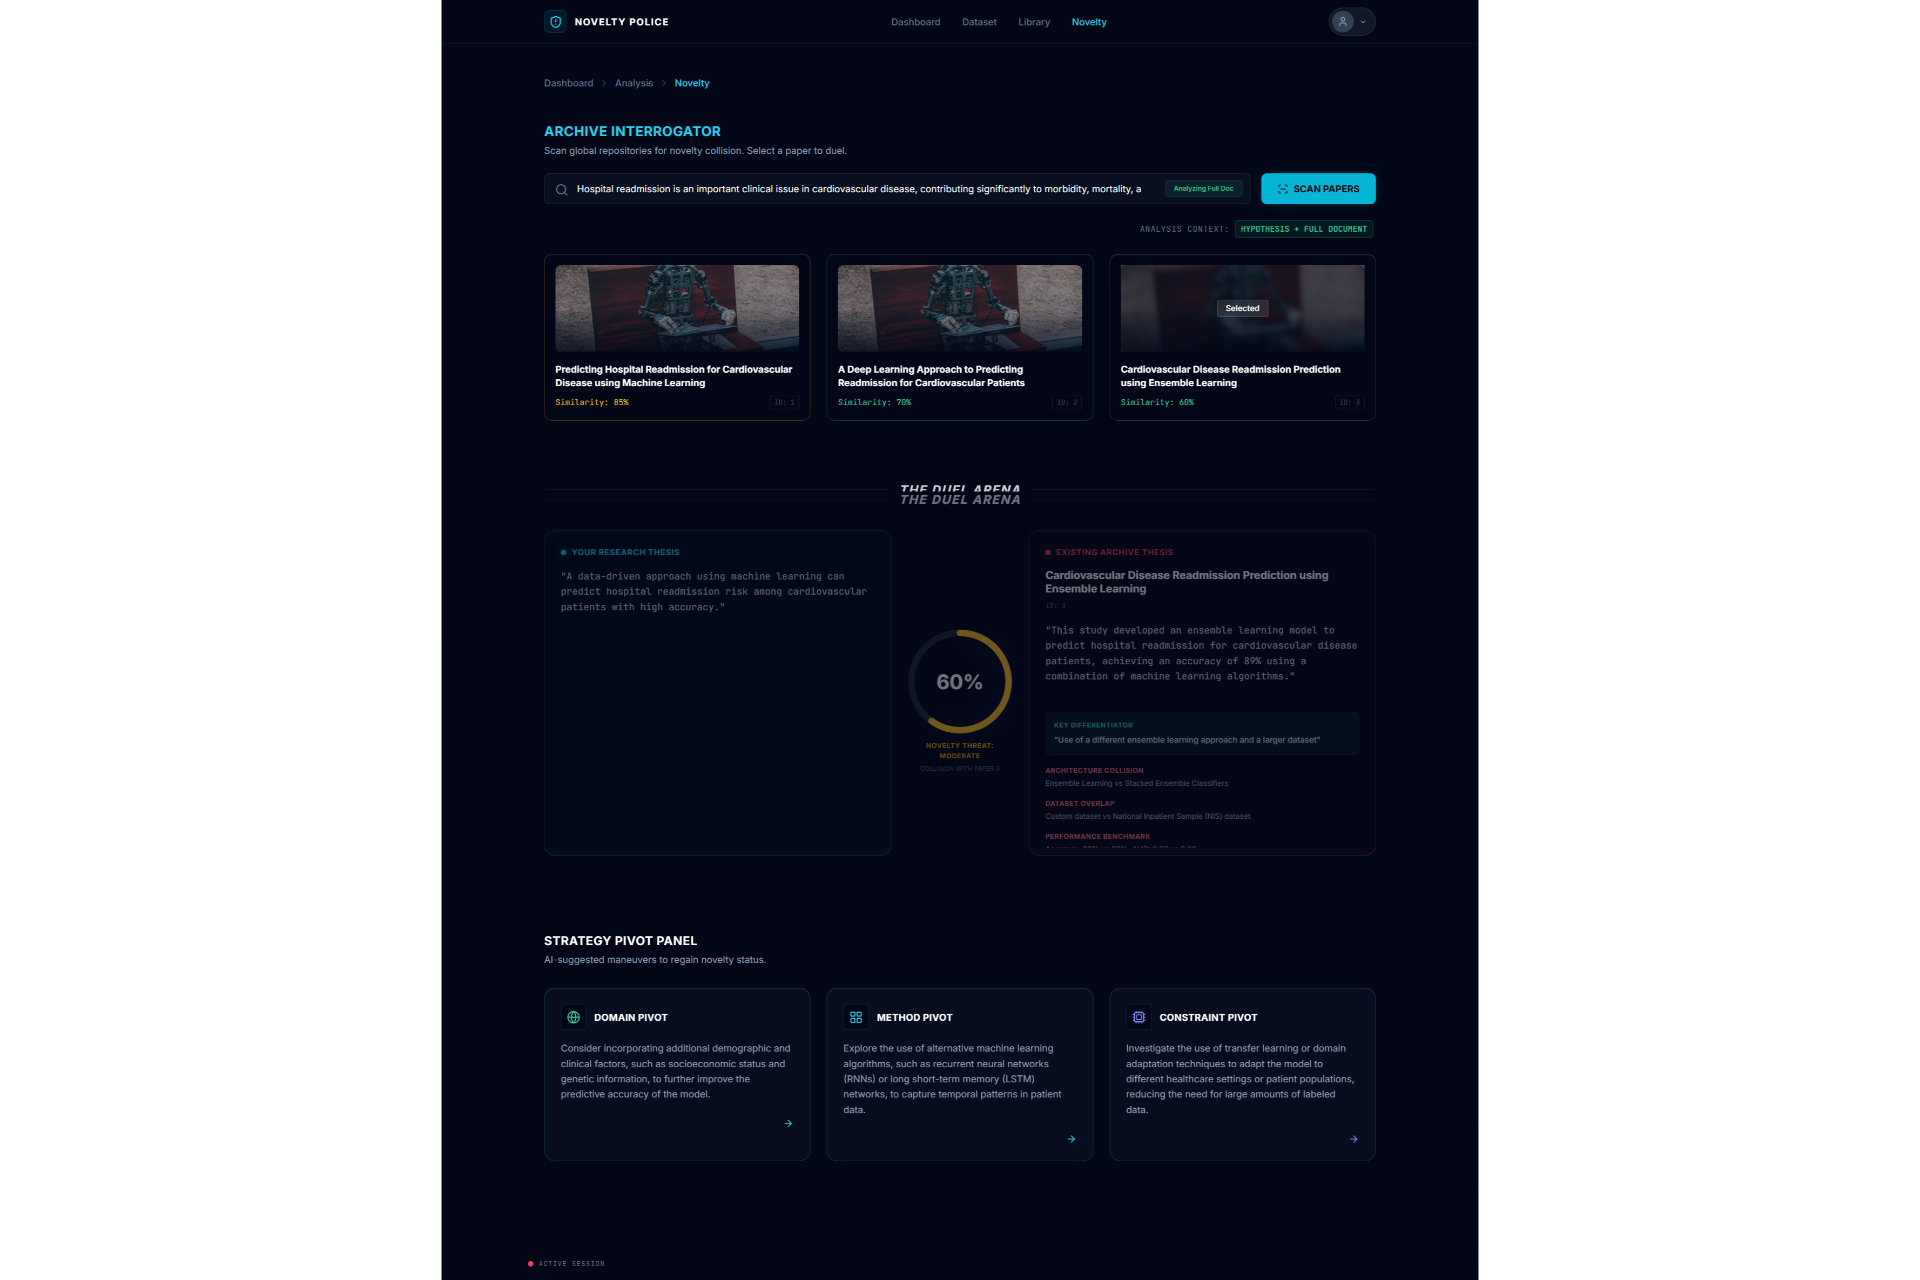
Our most significant challenge was defining the threshold for "useful" data versus "noise" in a way that applies generally across different research fields using the AI models. We had to calibrate the Gemini 3 prompts to distinguish between necessary outliers and actual data corruption. Additionally, visualizing the comparison between two papers required complex UX decisions to make the similarities and differences instantly understandable without overwhelming the user. Integrating the specific animation libraries like Framer Motion with the real-time data states from Supabase also tested our frontend architecture, requiring robust state management to keep the interface responsive.
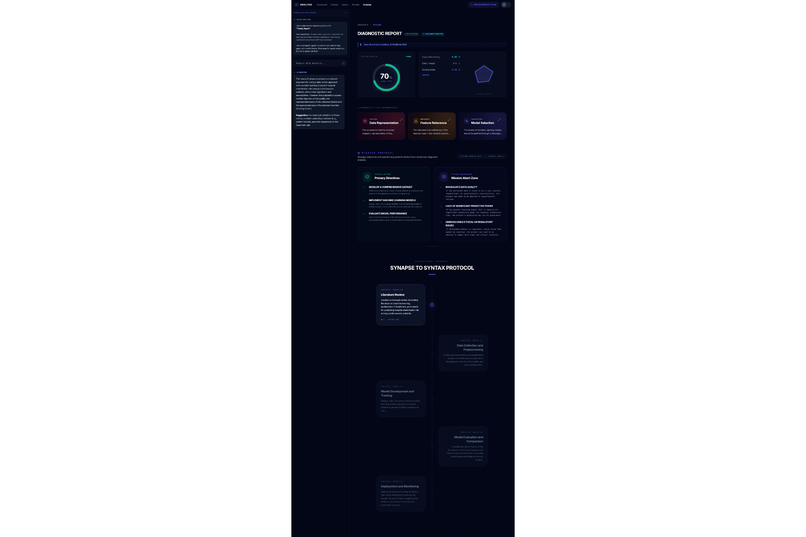
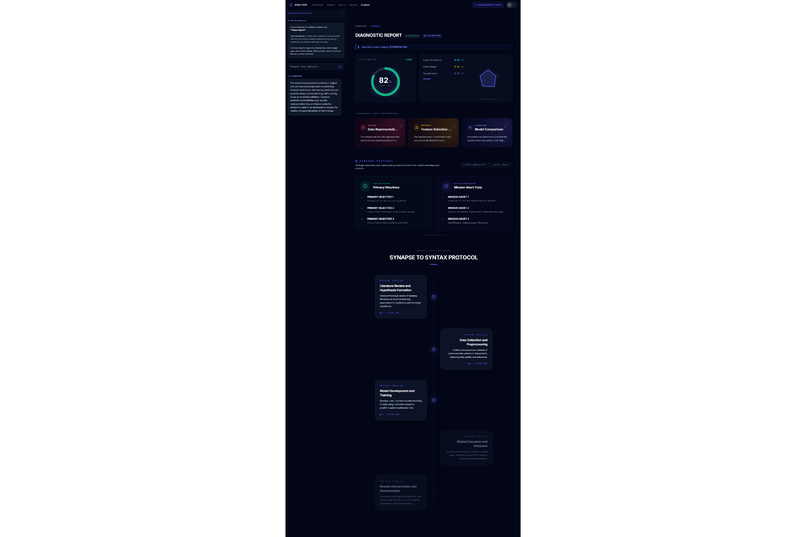
We are incredibly proud of the "Amputation" concept, which transforms the abstract advice of "clean your data" into a clear, surgical decision to remove toxic features that lower success probability. Furthermore, moving beyond simple plagiarism checks to a deep semantic comparison allows the tool to act as a mentor. Successfully integrating these diverse metrics data suitability, feature importance, and novelty into a single diagnostic view was a major design milestone.
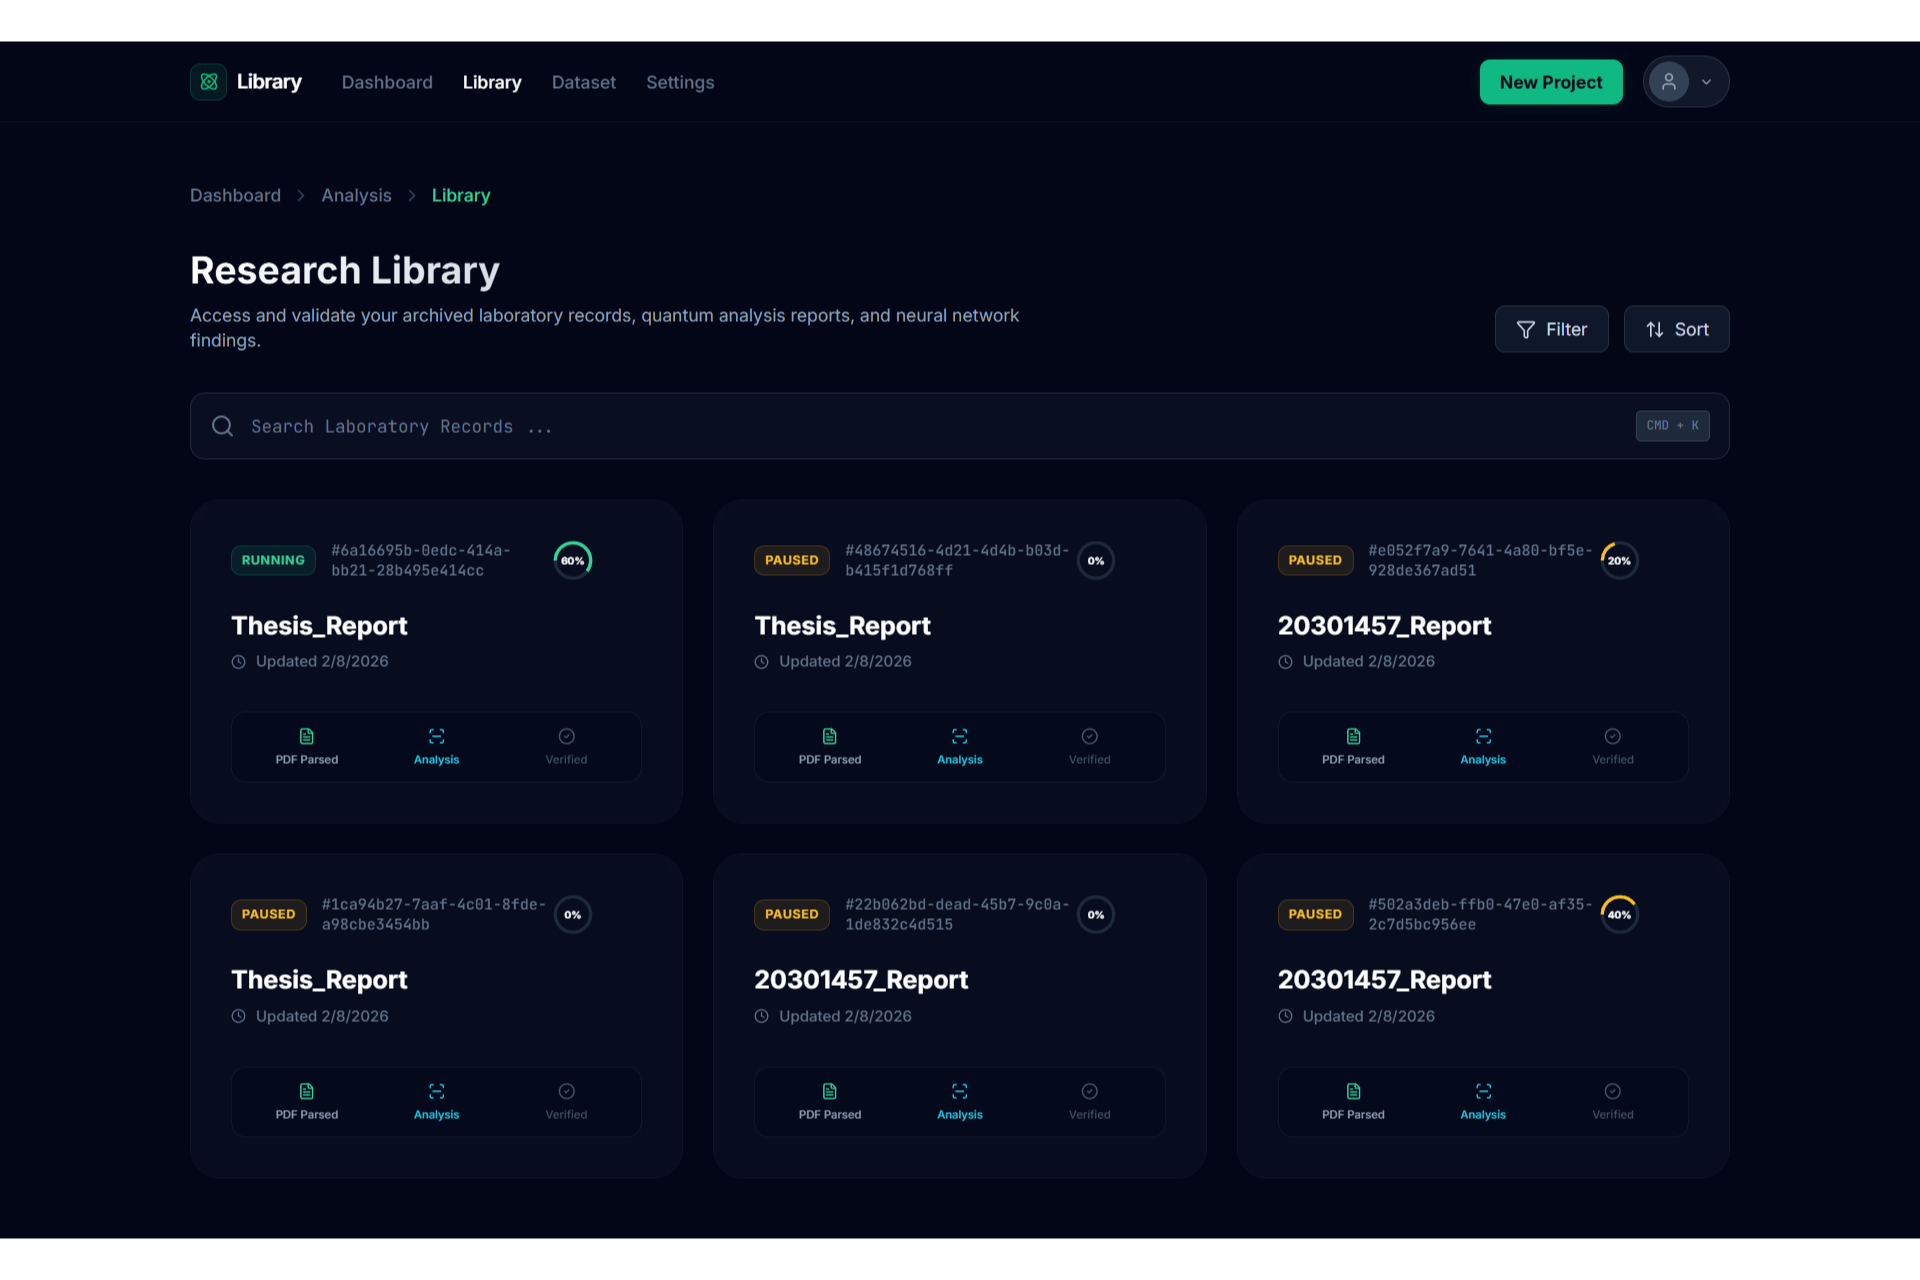
We learned that timing is everything. A diagnostic tool is most valuable at the very beginning of the lifecycle, not the end. We discovered that researchers need to know the "suitability" of their data for a specific hypothesis, not just its general quality. We also learned that users appreciate knowing what not to do just as much as knowing what to do, which influenced how we display risk factors in the final report.
Looking forward, we aim to automate the strategy execution, moving from simple suggestions to automatically generating experimental design boilerplates based on the successful parameters identified. We also plan to connect the system directly to live API streams for real-time data monitoring. Ultimately, we envision the Assertion Engine becoming the standard "Step Zero" for all academic research, ensuring that every project started is a project that can actually be finished
Built With
- googlegemini3api
- react
- supabase
- typescript
- vite


Log in or sign up for Devpost to join the conversation.