-
-
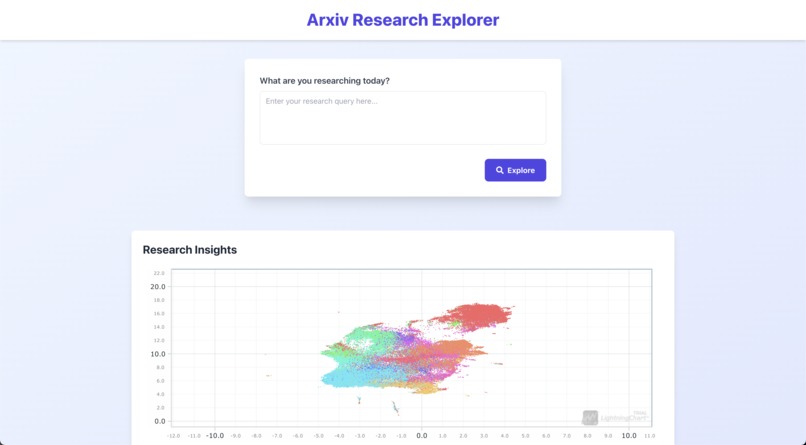
Landing Page
-
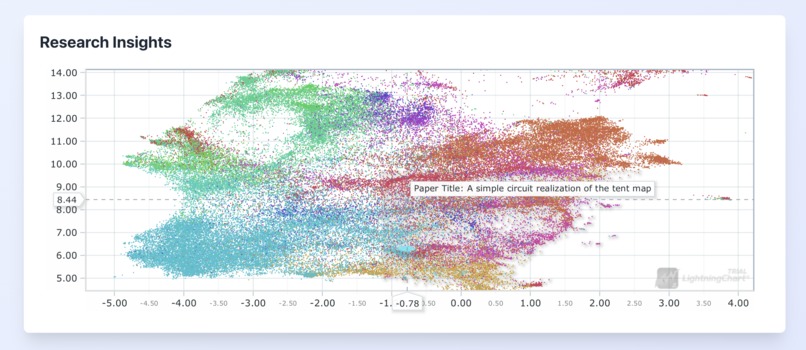
Main Research Grid
-
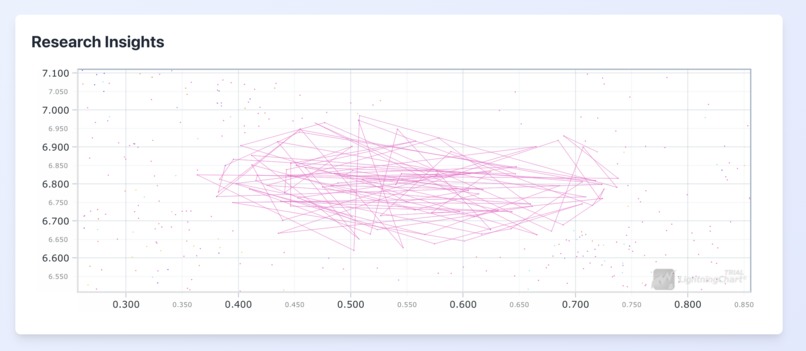
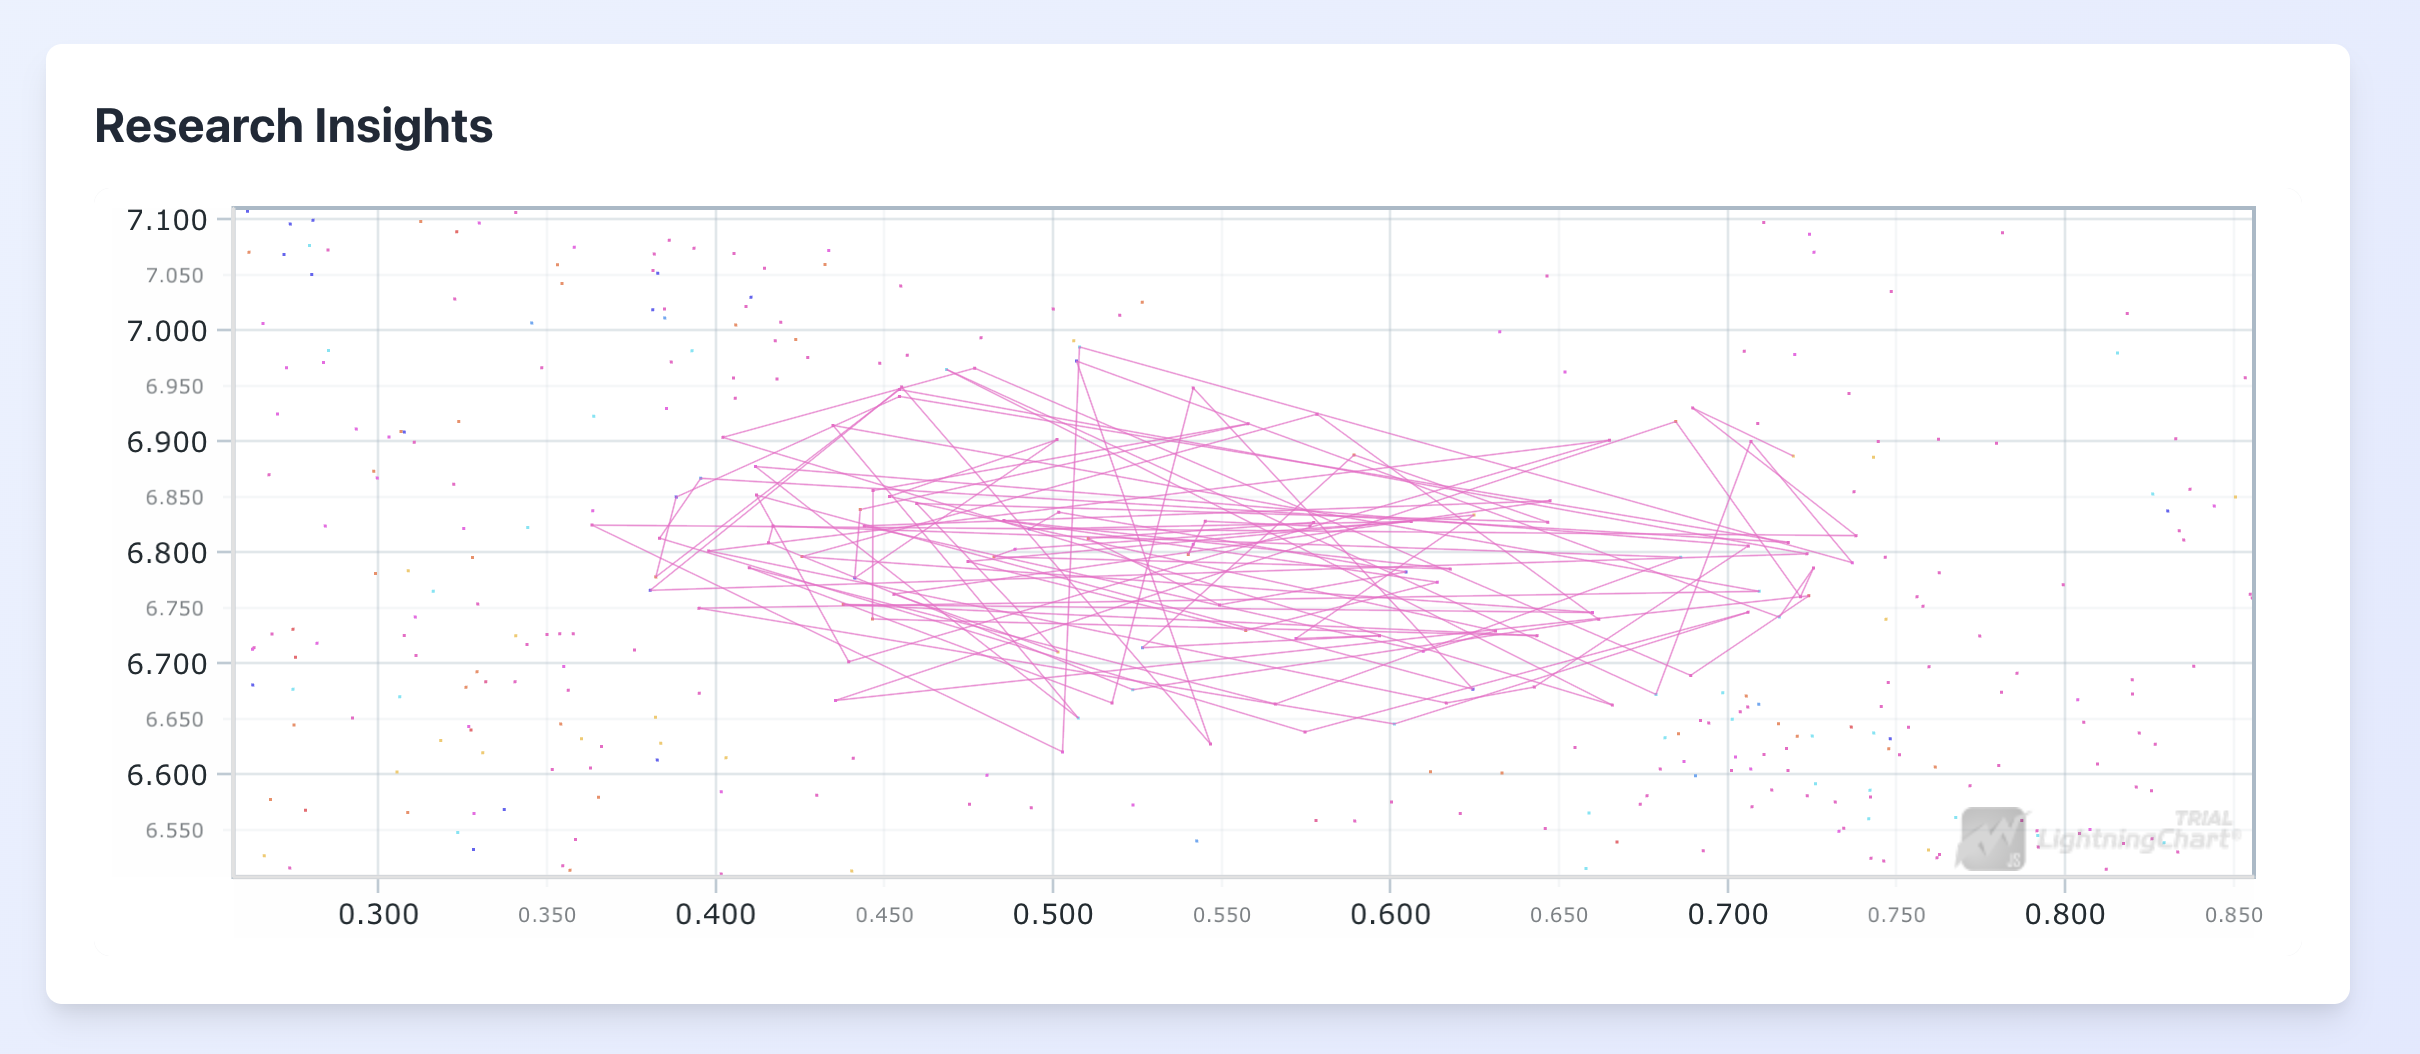
Search Feature


Arxiv Research Explorer
Inspiration
The Arxiv Research Explorer was inspired by the need to visualize and navigate the vast landscape of scientific research papers available on arXiv. With thousands of papers published across various fields, researchers often struggle to find relevant work or discover unexpected connections between different areas of study. This project aims to make the exploration of scientific literature more intuitive and visually engaging.
What it does
The Arxiv Research Explorer is a web-based application that:
- Visualizes arXiv papers as an interactive scatter plot, where each point represents a paper.
- Uses machine learning techniques to embed paper abstracts into a 2D space, allowing for meaningful proximity between related papers.
- Color-codes papers based on their scientific categories (e.g., Astrophysics, Computer Science, Mathematics).
- Allows users to explore papers by panning and zooming the chart.
- Provides detailed information about papers when hovering over data points.
- Enables users to open the original arXiv page of a paper by double-clicking on its data point.
- Highlights clusters of papers in similar research areas.
- Offers a search functionality that visualizes where a user's query fits within the research landscape.
How we built it
The Arxiv Research Explorer was built using a combination of technologies:
- Backend:
- Python with Flask for the API server
- MongoDB for storing paper data and embeddings
- PyTorch for machine learning models (ALBERT for text embedding, custom MLP for dimensionality reduction)
- Frontend:
- Node.js with Express for serving the web application
- EJS for server-side rendering
- LightningChart JS for creating the interactive scatter plot
- Data Processing:
- Pandas for data manipulation
- Scikit-learn for clustering (KMeans)
The process involved:
- Collecting and preprocessing arXiv paper data
- Generating embeddings for paper abstracts using a pre-trained ALBERT model
- Reducing the high-dimensional embeddings to 2D using a custom MLP model
- Storing the processed data in MongoDB
- Creating a Flask API to serve the data and handle search queries
- Developing a Node.js/Express web server to host the frontend
- Implementing the interactive visualization using LightningChart JS
Challenges we ran into
- Handling large datasets efficiently, especially when generating embeddings and performing dimensionality reduction
- Optimizing the performance of the interactive chart with thousands of data points
- Implementing an effective search functionality that integrates with the visualization
- Balancing between detailed information display and maintaining a clean, intuitive user interface
- Ensuring proper integration between the Python backend (Flask) and Node.js frontend
Accomplishments that we're proud of
- Successfully visualizing a large number of research papers in an interactive, intuitive interface
- Implementing a machine learning pipeline that effectively embeds and clusters research papers
- Creating a seamless user experience that allows for easy exploration of the research landscape
- Developing a search functionality that visually places user queries within the context of existing research
- Integrating multiple technologies (Python, Node.js, MongoDB, LightningChart JS) into a cohesive application
What we learned
- Techniques for processing and visualizing large datasets
- Advanced use of machine learning models for text embedding and dimensionality reduction
- Integration of Python-based machine learning workflows with web technologies
- Effective use of data visualization libraries for creating interactive, data-rich interfaces
- Strategies for optimizing web application performance with large amounts of data
What's next for Arxiv Research Explorer
- Implement more advanced search and filtering options
- Add time-based visualization to show the evolution of research topics
- Introduce collaborative features, allowing users to create and share custom collections or annotations
- Improve the embedding and clustering algorithms for even more accurate representations
- Expand the dataset to include papers from other sources beyond arXiv
- Develop a recommendation system based on user interactions and paper similarities
- Create mobile-friendly versions of the application for on-the-go research exploration


Log in or sign up for Devpost to join the conversation.