-
-
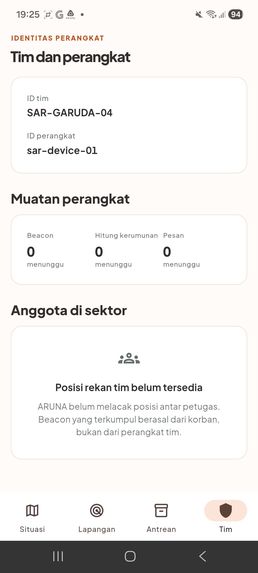
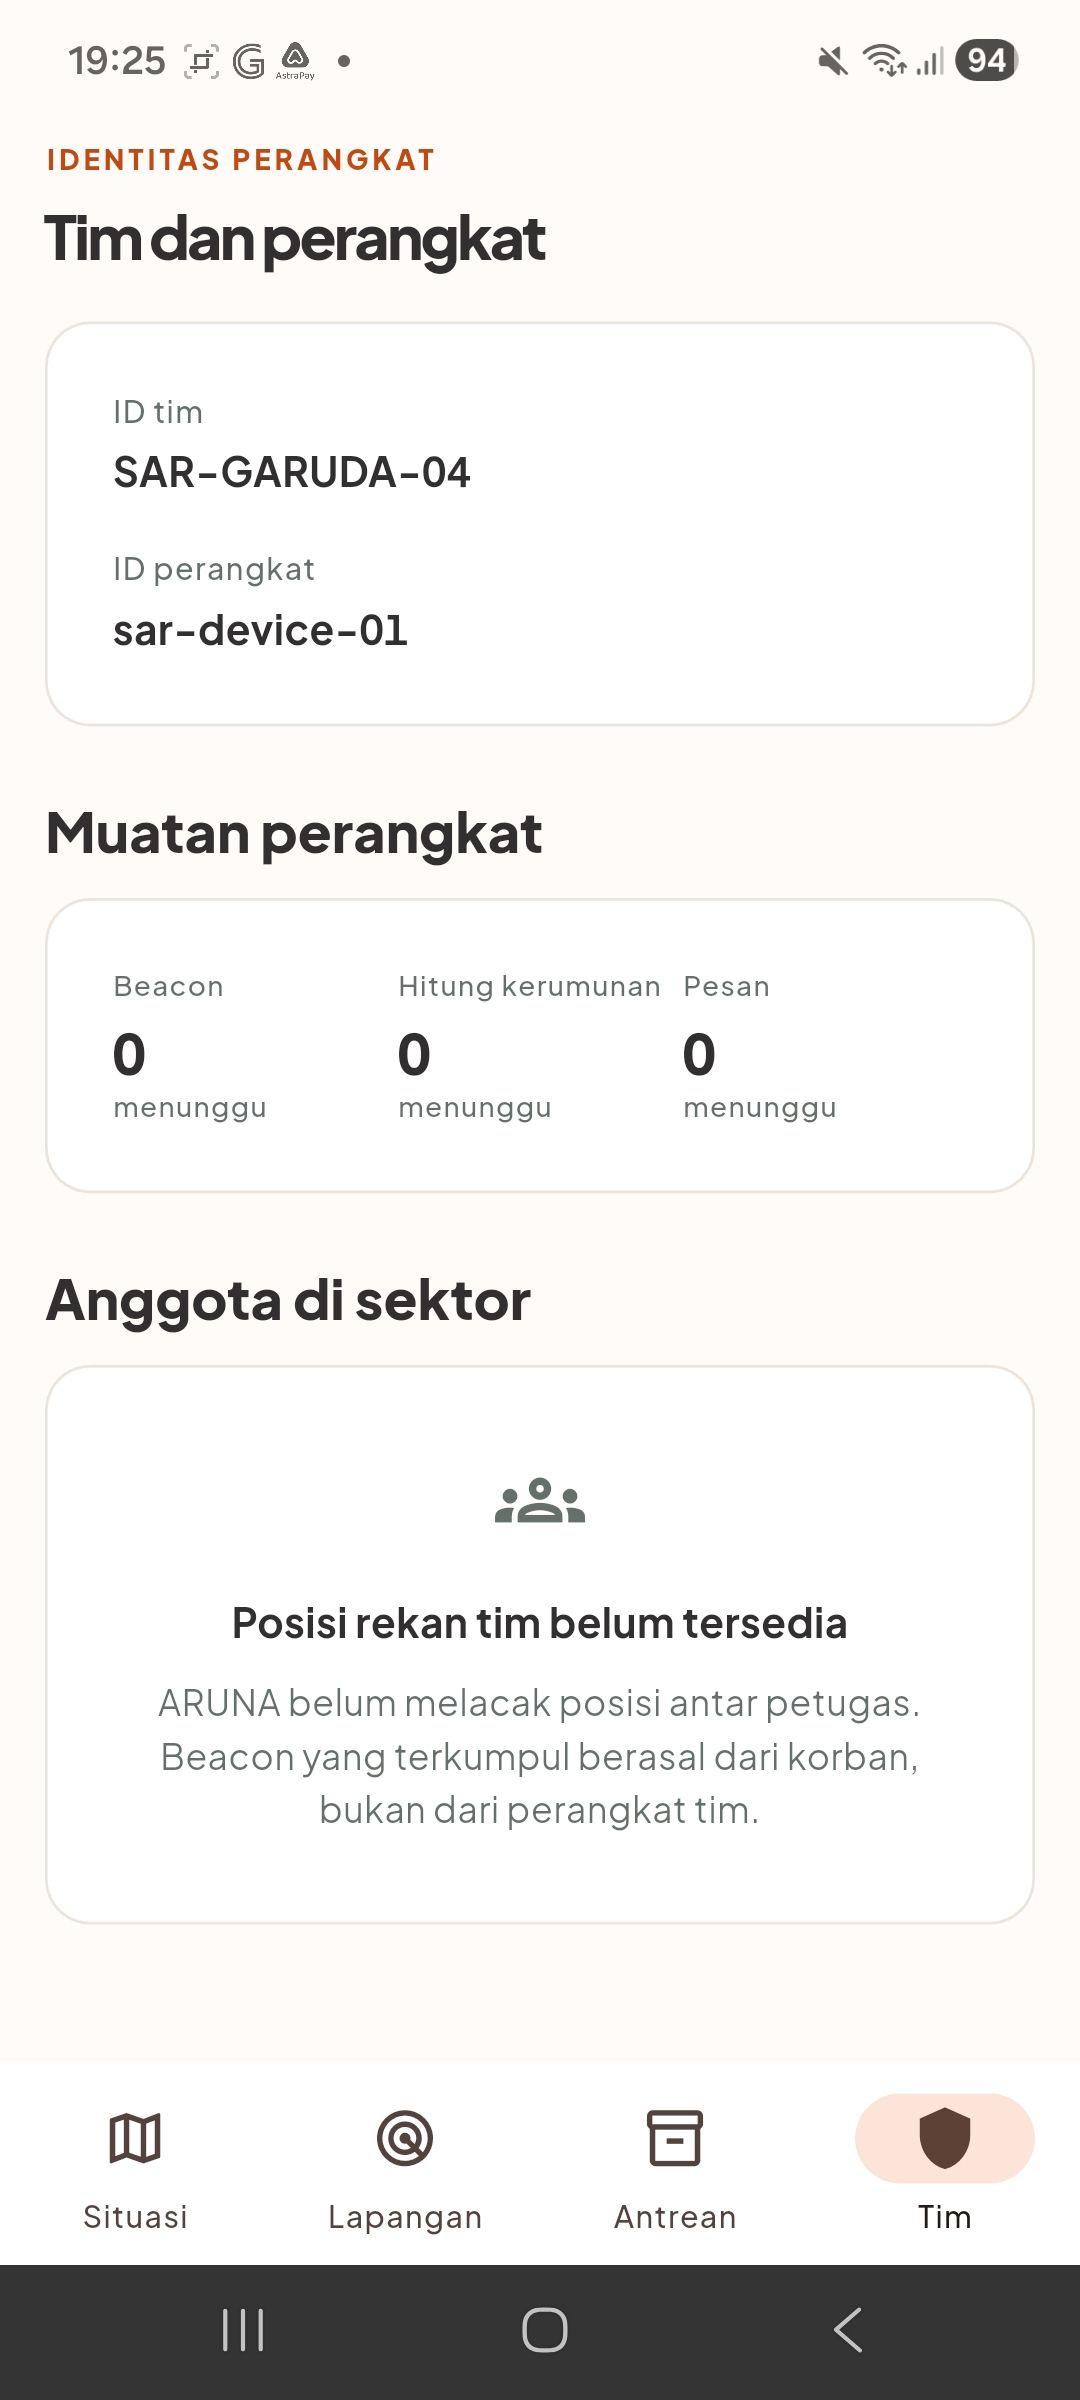
Team SAR Page (for SAR role)
-
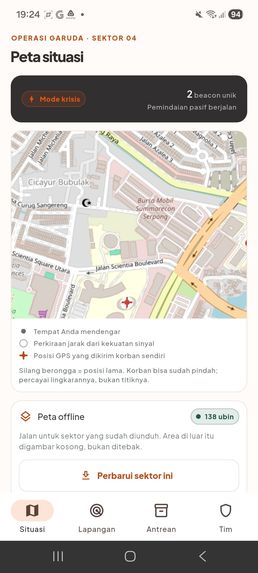
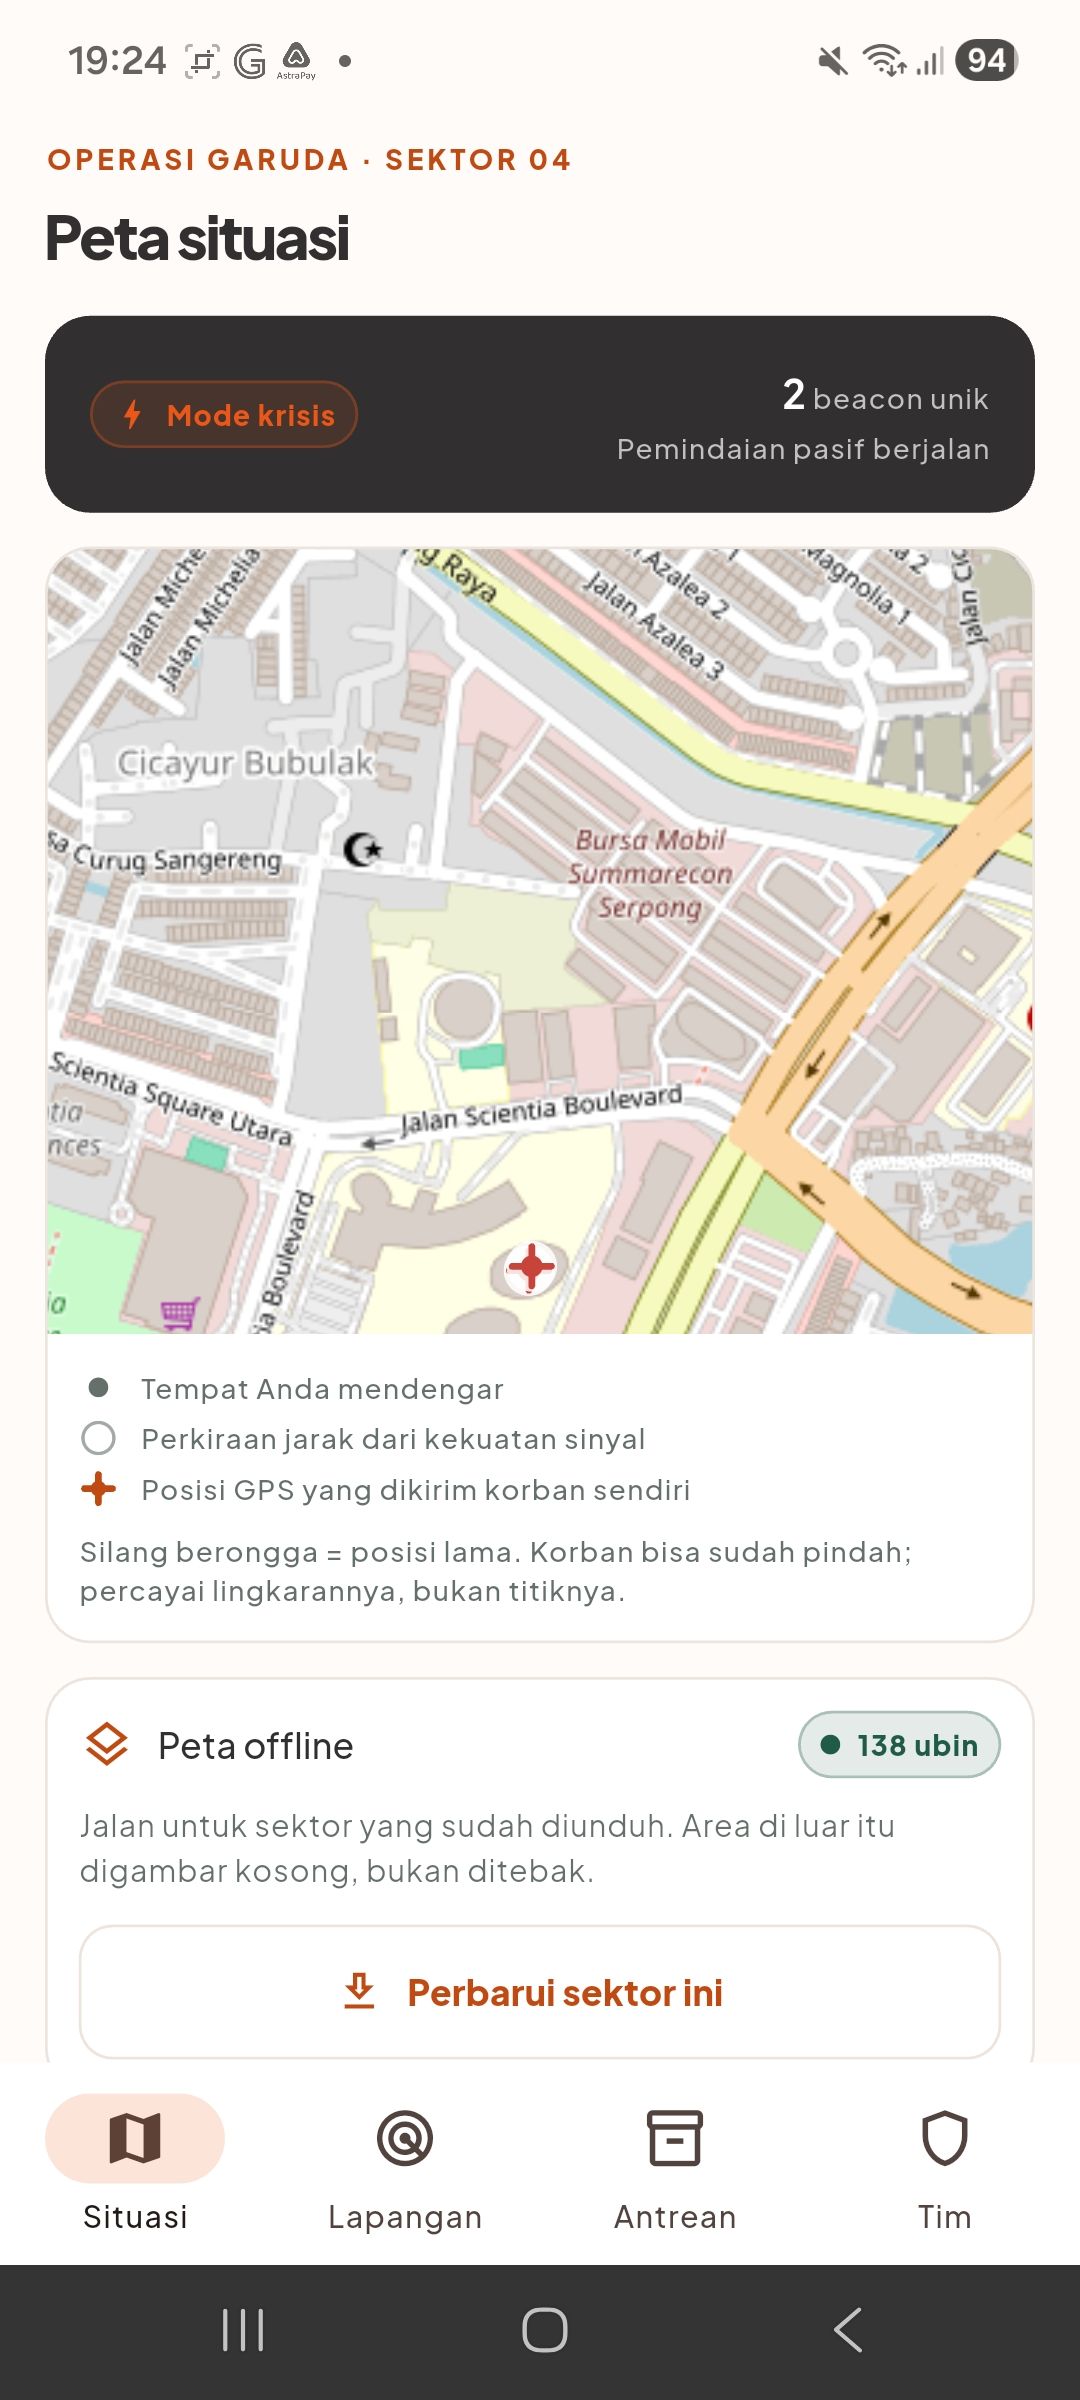
Situation Page (for SAR role)
-
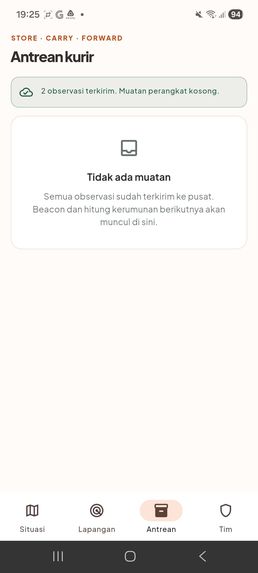
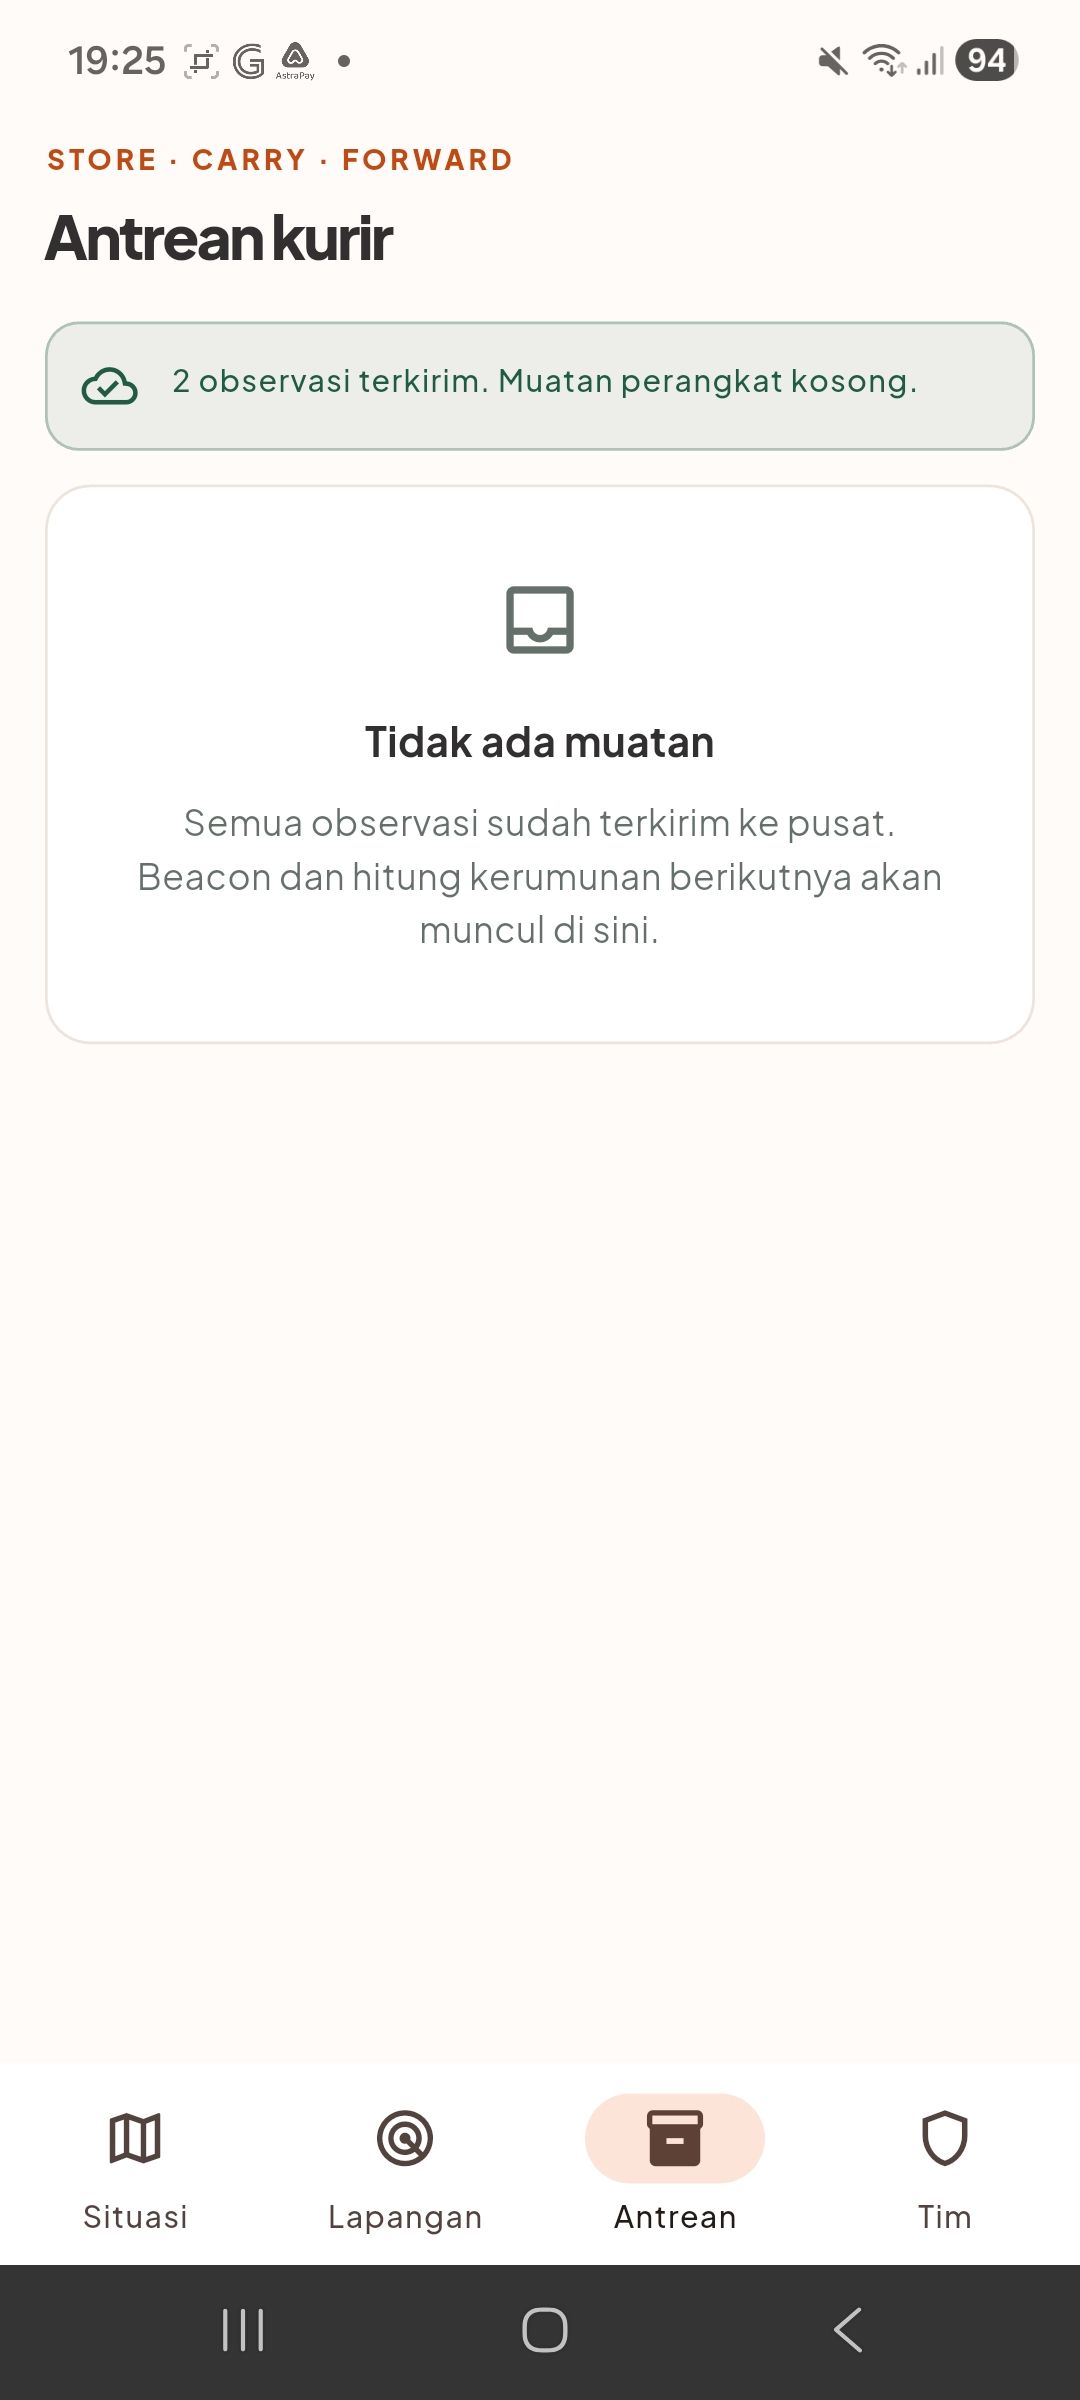
Queue Message Page (for SAR role)
-
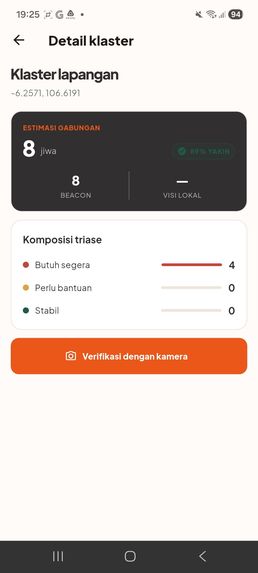
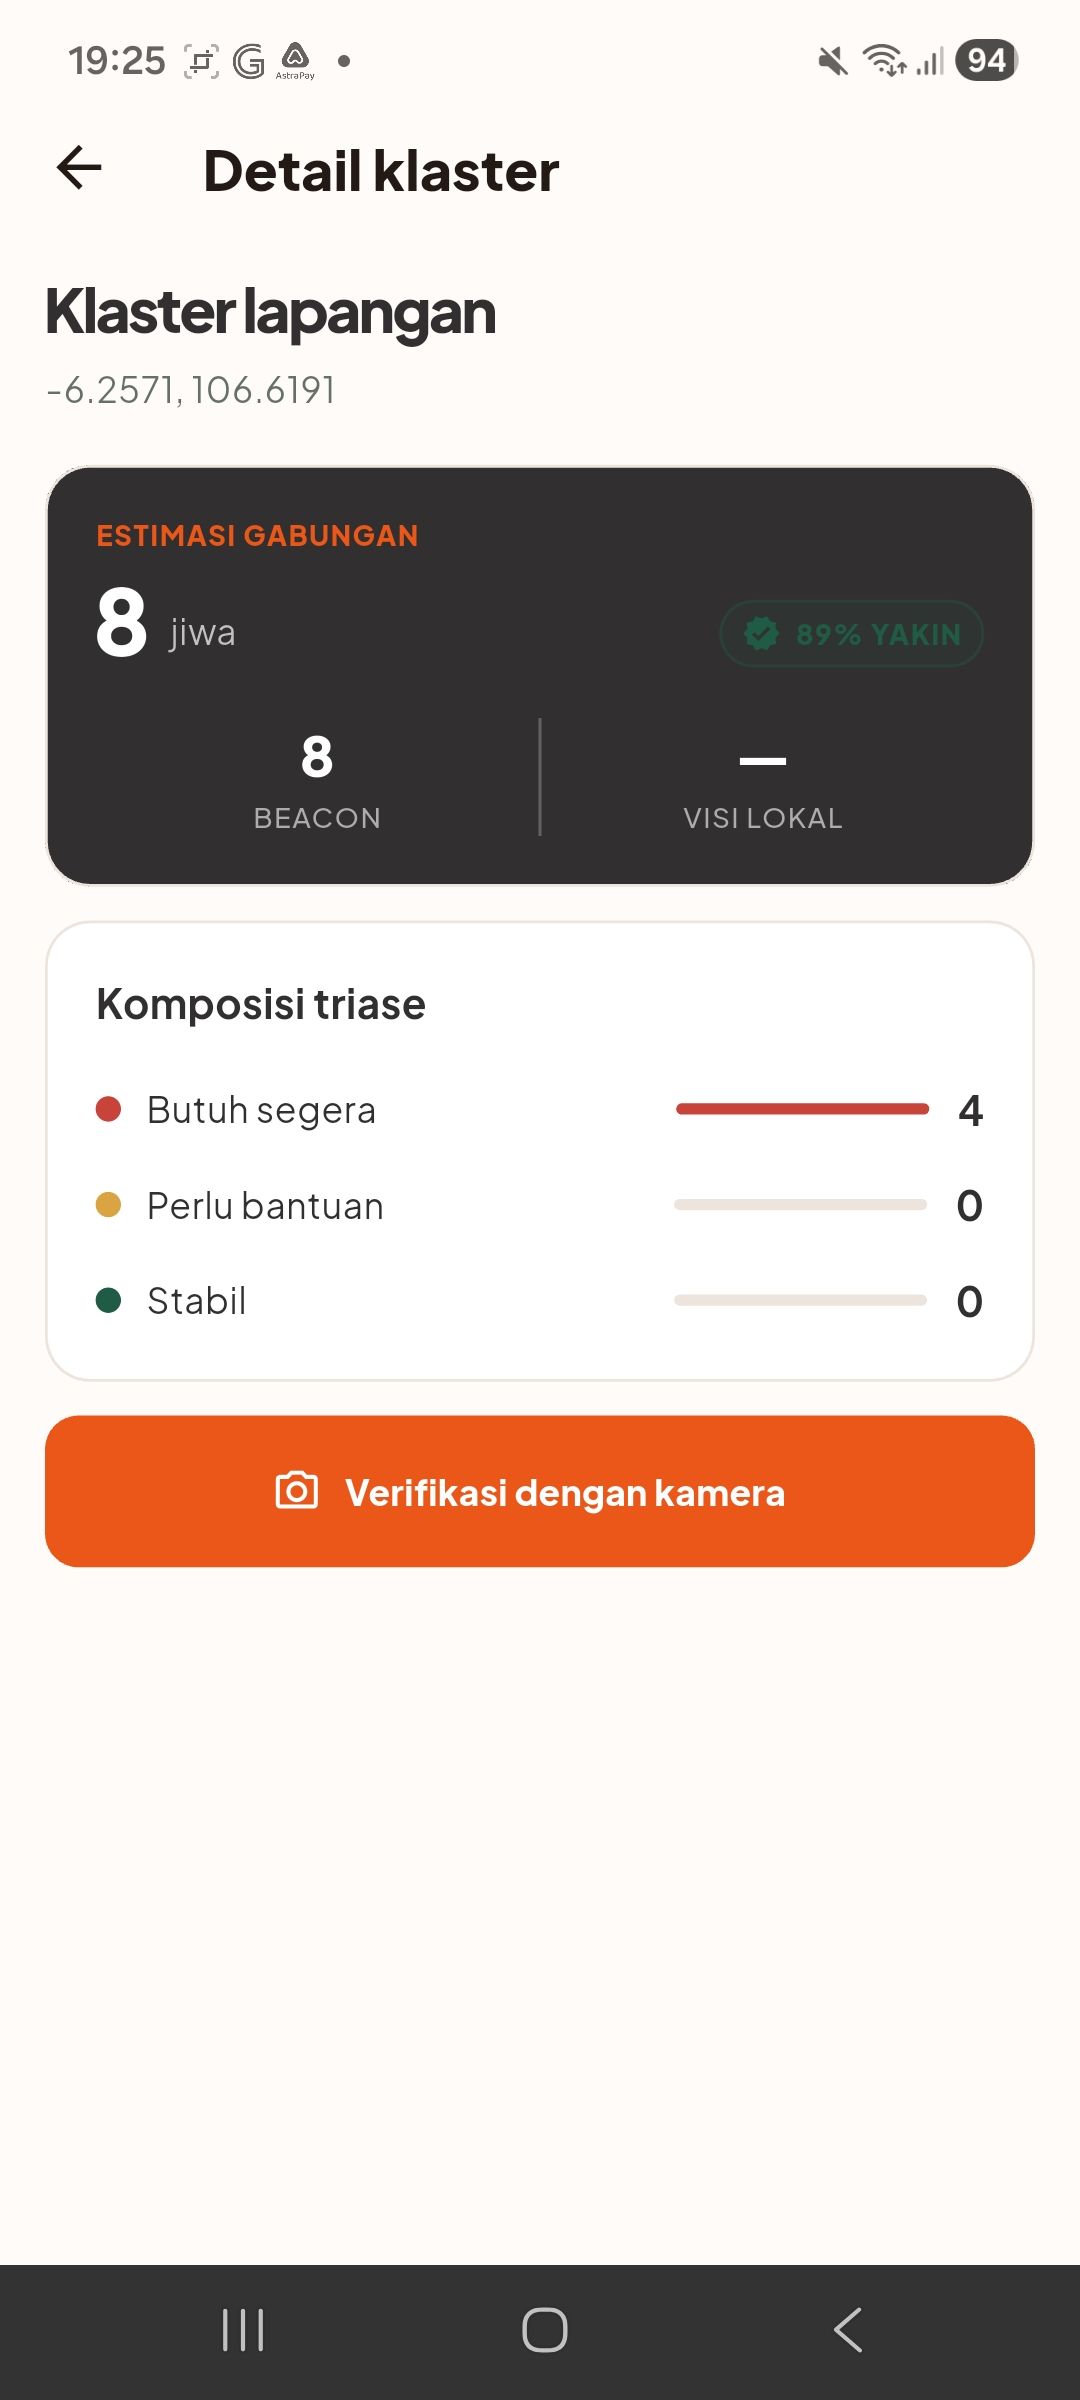
People Counting Page (for SAR role)
-
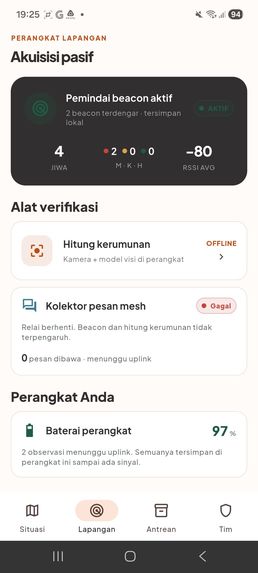
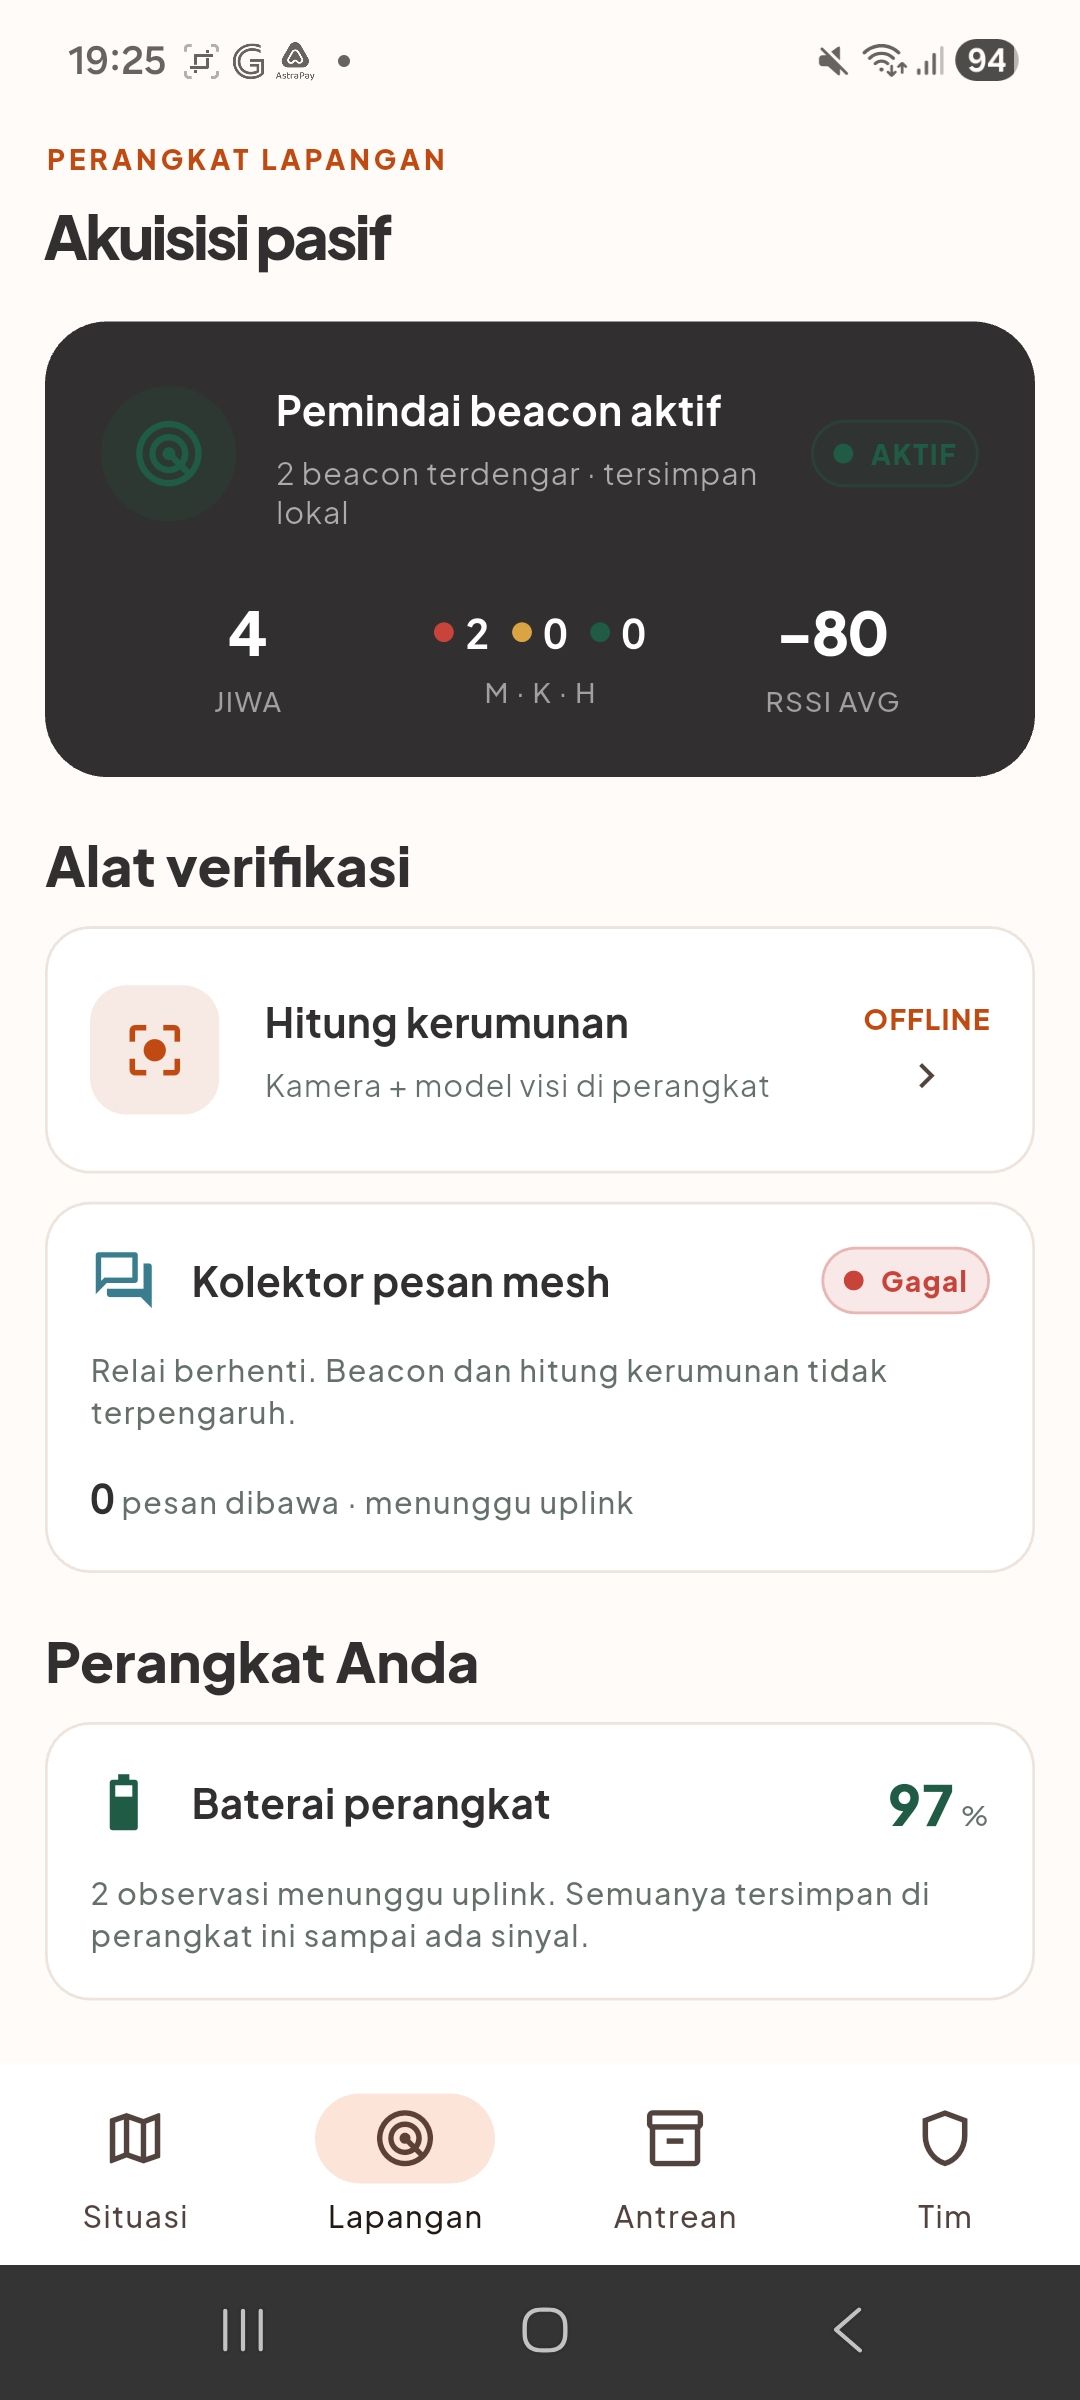
Field Page (for SAR role)
-
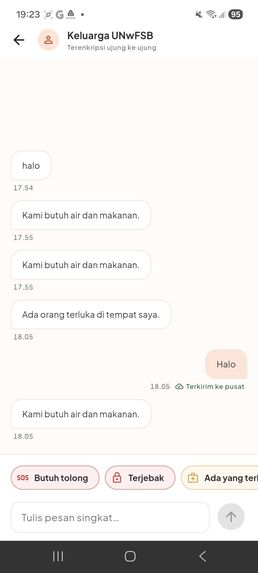
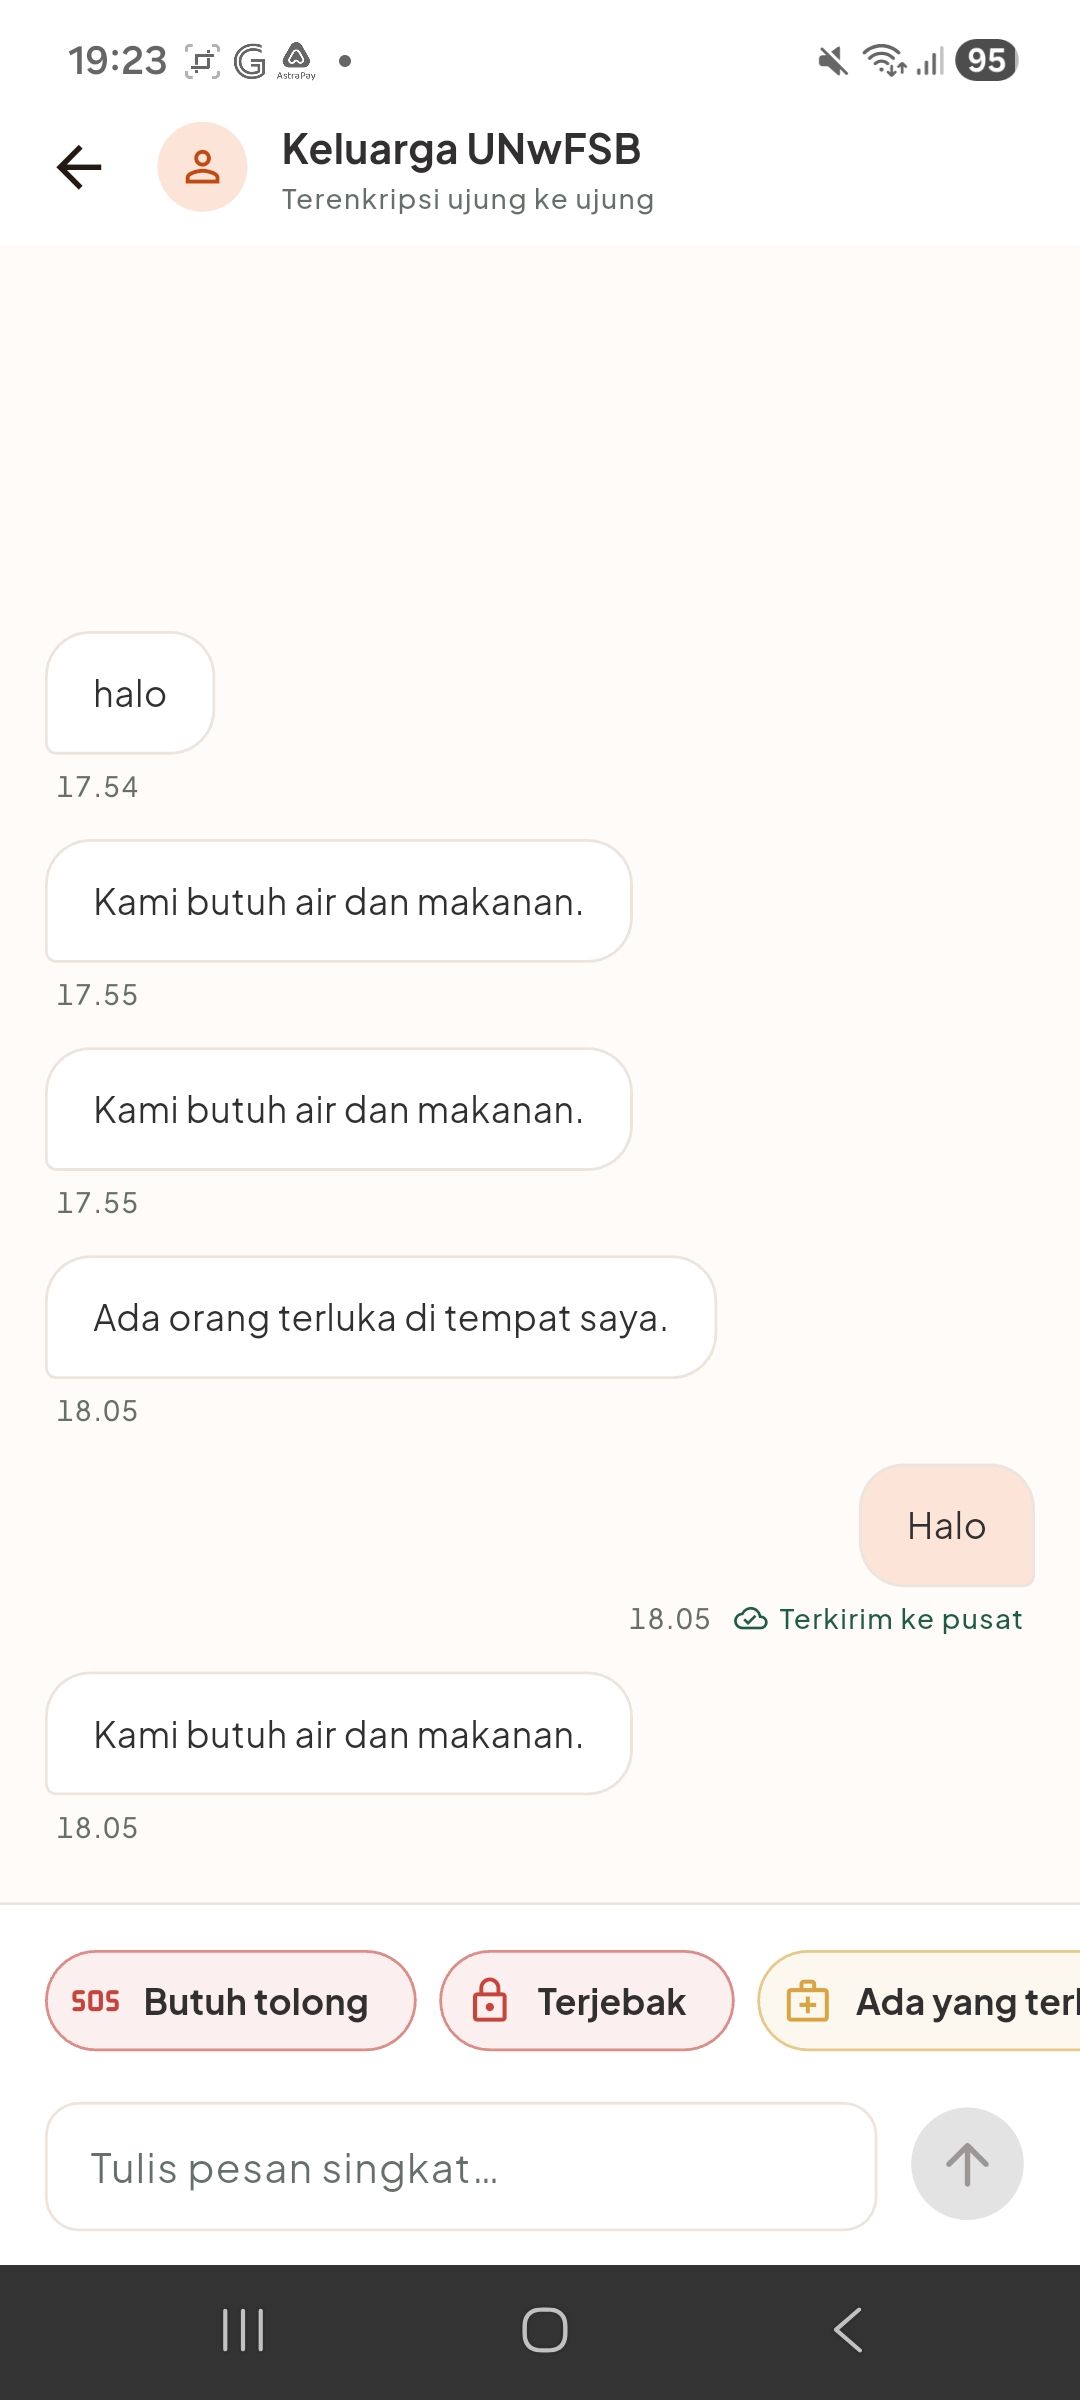
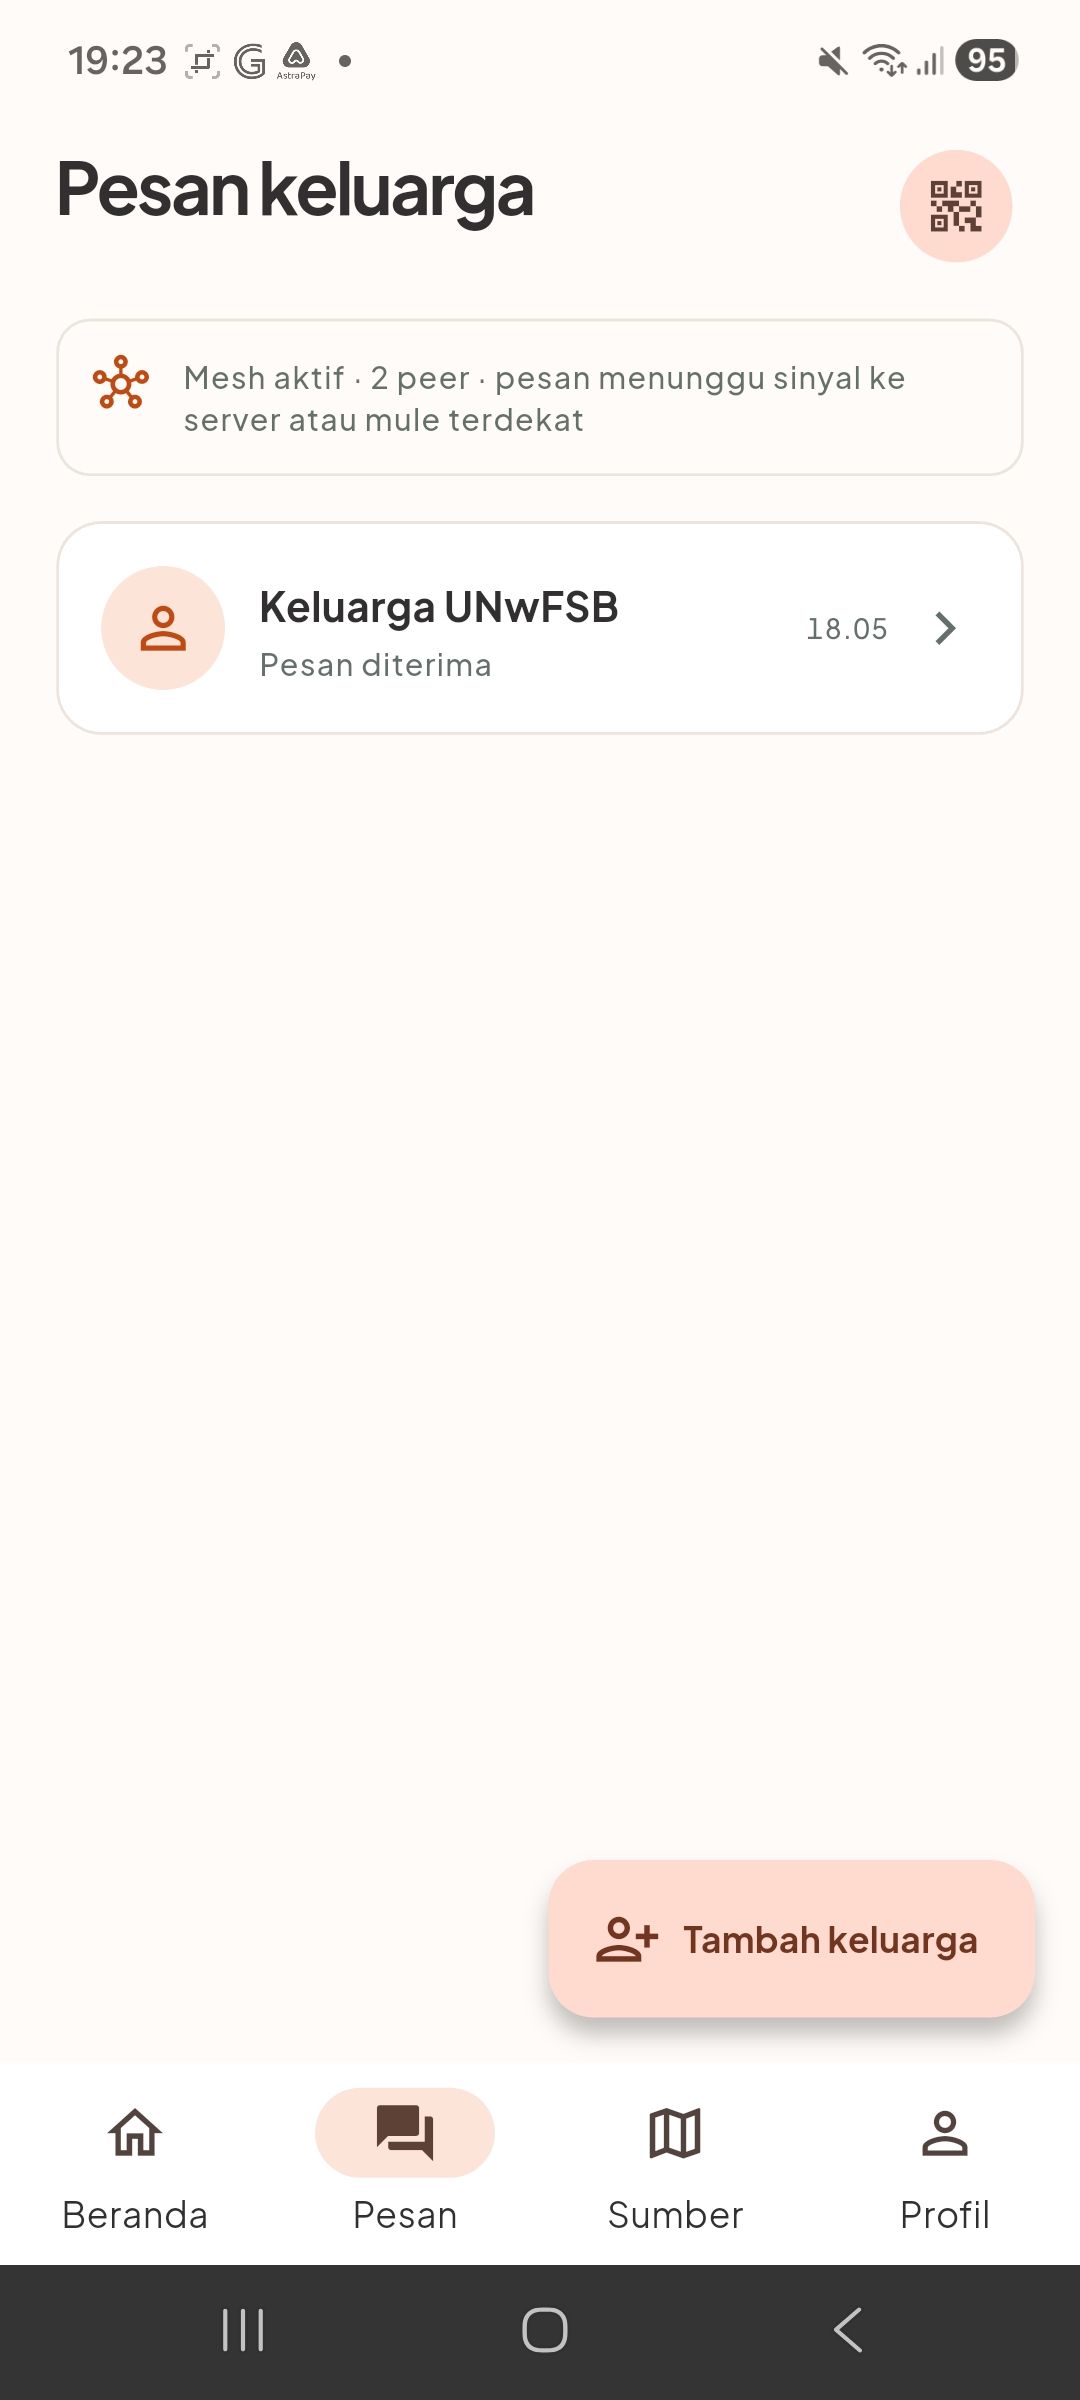
Message Page (for public)
-
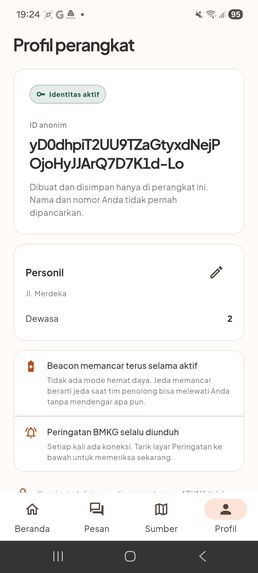
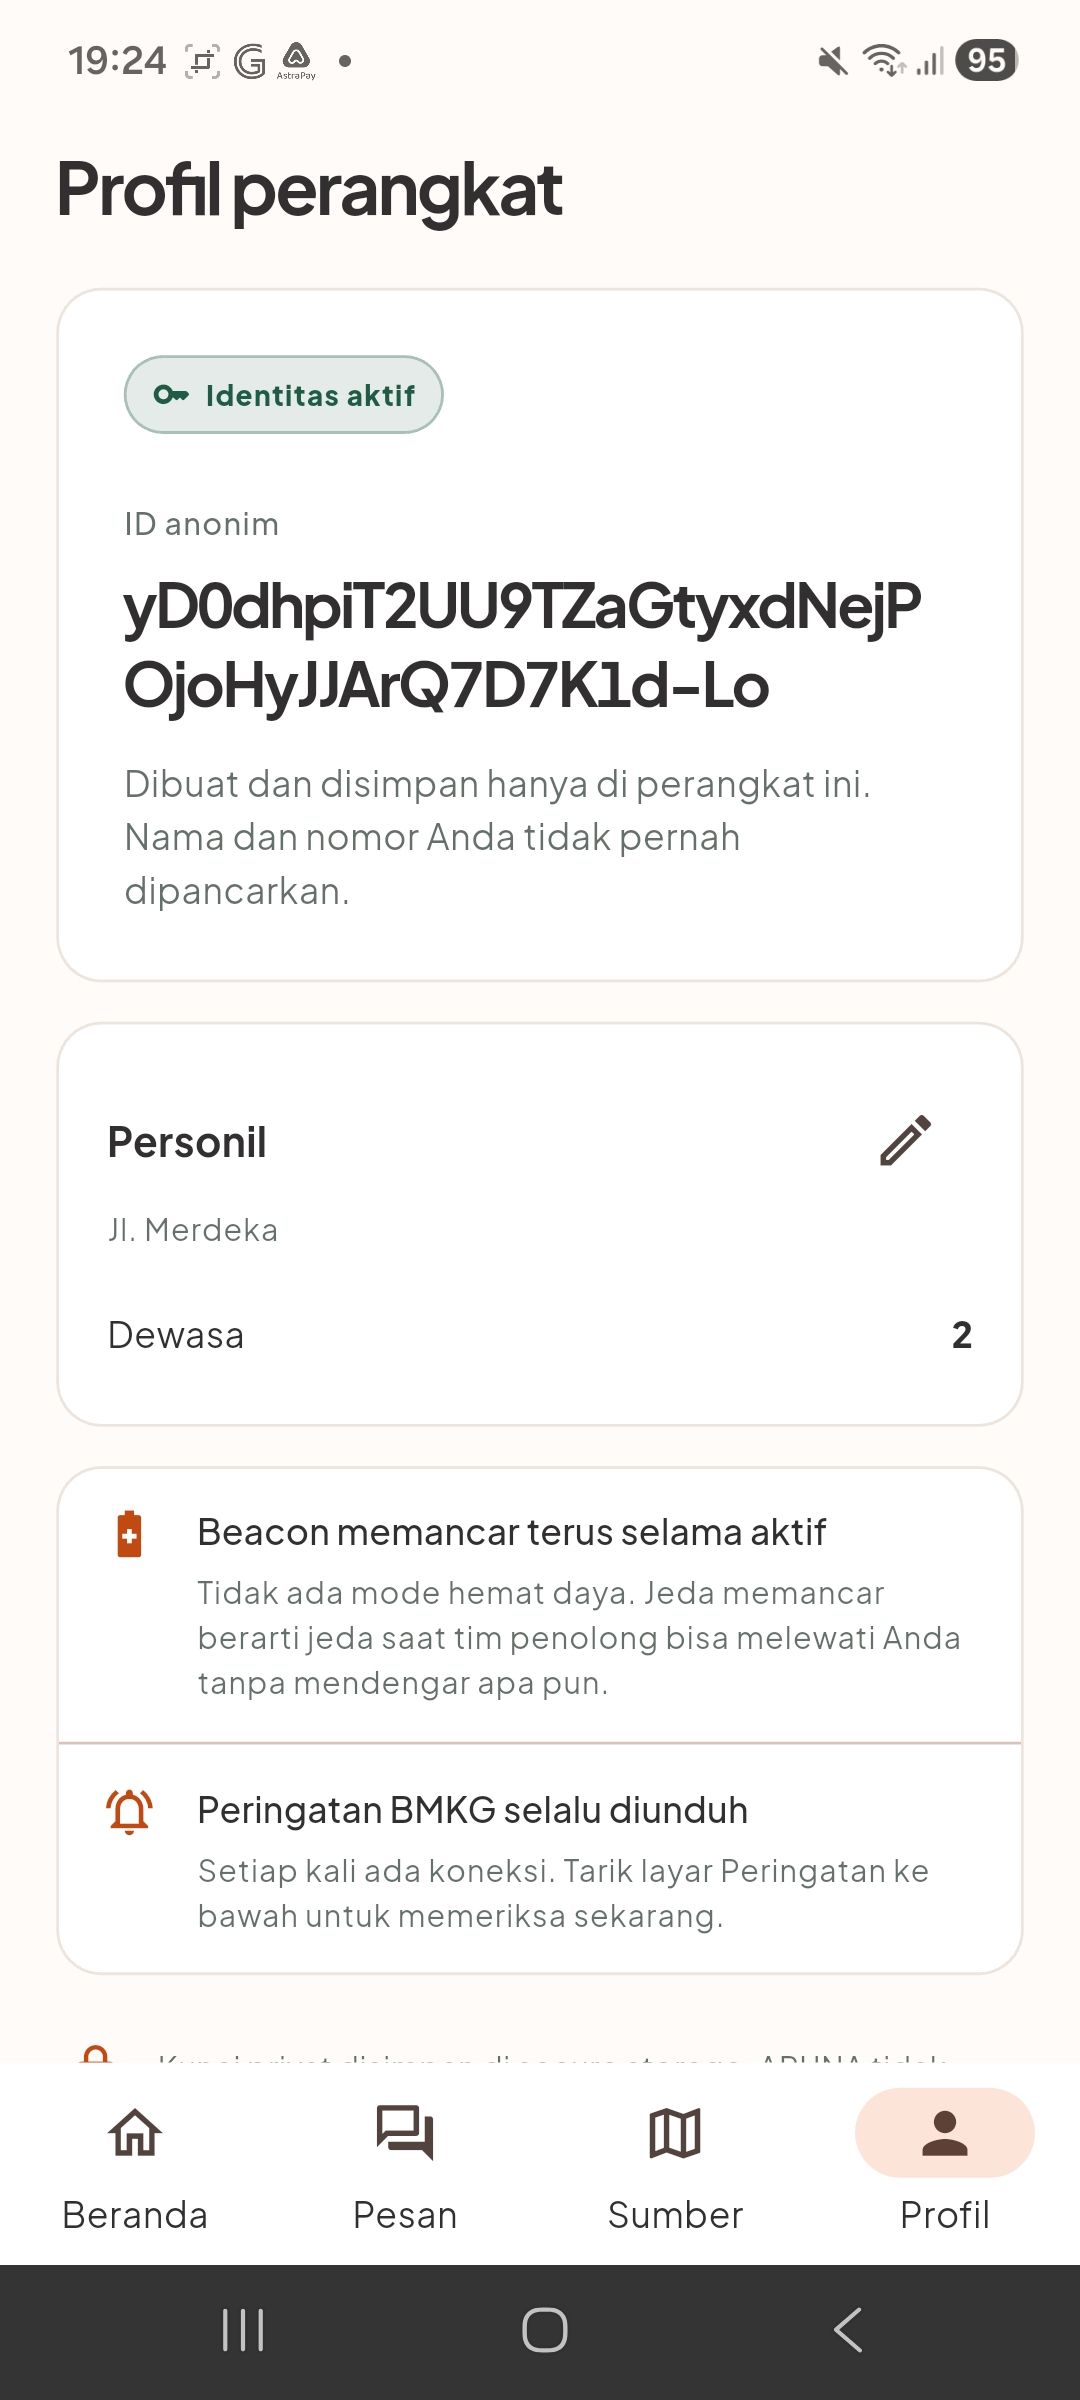
Profile Page (for public)
-
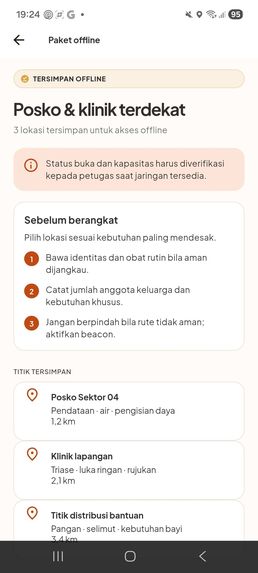
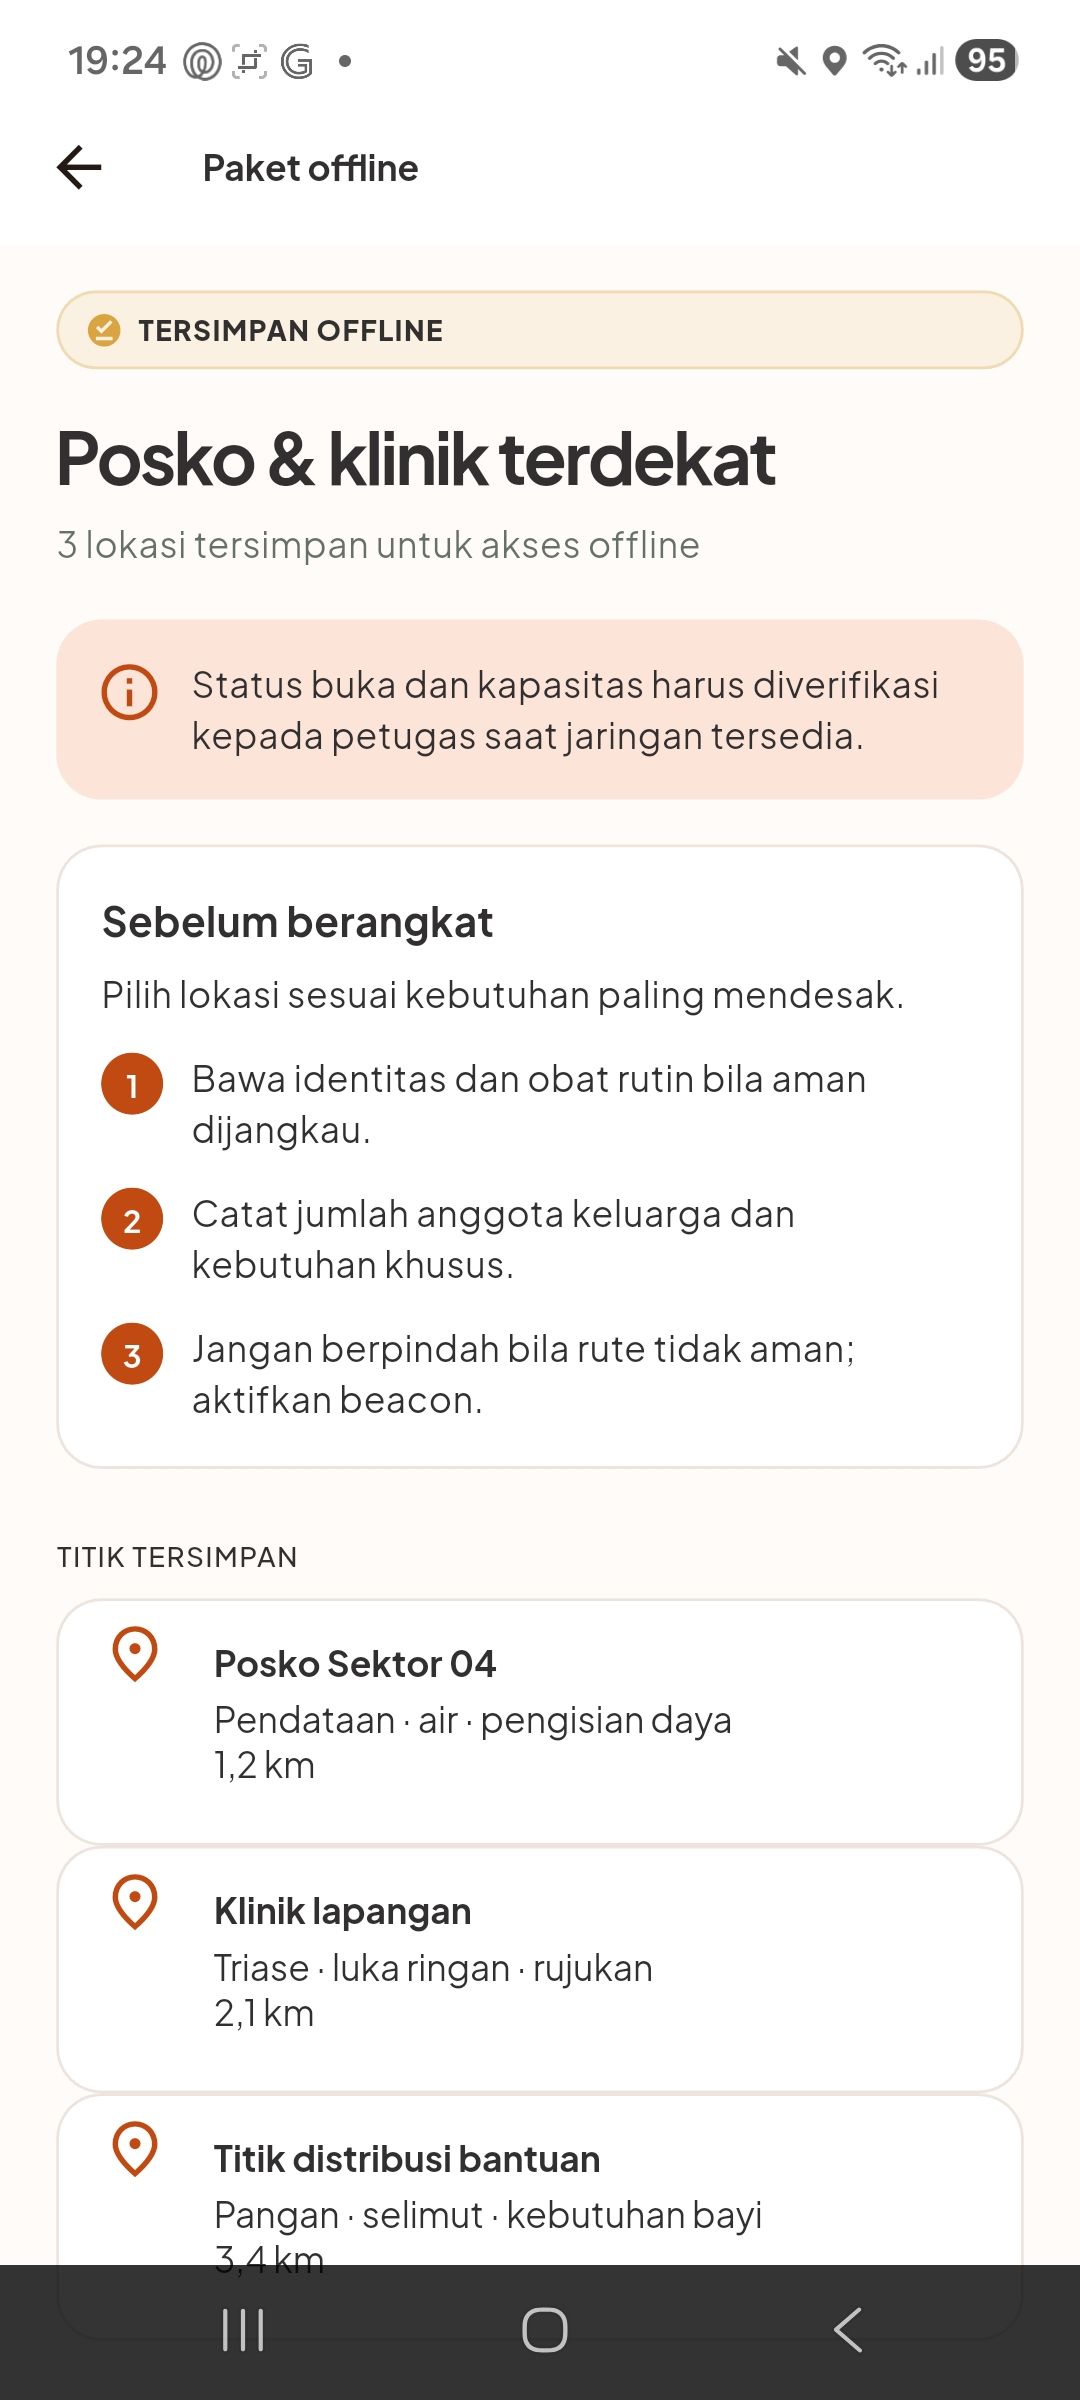
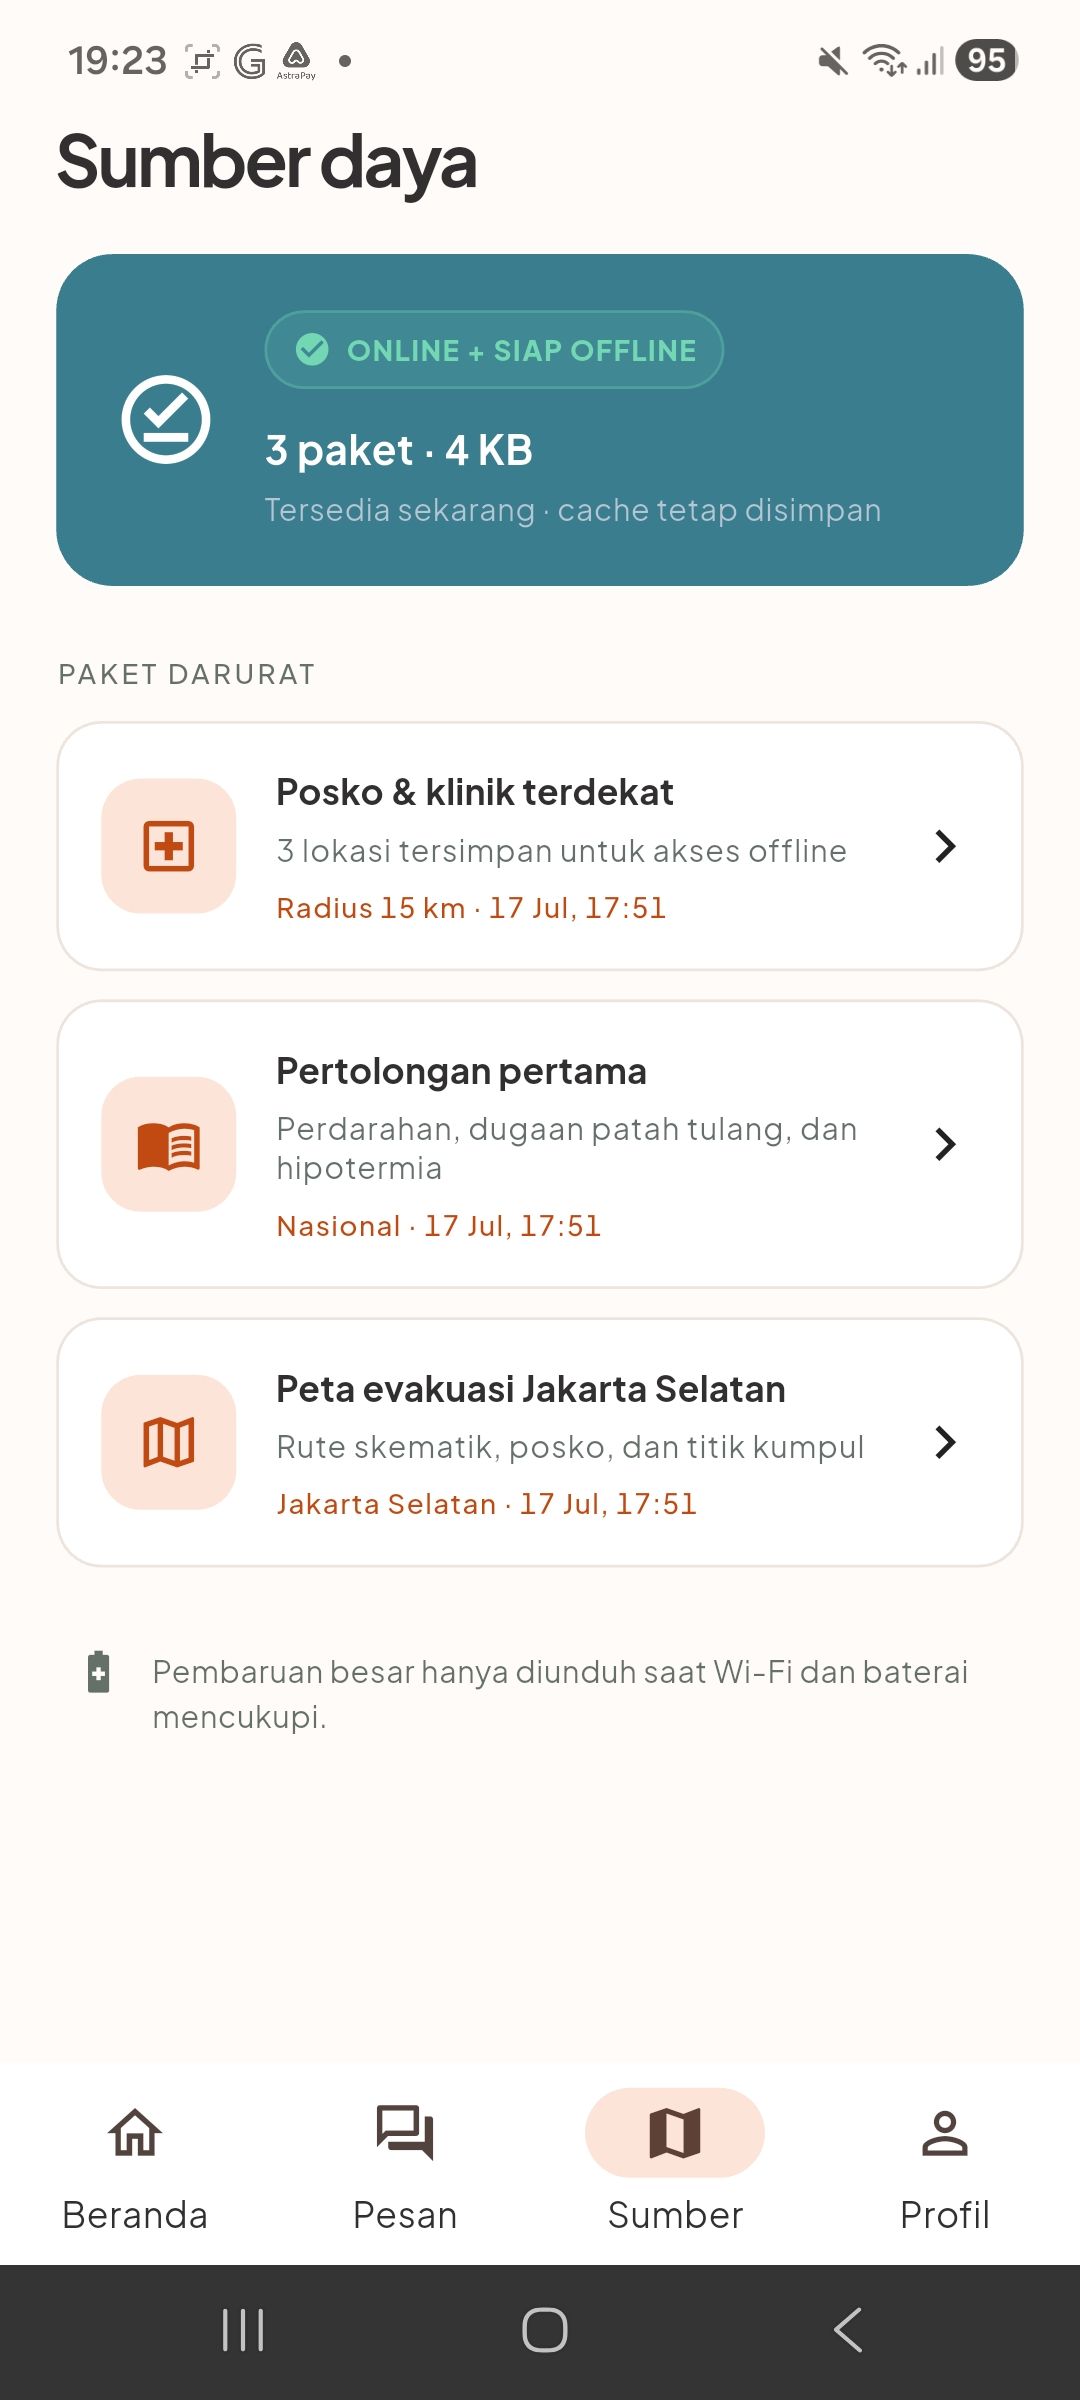
Guide Page (for public)
-
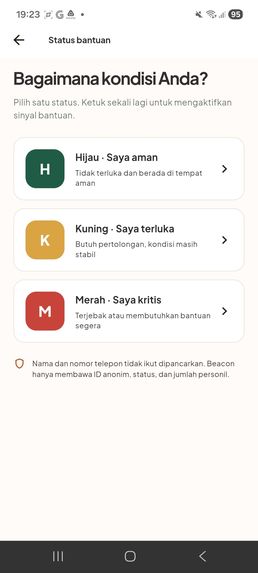
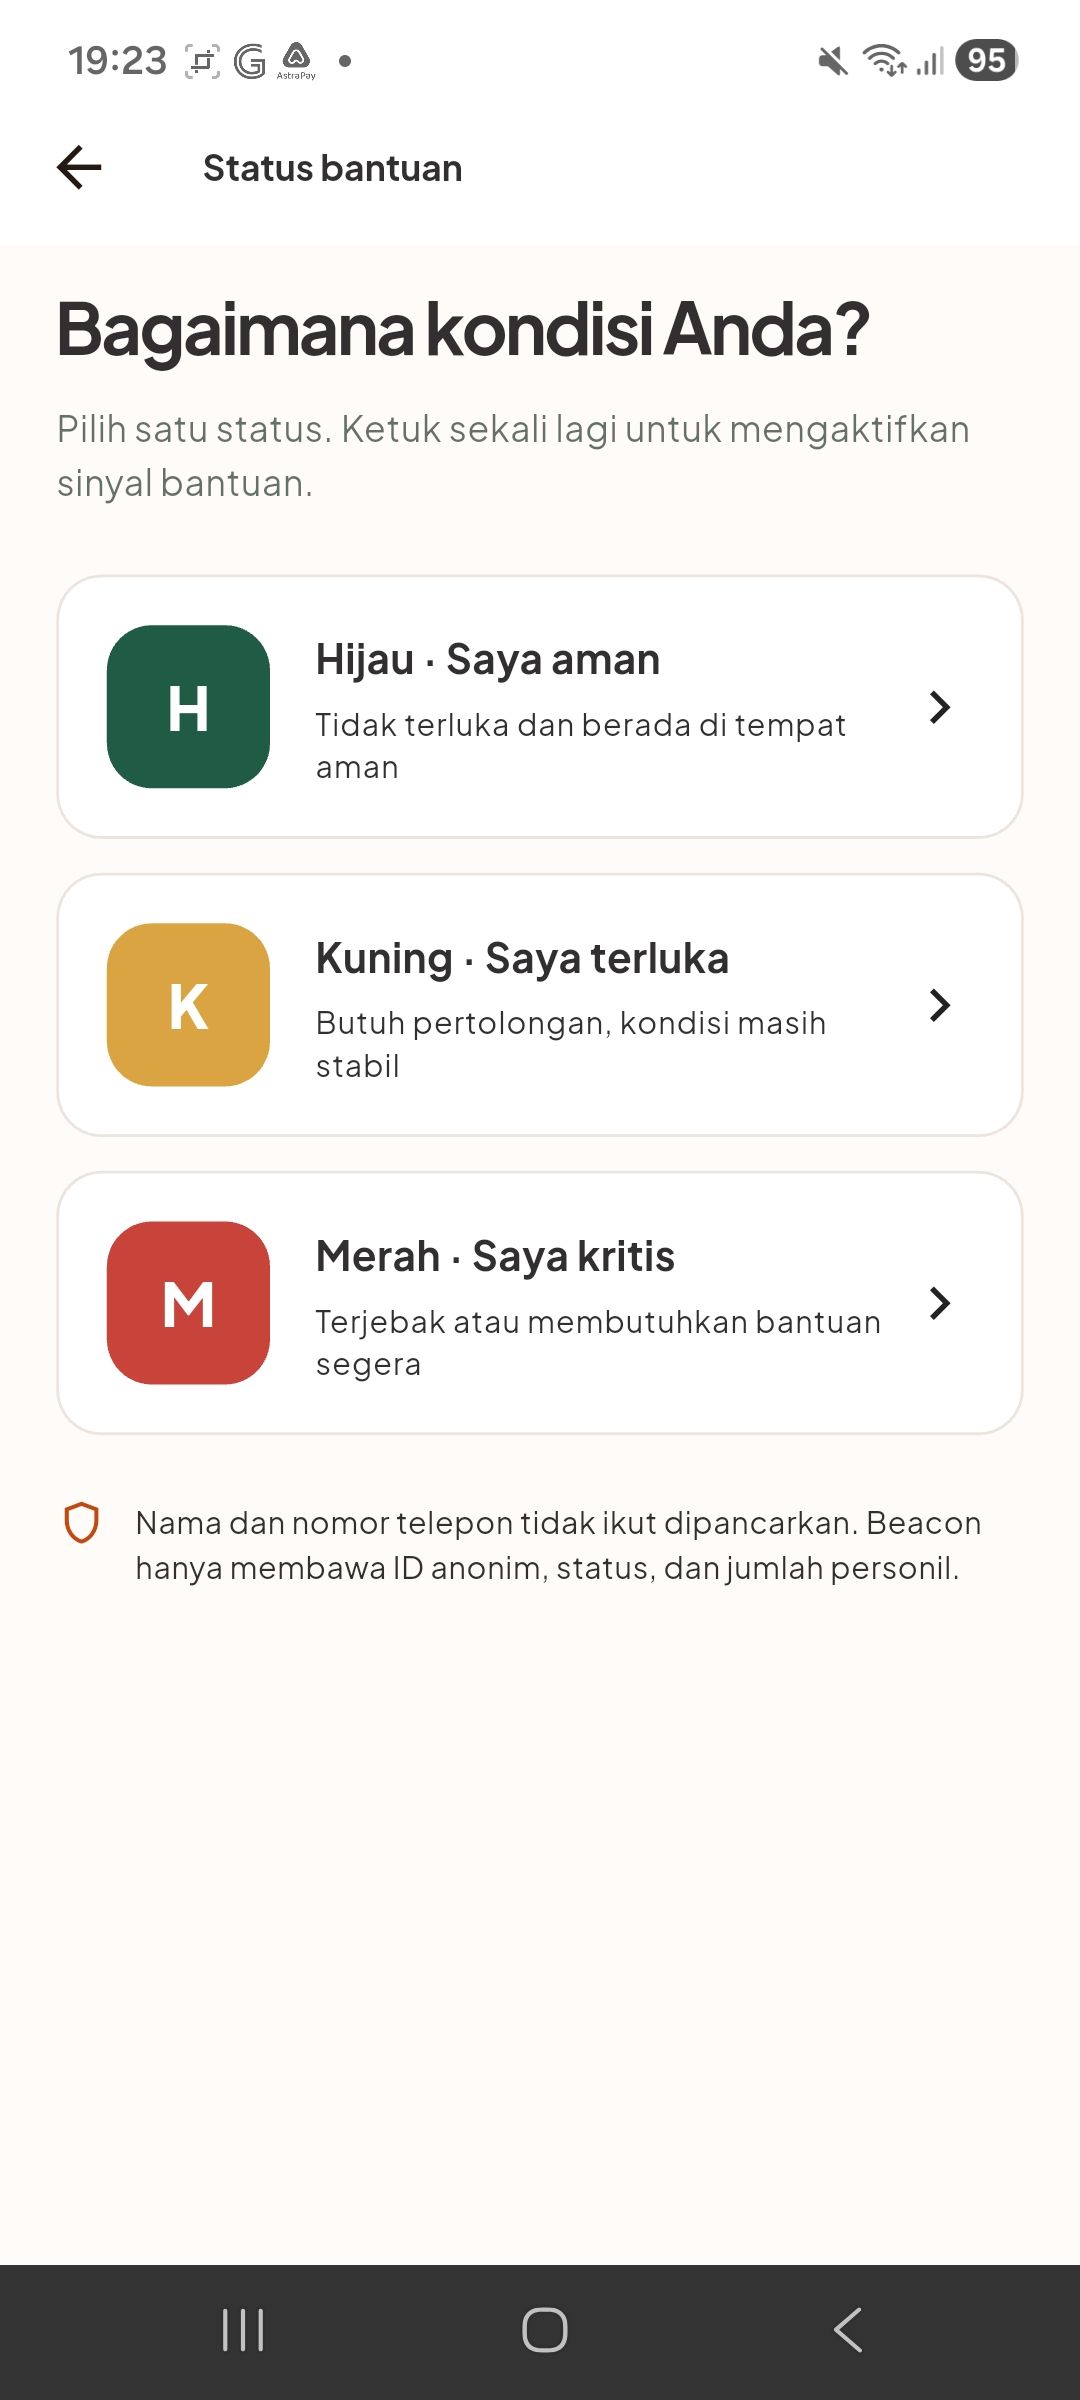
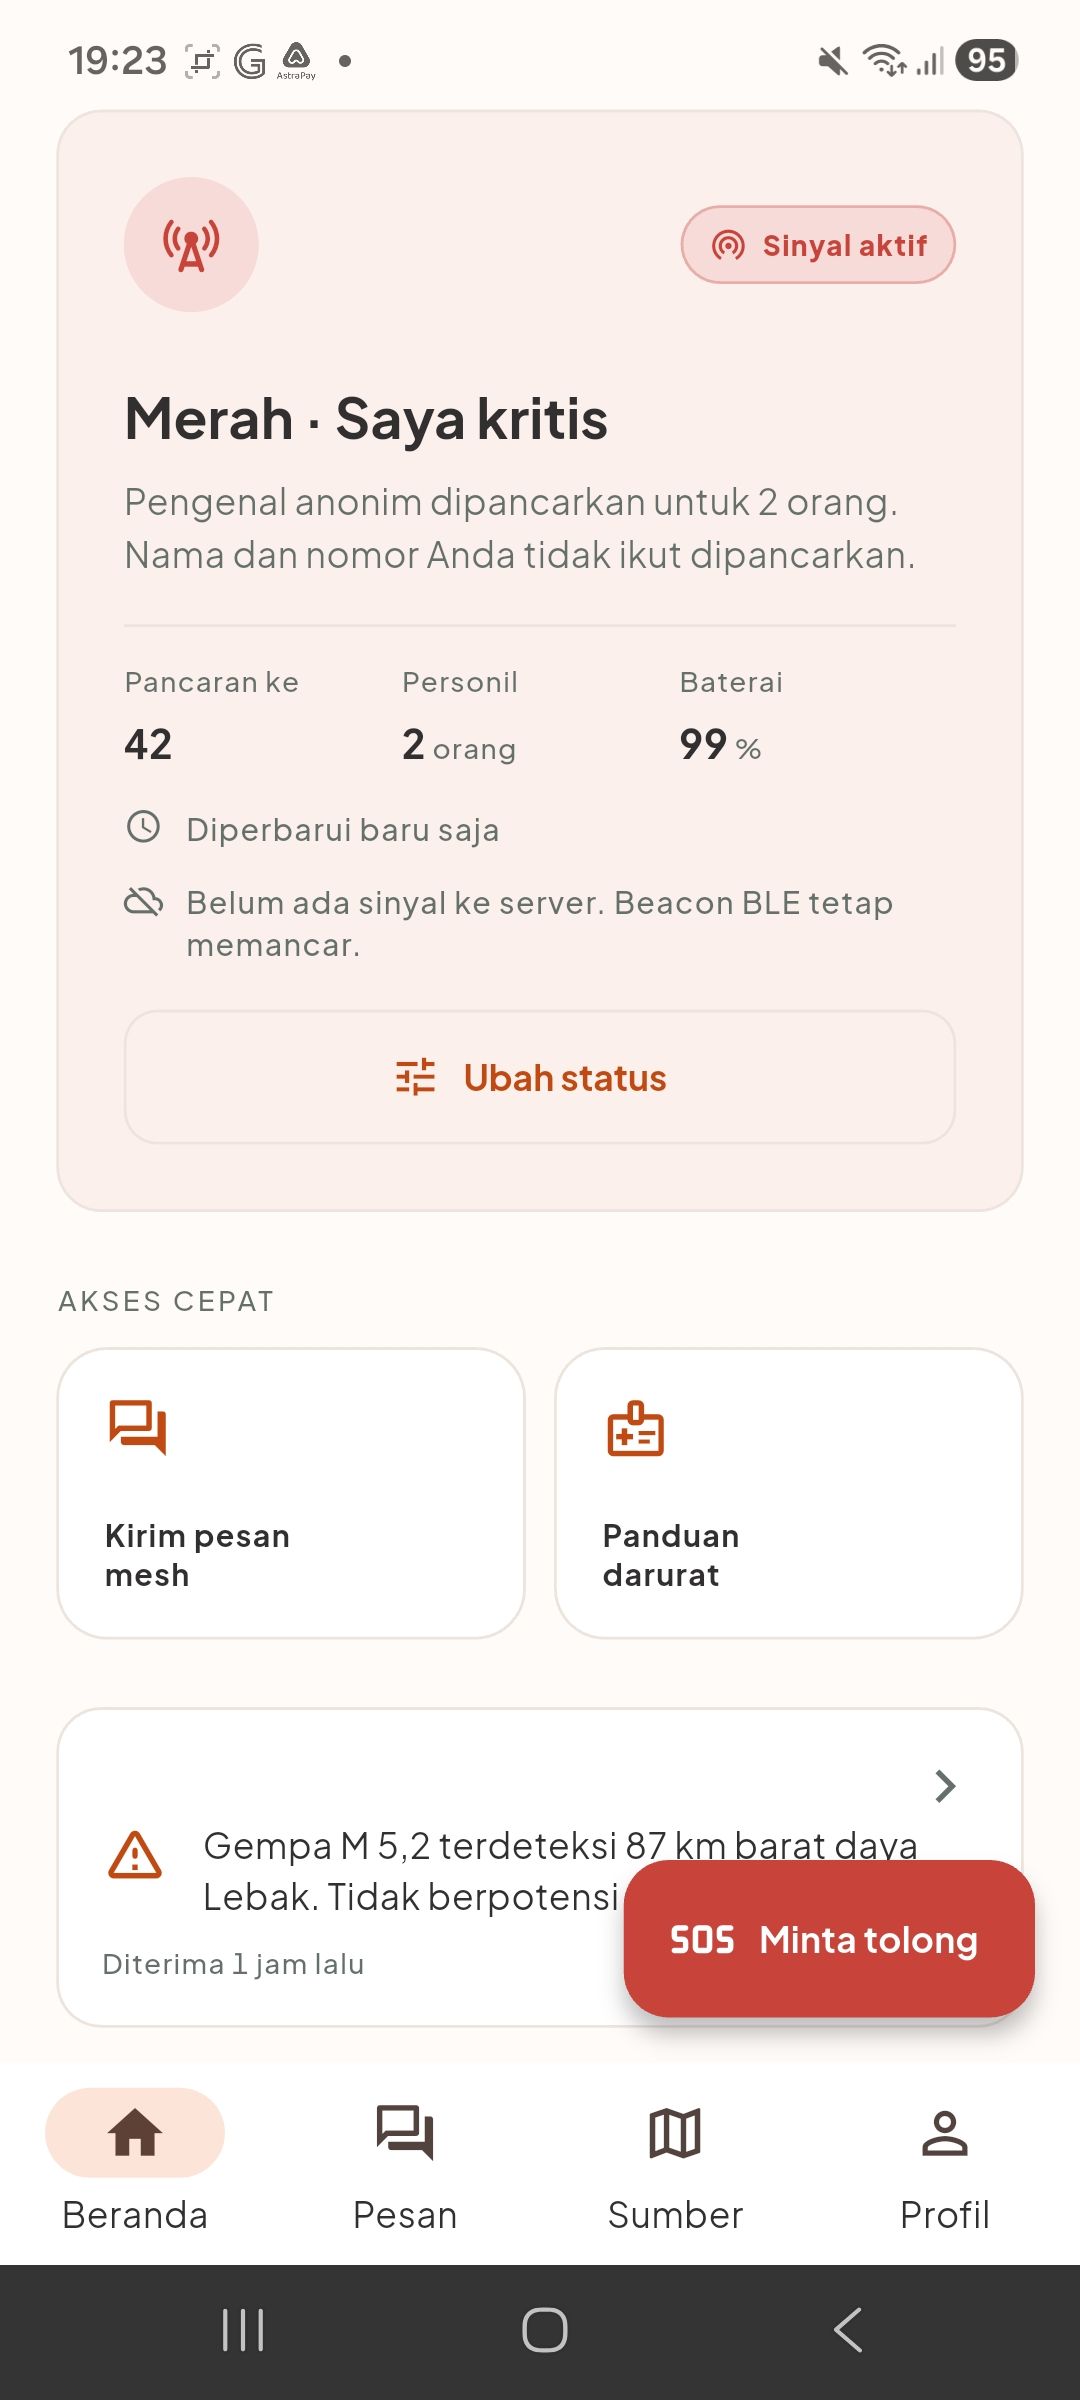
Status/SOS Page (for public)
-
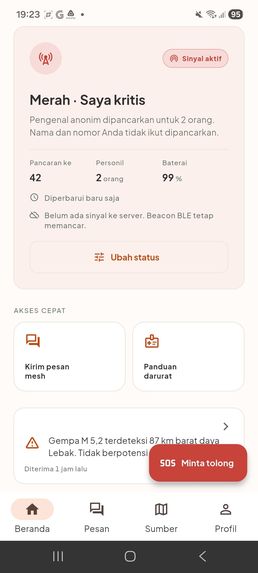
Home Page (for public)
-
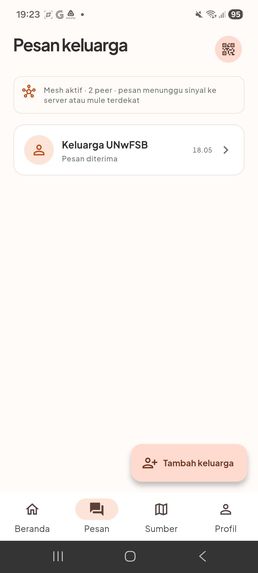
Contact/Family Page (for public)
-
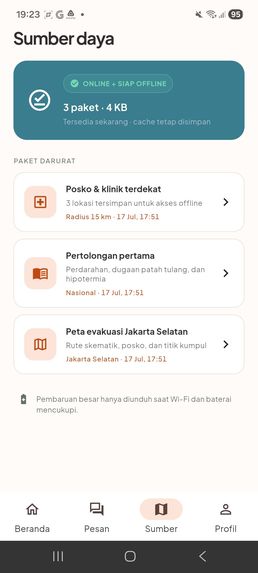
Guide Page (for public)
-
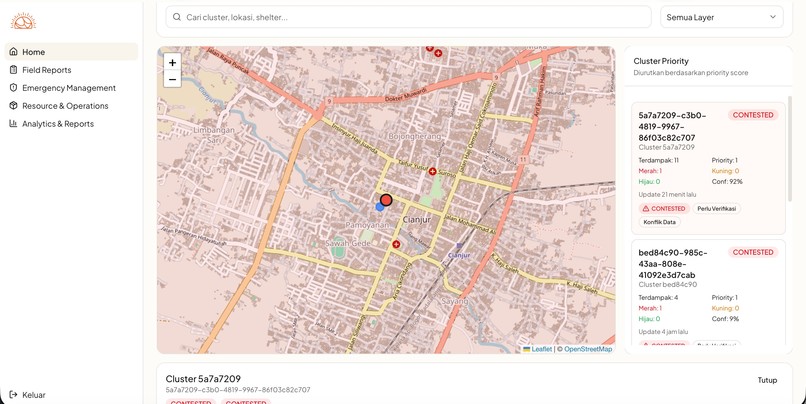
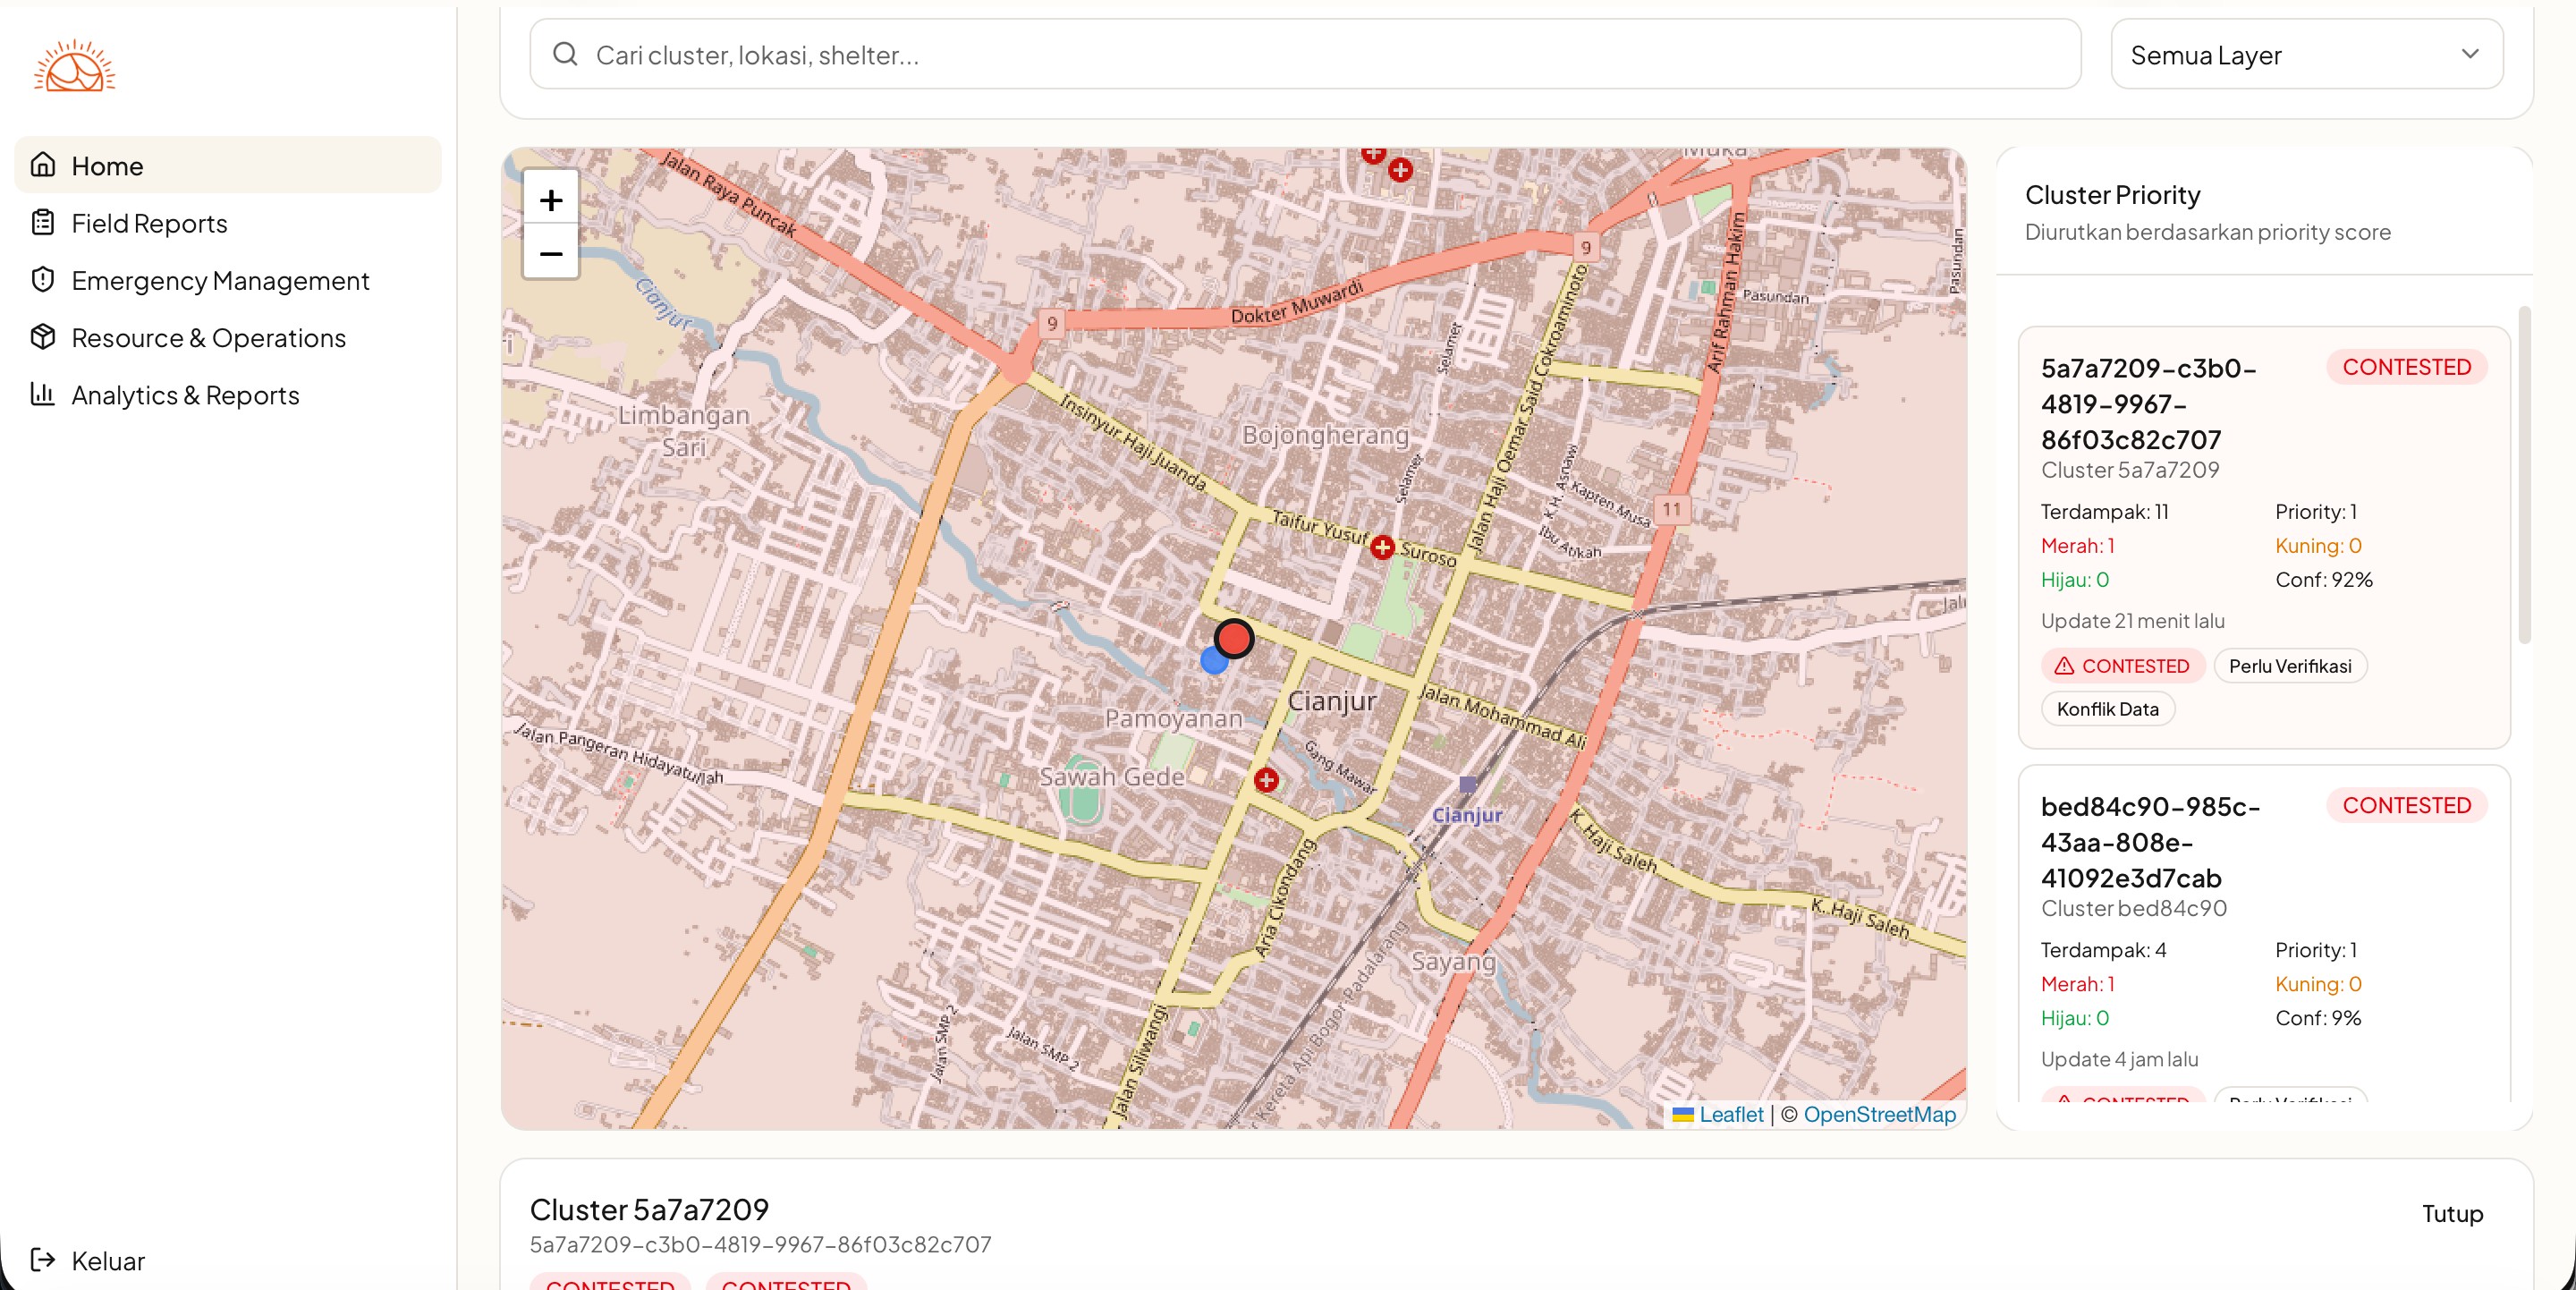
Map Dashboard (for government role)
-
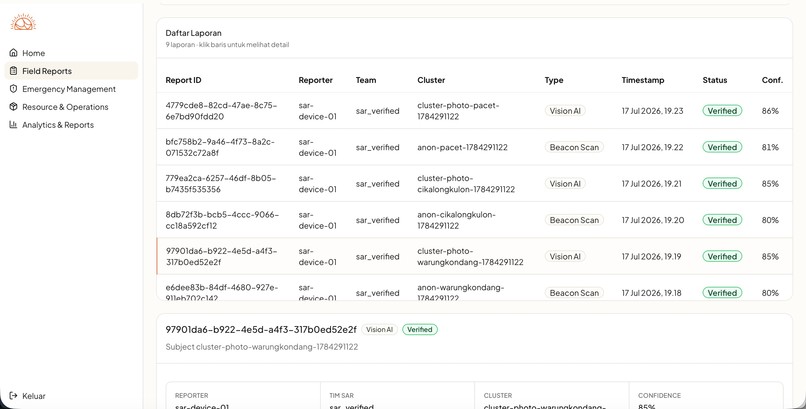
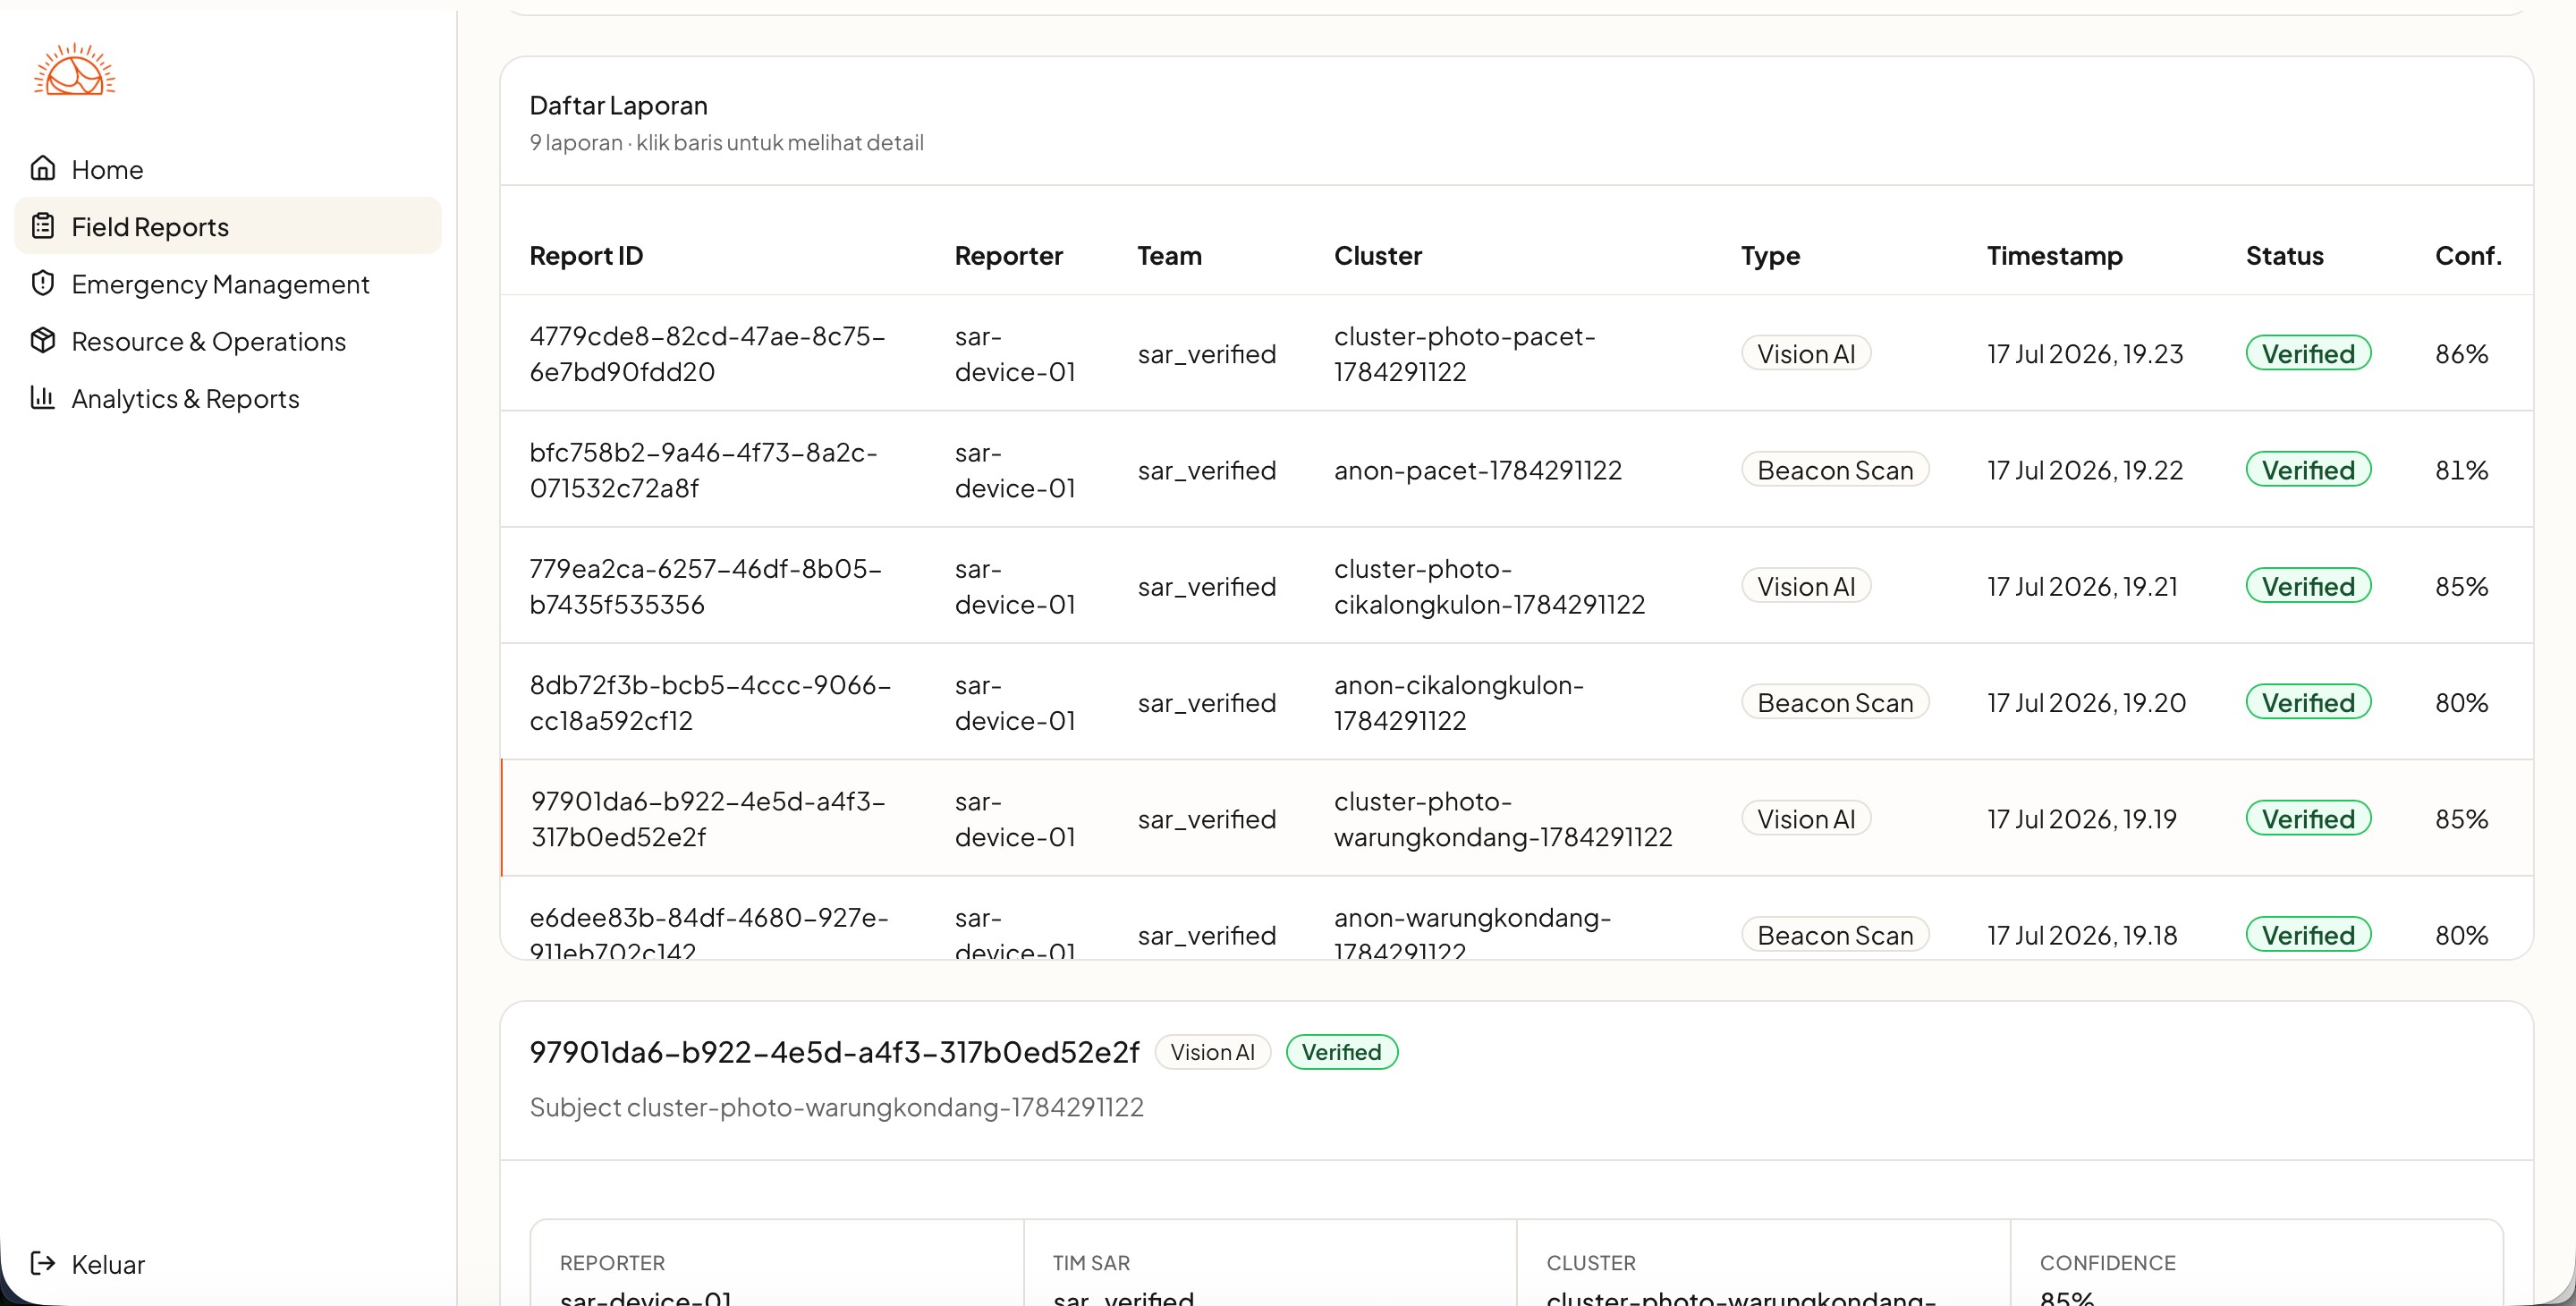
Field Report Page (for government role)
-
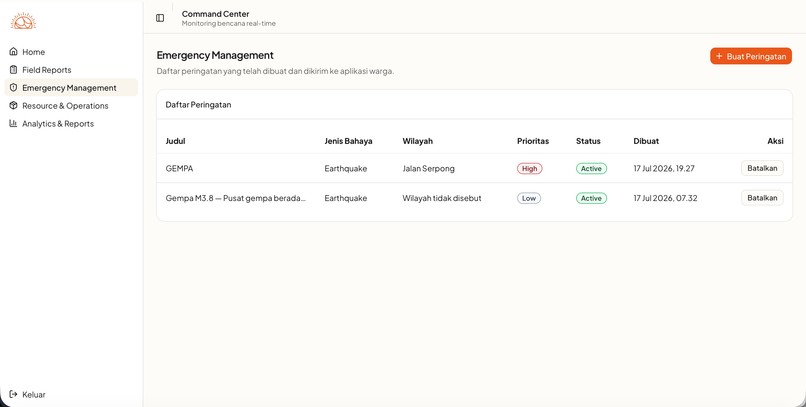
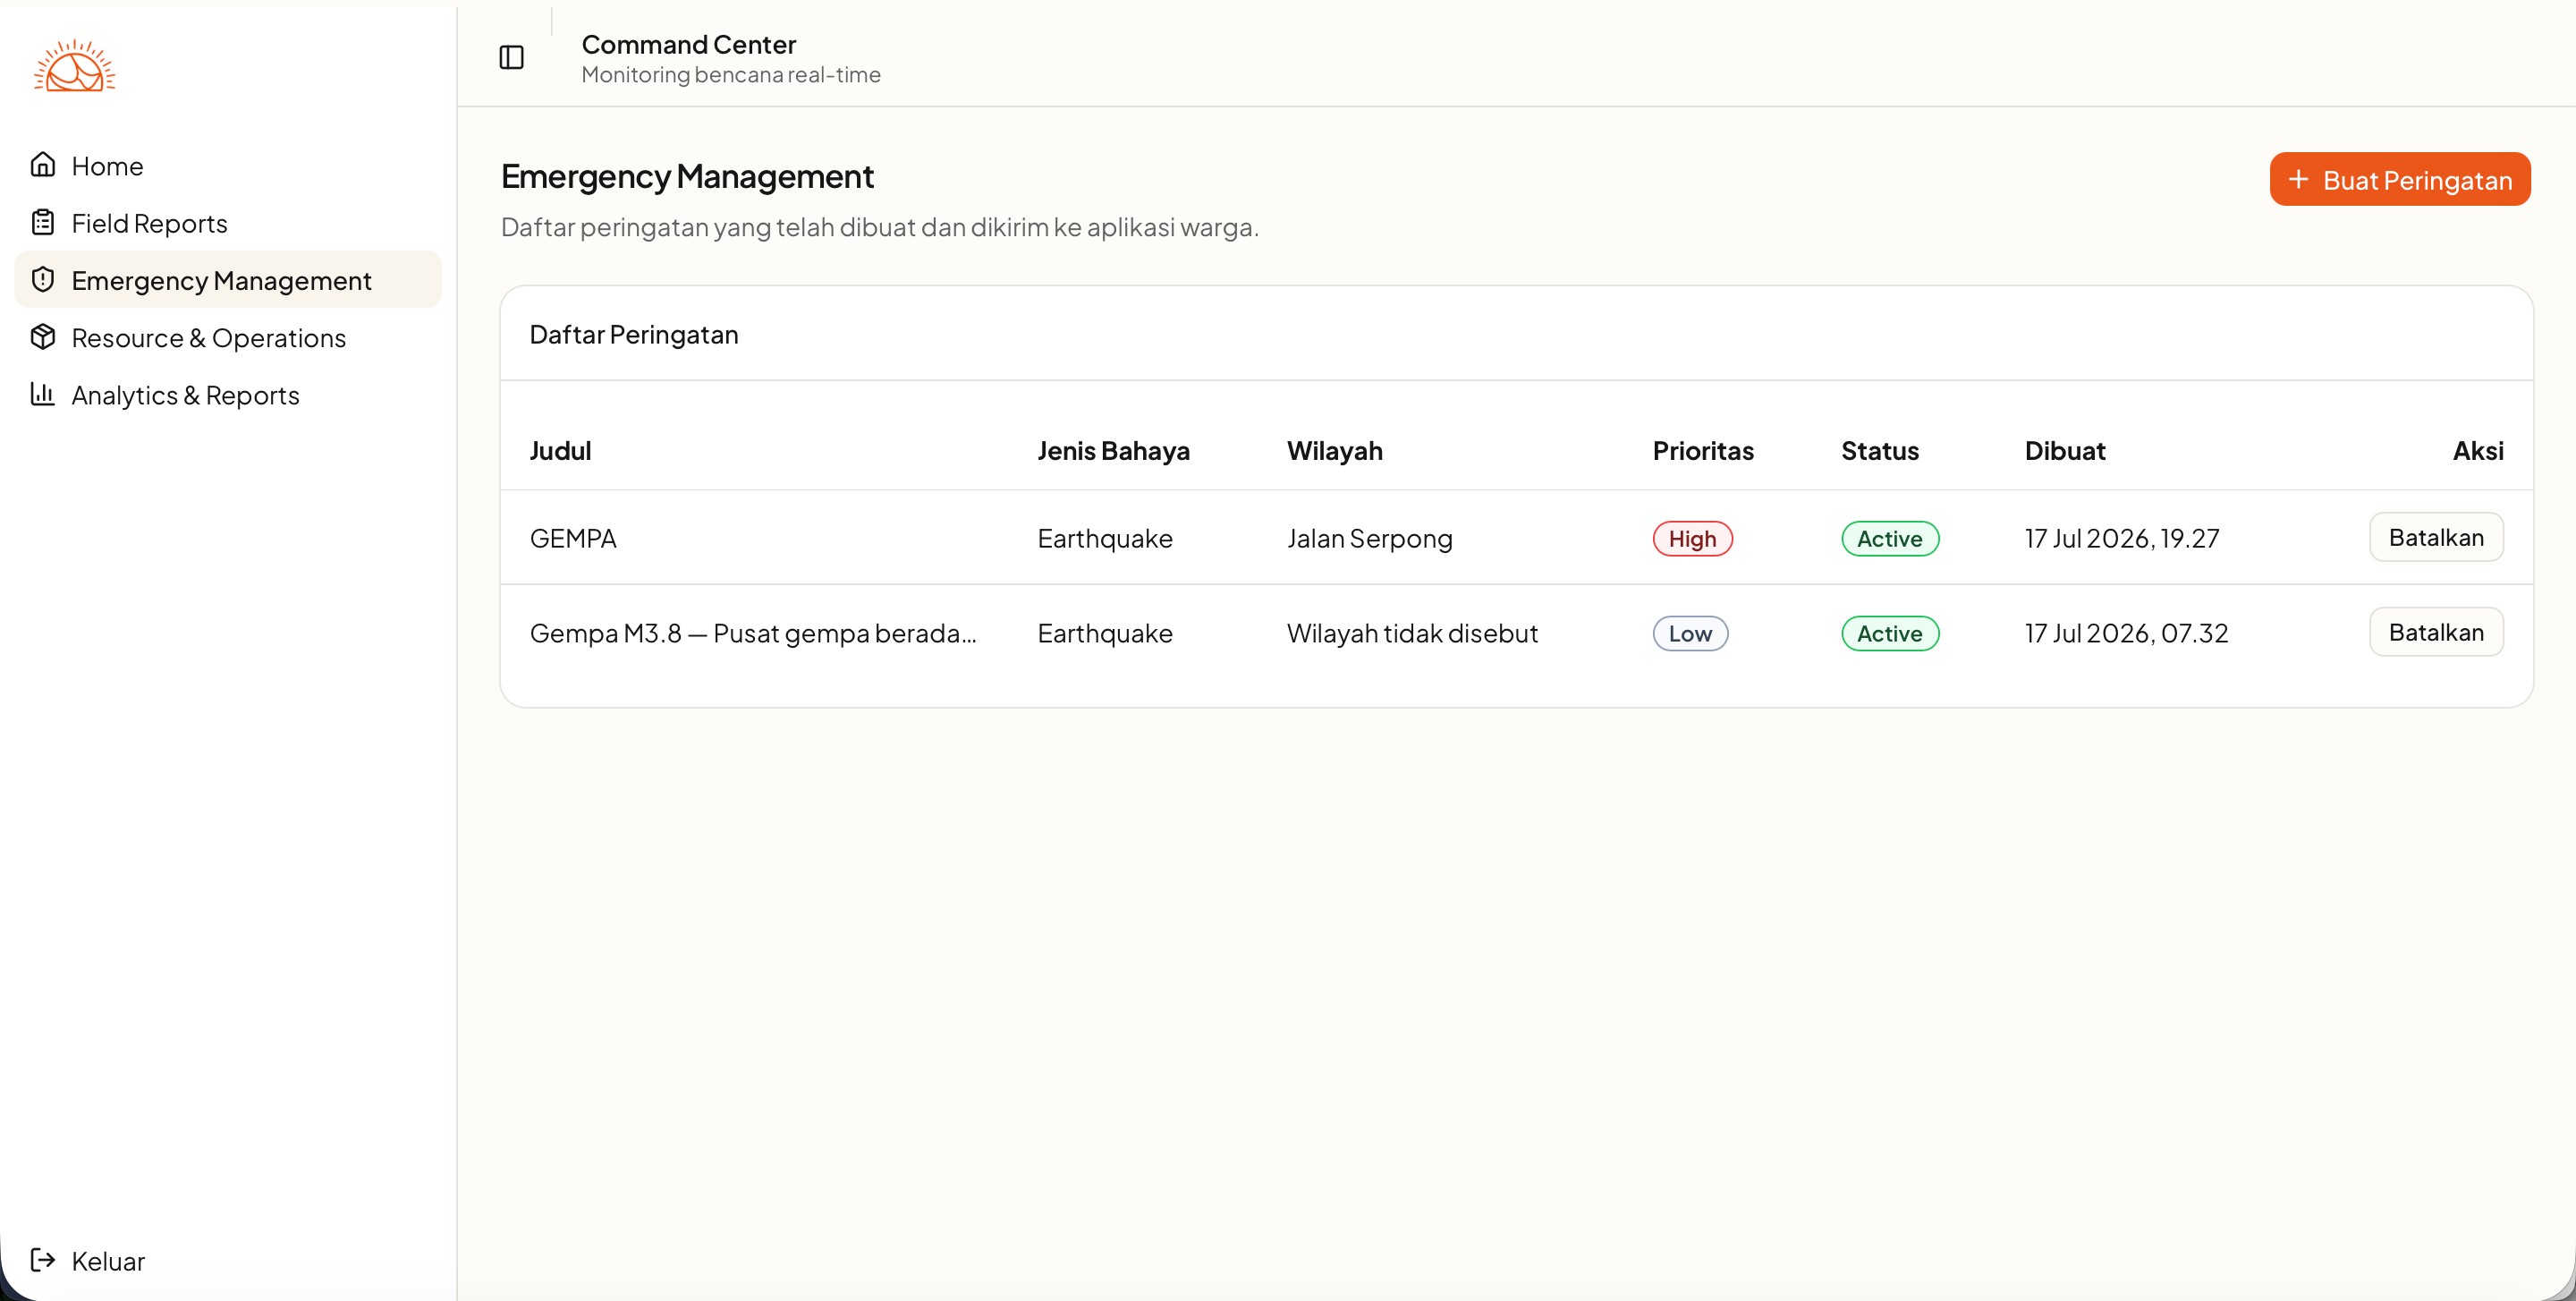
Emergency Management Page (for government role)
💡 Inspiration
Every year, thousands of disasters strike Indonesia. But the deadliest moment isn't the disaster itself, it's the silence that follows.
We started by looking at the numbers. Indonesia is consistently ranked among the top 3 most disaster-prone countries in the world (World Risk Index 2024, score 41.13). In 2024, BNPB recorded over 2,000 disaster events across the archipelago, affecting millions of people. What struck us wasn't the frequency, it was the pattern of what happens after impact.
When a disaster hits, cell towers fall with the buildings. The moment infrastructure collapses, the entire chain of decisions, from victim to responder to command post, breaks down simultaneously. Rescue teams move blind. Families wait in silence. Aid gets distributed based on assumptions, not data.
We realized that Indonesia's early warning systems, BMKG for earthquakes and weather, InaTEWS for tsunamis, are actually well-developed. The problem isn't the warning. The problem is what happens the moment that warning becomes reality and infrastructure goes down with it. No existing system is built for that gap.
That gap has a name. We call it Information Blackout and Aruna is built to close it.
❓ What It Does
Aruna is an End-to-End Disaster Information Continuity & Decision Intelligence Platform, focused on three of Indonesia's most destructive hazards: earthquakes, tsunamis, and extreme weather.
It works across three pillars that form one continuous chain:
Pillar 1 — Information Continuity
- Victims' phones broadcast short-range status beacons that hop device-to-device through a mesh relay, no cell tower required
- A responder moving out of the impact zone carries the collected data queue and uploads everything at once the moment they reach connectivity (burst sync)
- Gate 1 ensures victim heartbeats only activate on a verified official alert, privacy by design, not by policy
- Gate 2 ensures field data is only accessible under an active emergency declaration
Pillar 2 — Information Trust
- Aruna's Trust Engine applies a confidence-and-decay algorithm: every data point carries its source, timestamp, and reliability weight
- Reports lose credibility over time; agreeing sources amplify each other; conflicting sources are flagged CONTESTED, never silently averaged
- When a victim's signal goes completely silent during a high-risk hazard, the system escalates their triage automatically, silence, here, is a rescue signal
- An on-device AI model (EfficientDet) estimates how many people in a cluster have never sent any digital signal at all, the unreached estimate
Pillar 3 — Decision Intelligence
- The Need Engine translates verified cluster data into specific resource recommendations per location: clean water (liters), formula units, chronic medication packs, medical staff, and stretchers
- Calculations are based on the demographic profile each household registered before the disaster, infants, elderly, pregnant, and disabled/chronic members
- The command dashboard displays every data point with its source, age in minutes, and confidence level, no number appears without context
🔧 How We Built It
Mobile — Flutter / Dart
- Two separate Flutter applications sharing a core layer, both built offline-first
- Victim App: anonymous Ed25519 identity, household profile (including vulnerable demographics), two-tap triage, mesh message queue with TTL, and preparedness checklist
- SAR App: passive BLE beacon scanning, on-device crowd counting via EfficientDet Lite0, field verification, courier queue (store-carry-forward), and opportunistic burst sync
- Stack: Flutter, Dart, Riverpod, GoRouter, Drift (local SQLite), Dio + Retrofit + retry, Flutter Secure Storage, Nearby Connections P2P_CLUSTER (Android mesh relay)
Backend — Node.js / TypeScript
- Modular monolith with eight modules:
auth,sync,observations,clusters,alerts,declarations,messages,operations - Trust Engine and Need Engine implemented as pure functions, zero I/O, zero database calls, fully testable with a case table and no running infrastructure
- Spatial clustering via PostGIS ST_ClusterDBSCAN, rebuilding automatically inline after every burst sync
- BMKG earthquake and weather feeds polled on a schedule and normalized into a unified
hazard_eventstructure - Stack: Fastify, PostgreSQL, Docker Compose, BMKG Open Data API
Command Dashboard — Next.js / TypeScript
- Real-time disaster graph view: clusters ordered by priority score, confidence-aware color coding (FRESH / DECAYING / STALE / CONTESTED)
- Dedicated badge for silence-escalated nodes, visually distinct from all other states
- Five-line need panel per cluster showing resource requirements with data age
- Stack: Next.js App Router, TypeScript
🤔 Challenges We Ran Into
Making silence meaningful without making it noisy.
The hardest design challenge was treating a missing signal, specifically during a high-risk hazard, as information, not absence. The solution was the signal_loss_risk attribute per hazard type (HIGH for earthquakes, tsunamis, landslides, and building collapses; LOW for others), combined with time-gated thresholds: 15 minutes of silence escalates GREEN --> YELLOW, 30 minutes escalates YELLOW --> RED. Every escalated status is marked presumptive and resets the moment any new observation arrives.
Displaying trust, not just data.
Building a system that shows not just what the data says but how much to trust it required defining the full Trust Engine output contract, confidence, status, is_contested, presumptive_triage, silence_minutes, before any other module was written. In our codebase, this is fully implemented: confidence is calculated per cluster via weighted SQL and sent to the dashboard as a 0–1 probability. DataStatus in types/map.ts handles "FRESH" | "DECAYING" | "STALE" | "CONTESTED". Clusters are flagged CONTESTED when confidence drops below 0.45 or when conflicting reports (e.g., a phone SOS reports 20 survivors but drone footage shows 5) exceed the conflict tolerance. lastSeenMinutes is derived from extract(epoch from (now() - o.observed_at))/60 and feeds into silence_escalated_count. On the dashboard, clicking any map marker shows the confidence score as a percentage and a visual decay layer, DECAYING nodes fade, FRESH nodes render solid.
Making mesh relay actually work across devices.
Designing the multi-hop relay protocol, TTL management, message_id deduplication, store-carry-forward queuing, had to be completed before any UI was written because every mobile feature depends on it. Android and iOS handle background radio access very differently, which meant iOS relay had to be scoped out of this submission entirely. Getting Android mesh to work reliably across real devices, with correct hop counting and no relay storms, was one of the most time-consuming parts of the build.
Maintaining focus during a fast-paced build.
Building four interconnected applications simultaneously, Backend, Victim App, SAR App, and Gov Dashboard, while keeping the data contract frozen and consistent across all of them required constant communication and discipline. When time pressure mounts, the temptation is to cut corners on the shared contract. We held the line: the types/map.ts definitions and the burst sync payload schema stayed unchanged throughout, and it's the reason integration worked when the pieces finally came together.
🏆 Accomplishments That We're Proud Of
More than any technical achievement, what we're most proud of is building something that could genuinely matter. Every feature in Aruna was designed around one belief: a single life is worth every line of code we wrote. If this platform helps one rescue team find one survivor faster in the next disaster, it was worth building.
On the technical side, we're proud that the Trust Engine, Need Engine, and spatial clustering are real running code, not mockups. The system handles idempotent burst sync, live confidence decay, and automatic cluster rebuilding. The Silence Escalation mechanism is the idea we'll remember longest. Treating a victim's missing signal as a rescue priority, rather than just a gap in the data, is a small algorithmic decision with a potentially large humanitarian impact.
📌 What We Learned
Technical:
- How to build production-grade Flutter applications that function fully offline, where the network is an opportunity rather than a requirement
- How to design and scale a backend that serves both a mobile app and a web dashboard from a single source of truth, keeping schemas consistent across four separate codebases under time pressure
- How pure functions change the way you think about complex algorithms: the Trust Engine and Need Engine being zero-I/O made them independently testable and gave us confidence in their correctness before any integration happened
Non-technical:
- How to think about financial sustainability for a social impact product, understanding the B2G2C model, why citizen users being free is a prerequisite (not a concession), and how the LKPP e-katalog procurement pathway makes government adoption actually achievable
- How to approach go-to-market for a govtech product: pilot first, validate with a real BPBD operator, prove operational value before scaling, not the other way around
- How to define who your user actually is, separating the beneficiary (disaster victims), the operator (SAR/BPBD), and the economic buyer (government agencies with budget authority) was one of the most clarifying exercises we did
- How to move fast without losing integrity: a 30-hour build window forces you to make hard prioritization calls, and we learned that cutting a feature is often the right decision, not the easy one
✨ What's Next for Aruna
- Voice over BLE mesh, beyond text and status pings, enabling victims to send short voice messages through the mesh relay, so a survivor can speak when they can't type
- Family location sharing for victims, not just SAR teams seeing cluster locations, but victims being able to see the approximate last-known position of their registered family members, giving them agency during the most disorienting hours
- Logistics and resource vendor network, connecting the Need Engine's output directly to pre-registered local suppliers and logistics providers across regions, so "send 200 liters of water to cluster 3" becomes an actionable order, not just a recommendation
- More mature analytics dashboard , deeper operational intelligence for command: trend lines across clusters, resource allocation tracking over time, historical comparison across disaster events, and exportable reports for post-disaster audits and BNPB submissions
Built With
- dart
- fastify
- figma
- flutter
- nextjs
- node.js
- postgresql
- shadcnui
- tailwindcss
- tensorflow
- typescript


Log in or sign up for Devpost to join the conversation.