Inspiration
Every season, clubs pay enormous salaries to pitchers who are sitting on the injured list. Analysts have called arm injuries the problem sabermetrics still can't solve. In practice, most staffs, broadcasters and fans fall back on one rule of thumb: worry when a pitcher's fastball is down 1.5 mph.
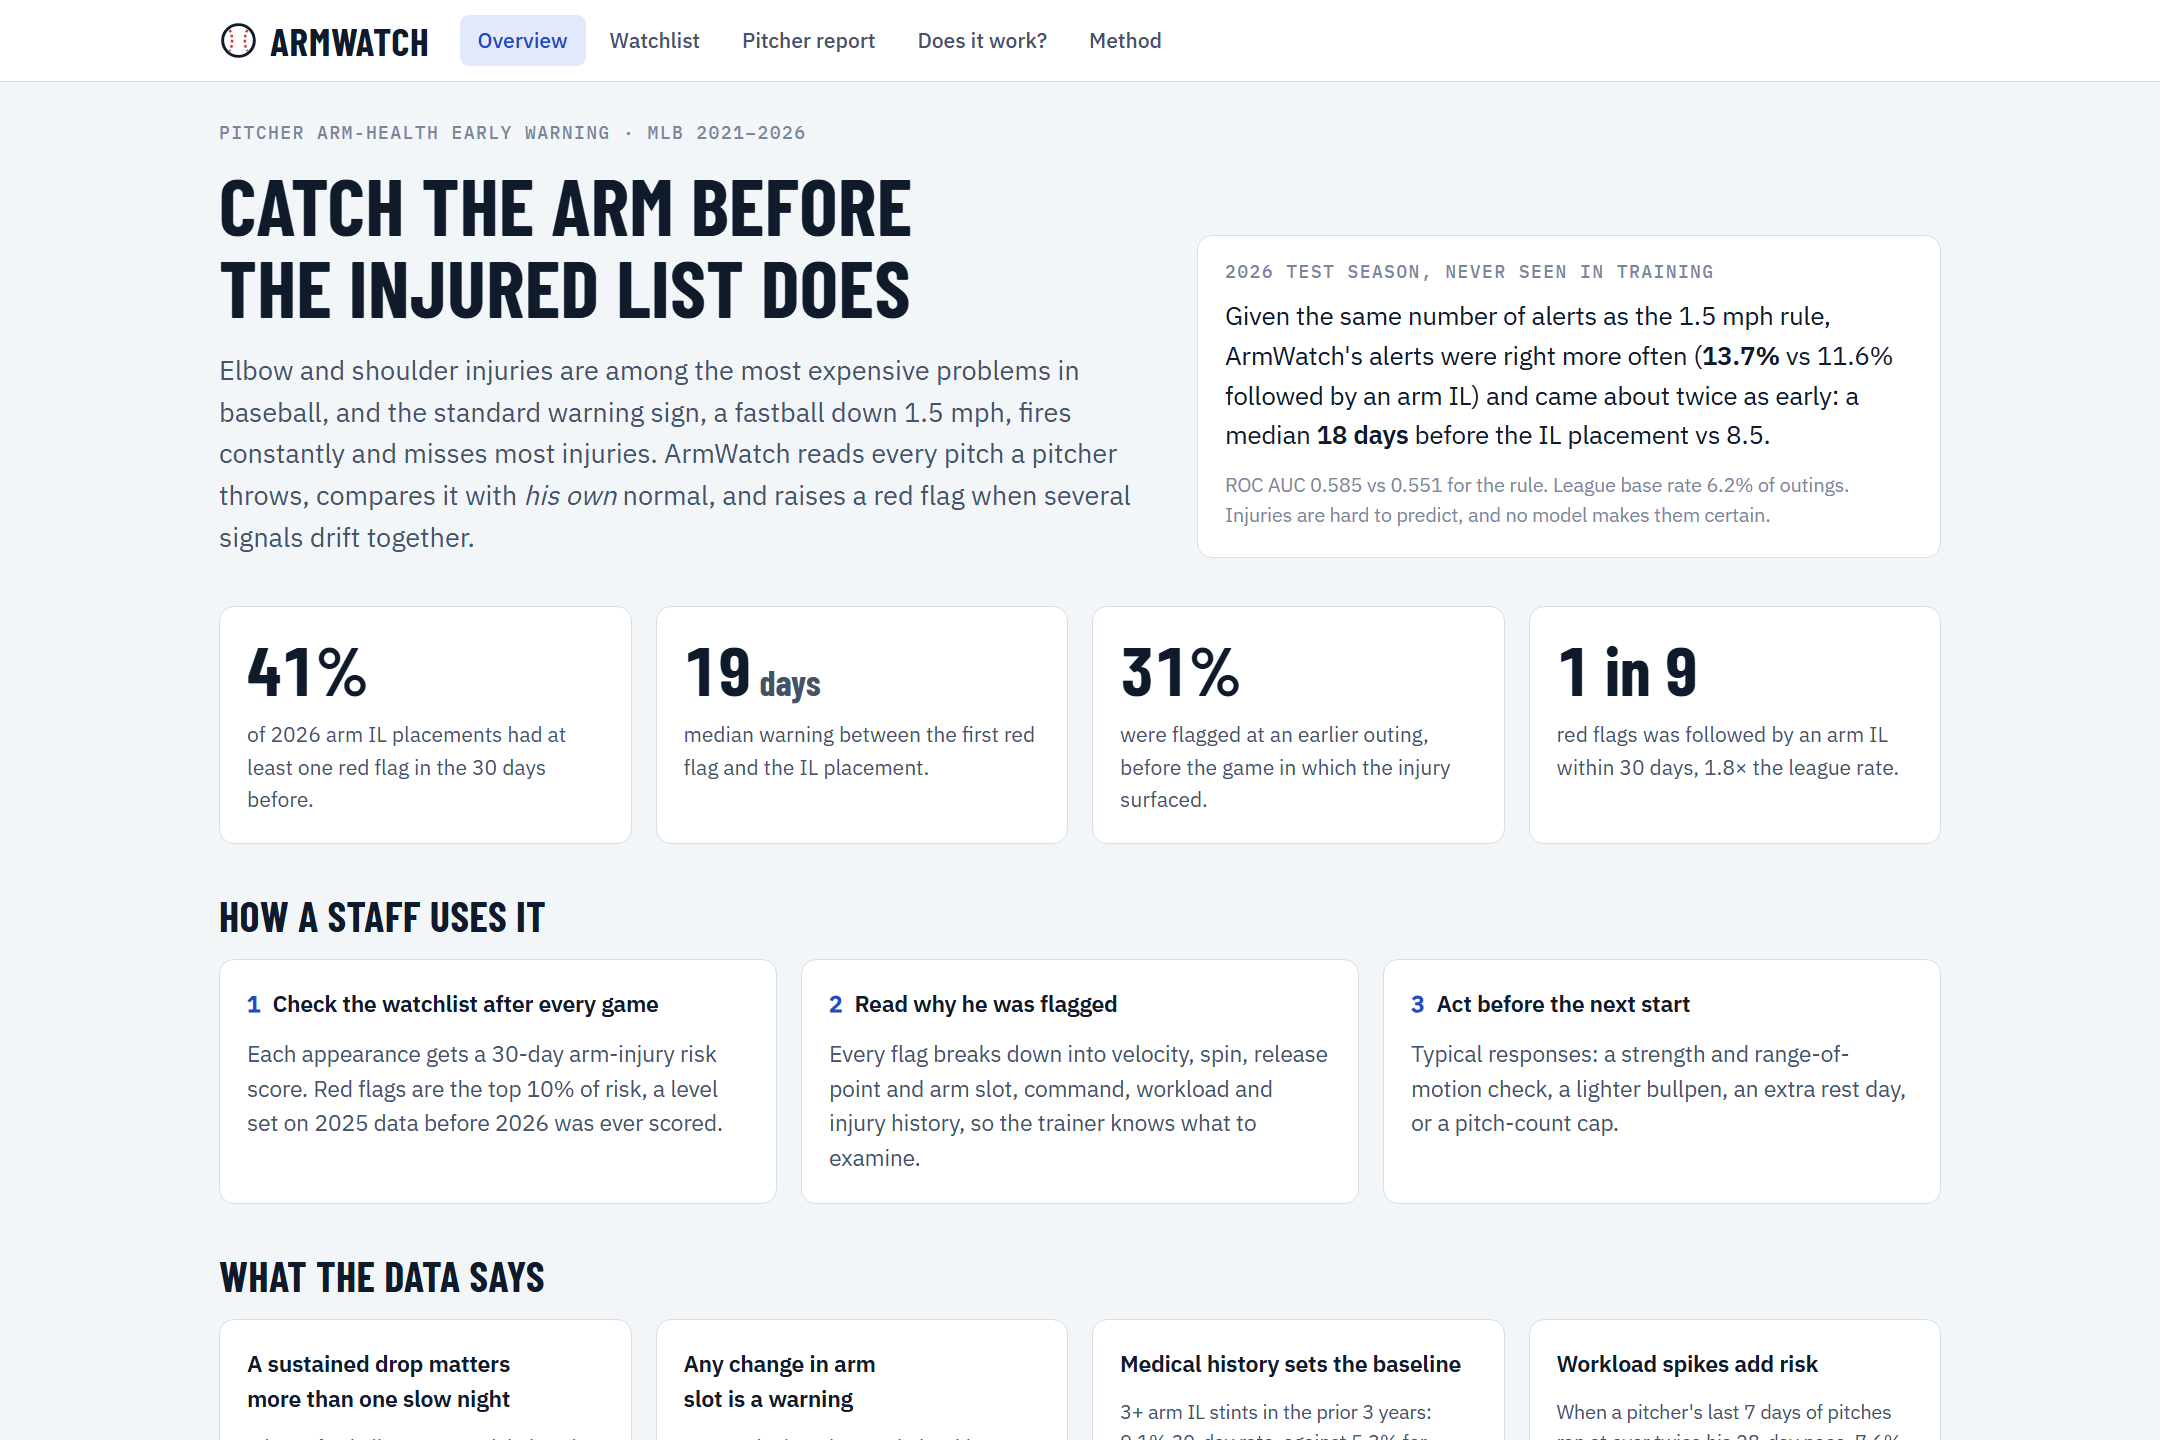
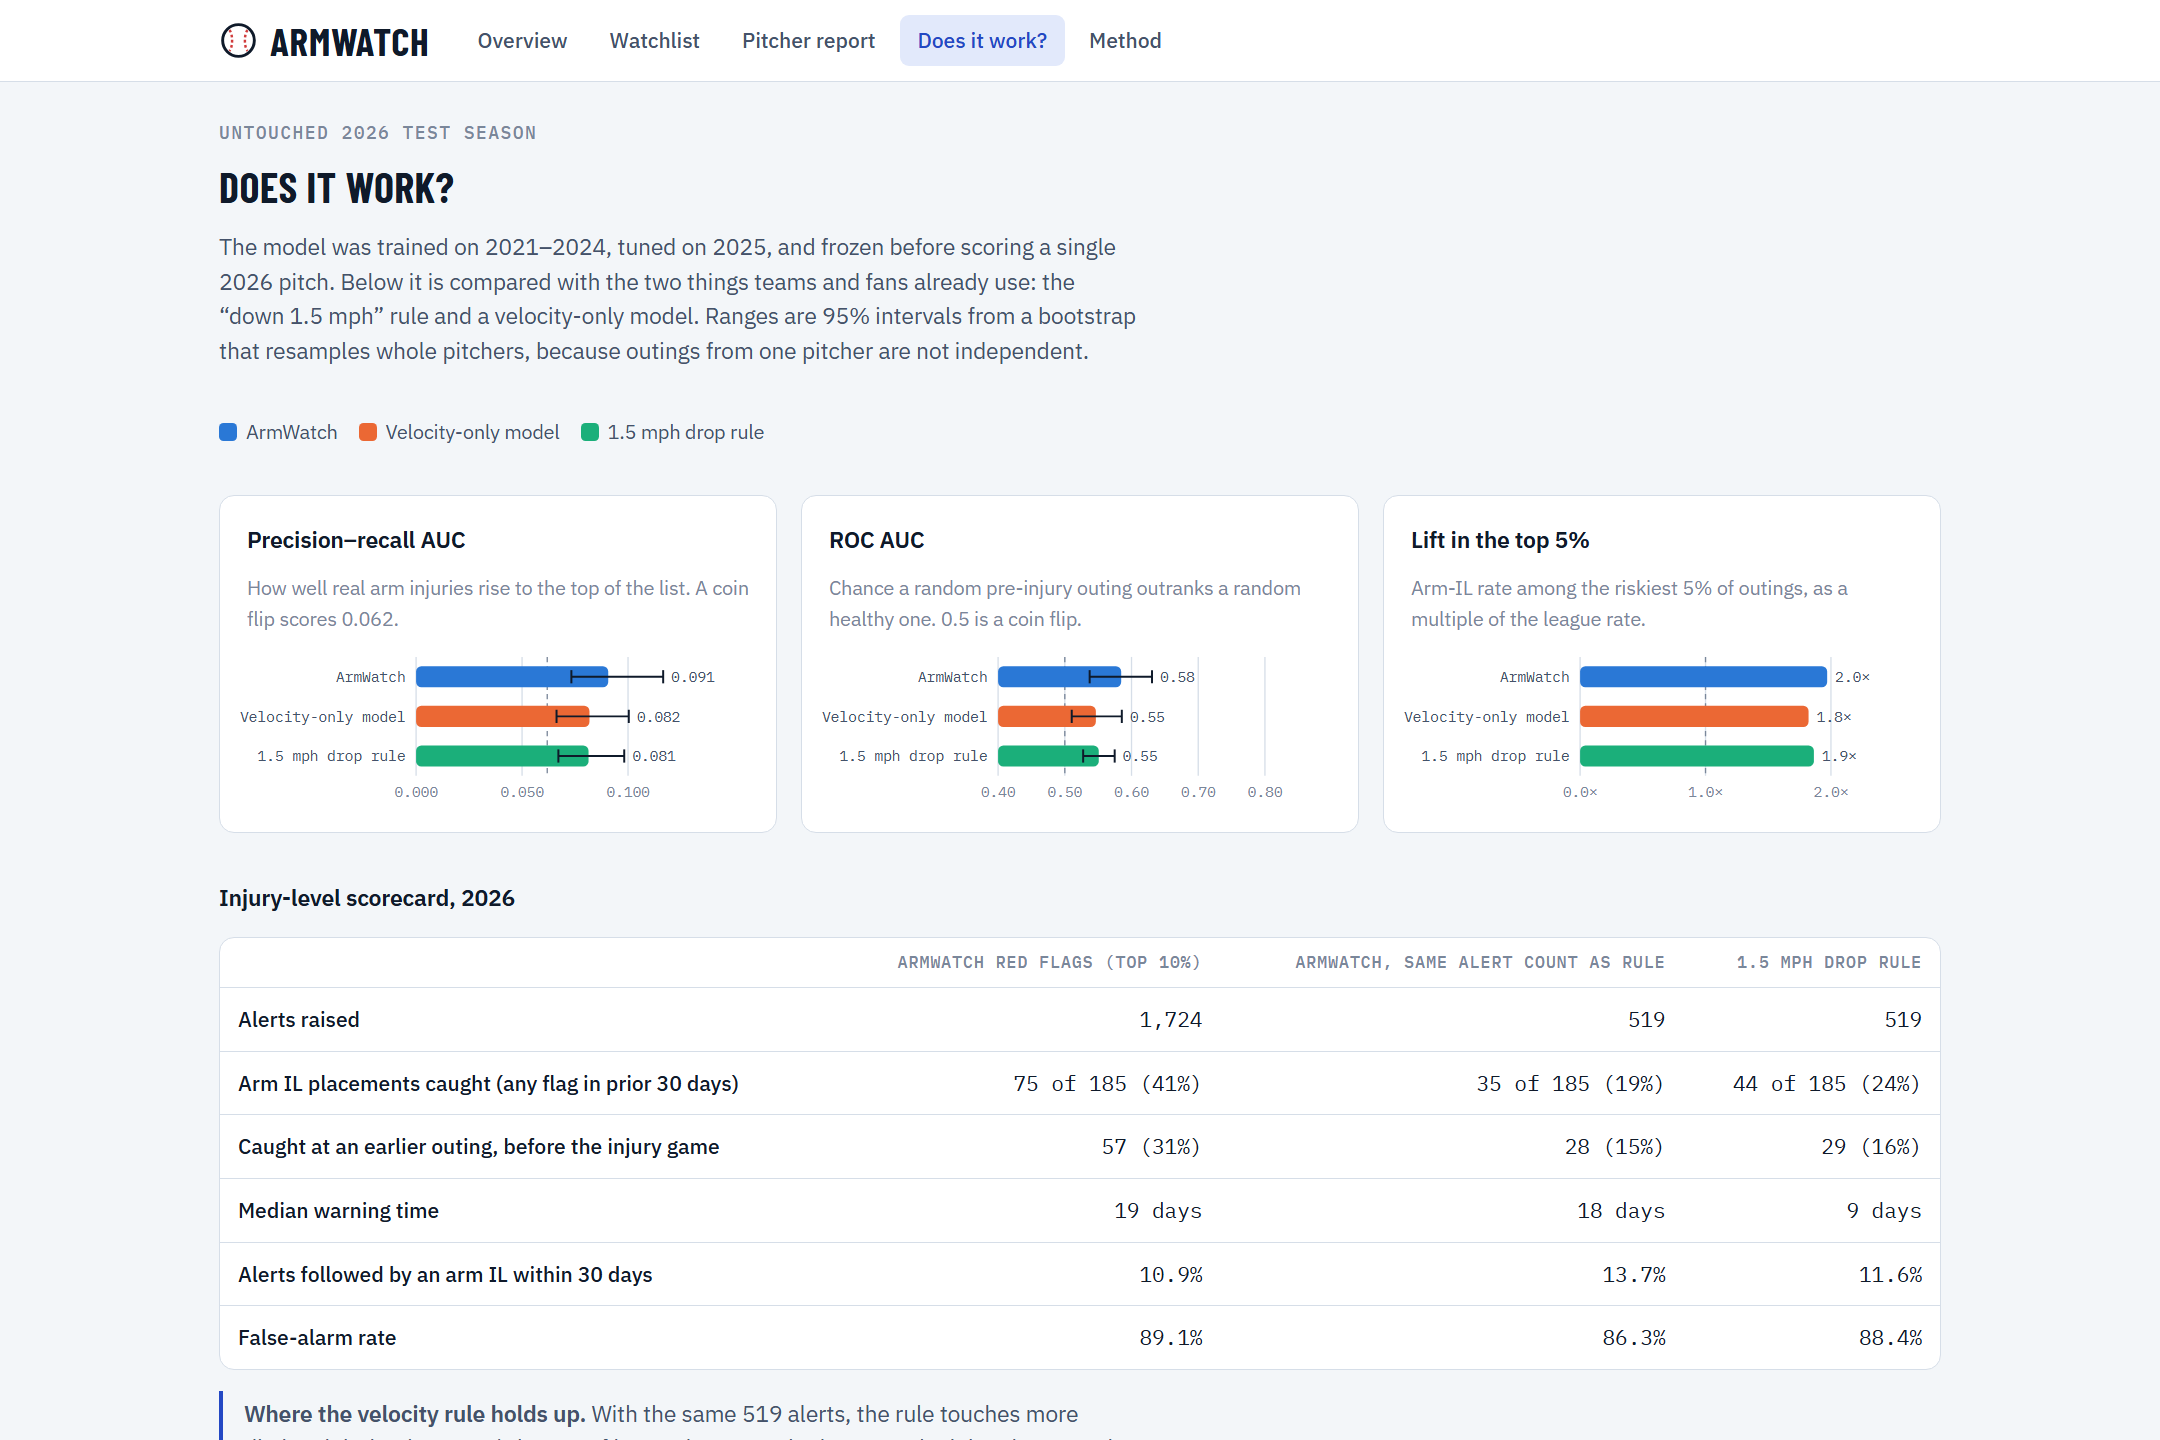
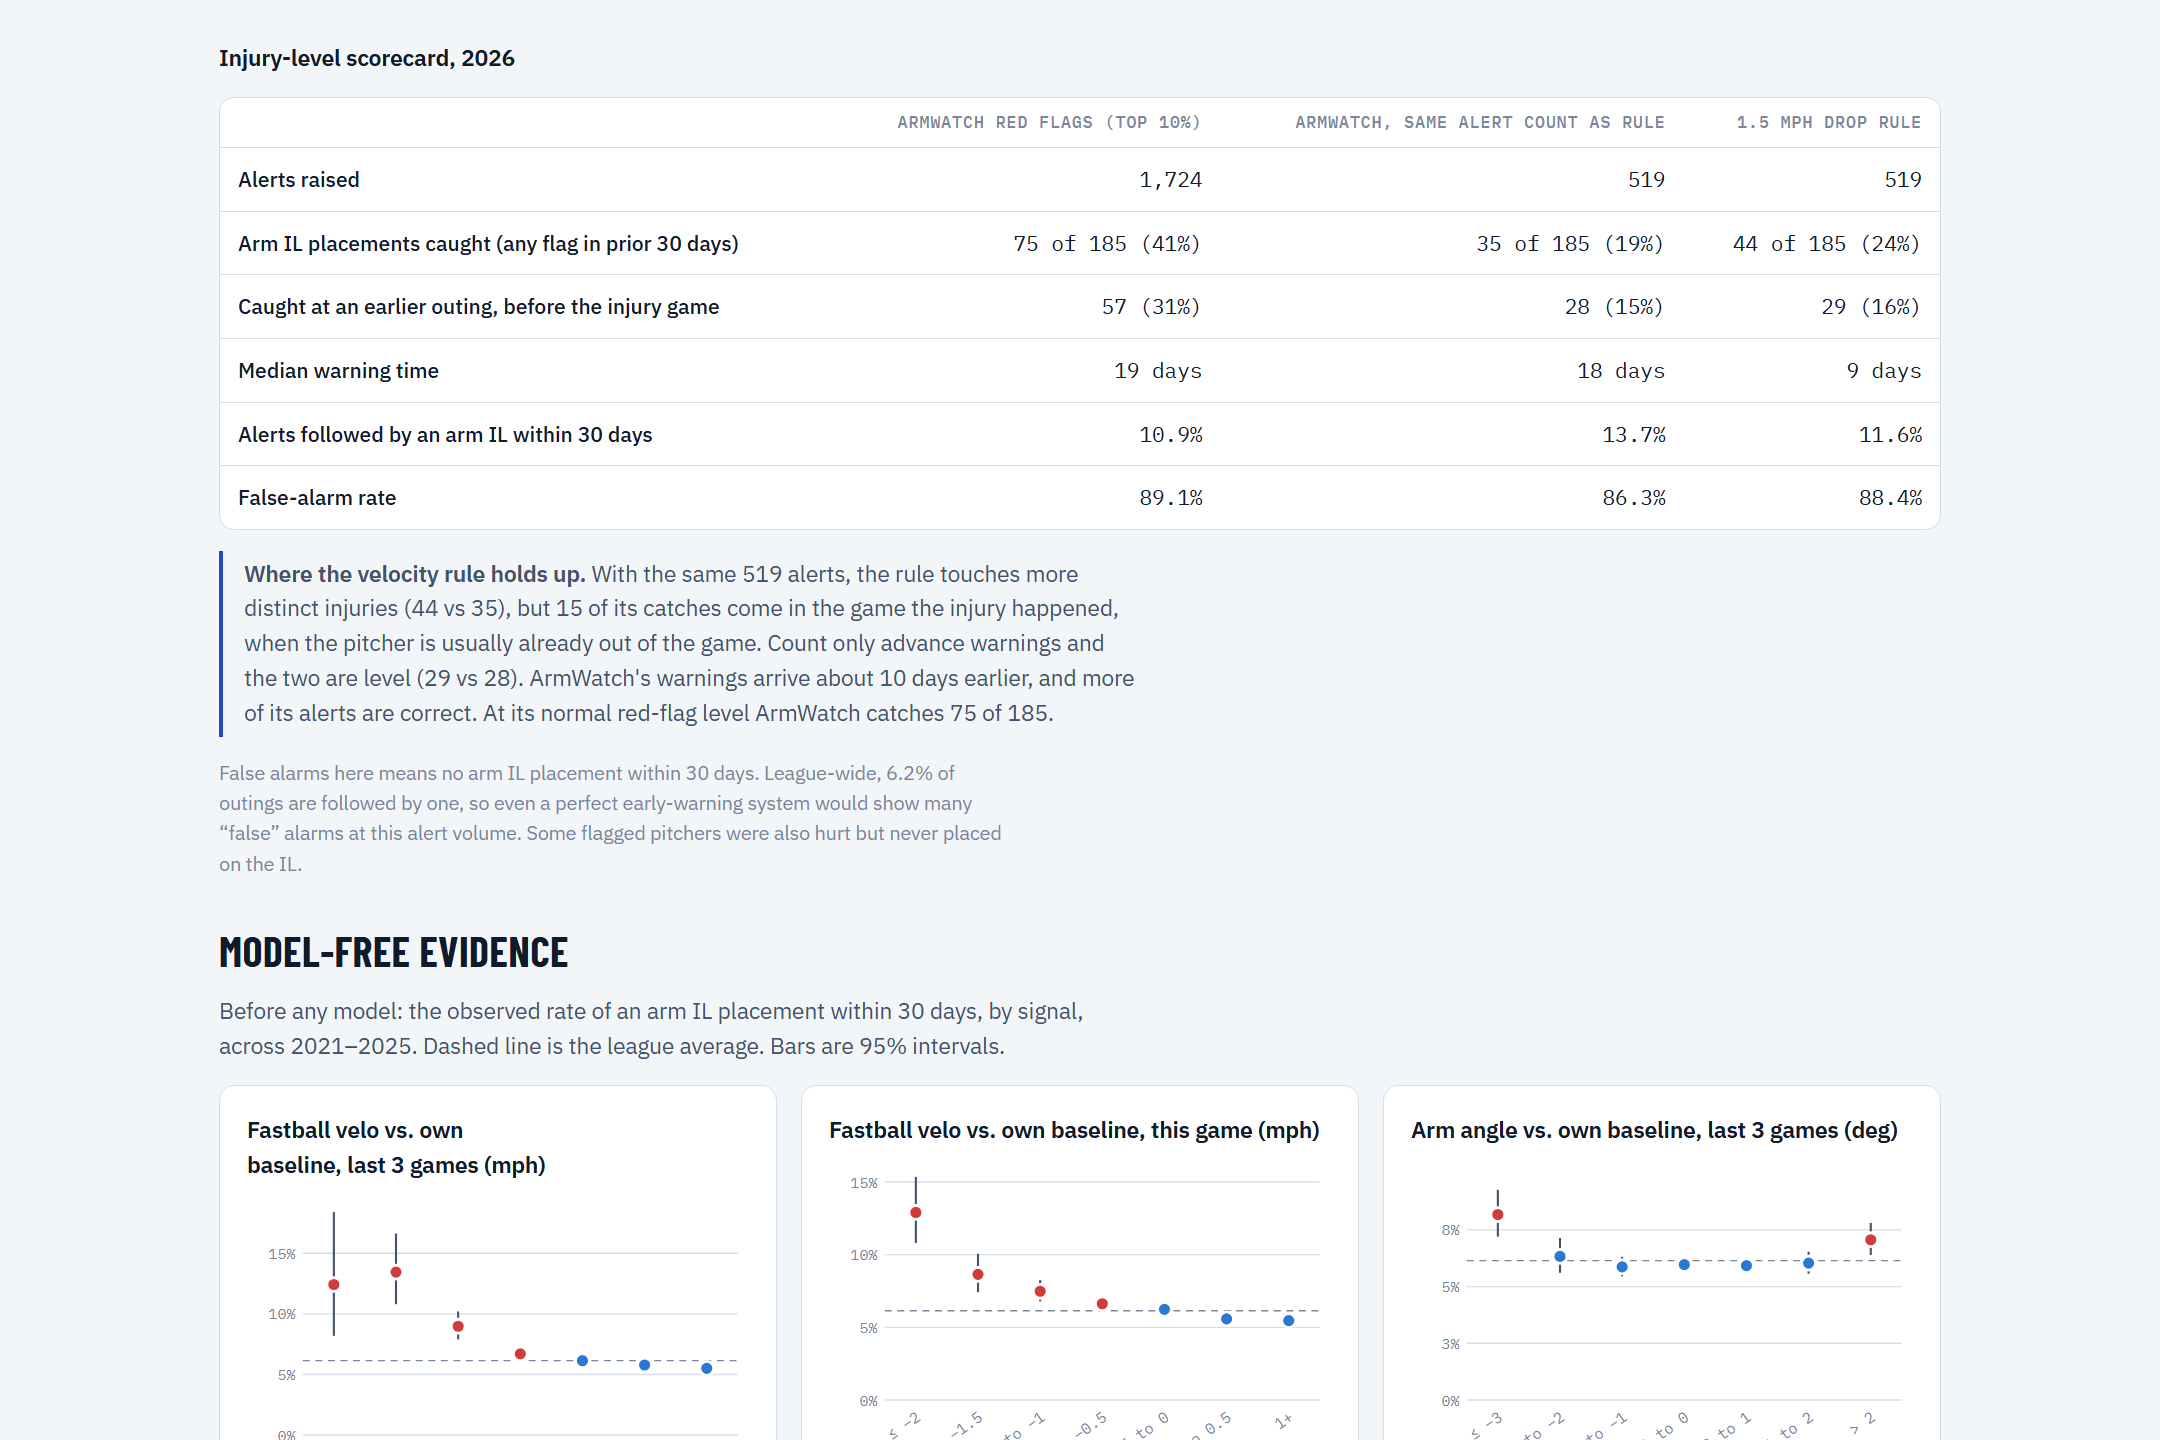
We tested that rule on the 2026 season. It fired 519 times, and 88% of those alerts were not followed by an arm injury. When it did catch one, the median warning was only 8.5 days, and a third of its catches came in the game where the pitcher got hurt, when it's too late to help. We wanted a tool a pitching coach or athletic trainer could open after every game and trust.
What it does
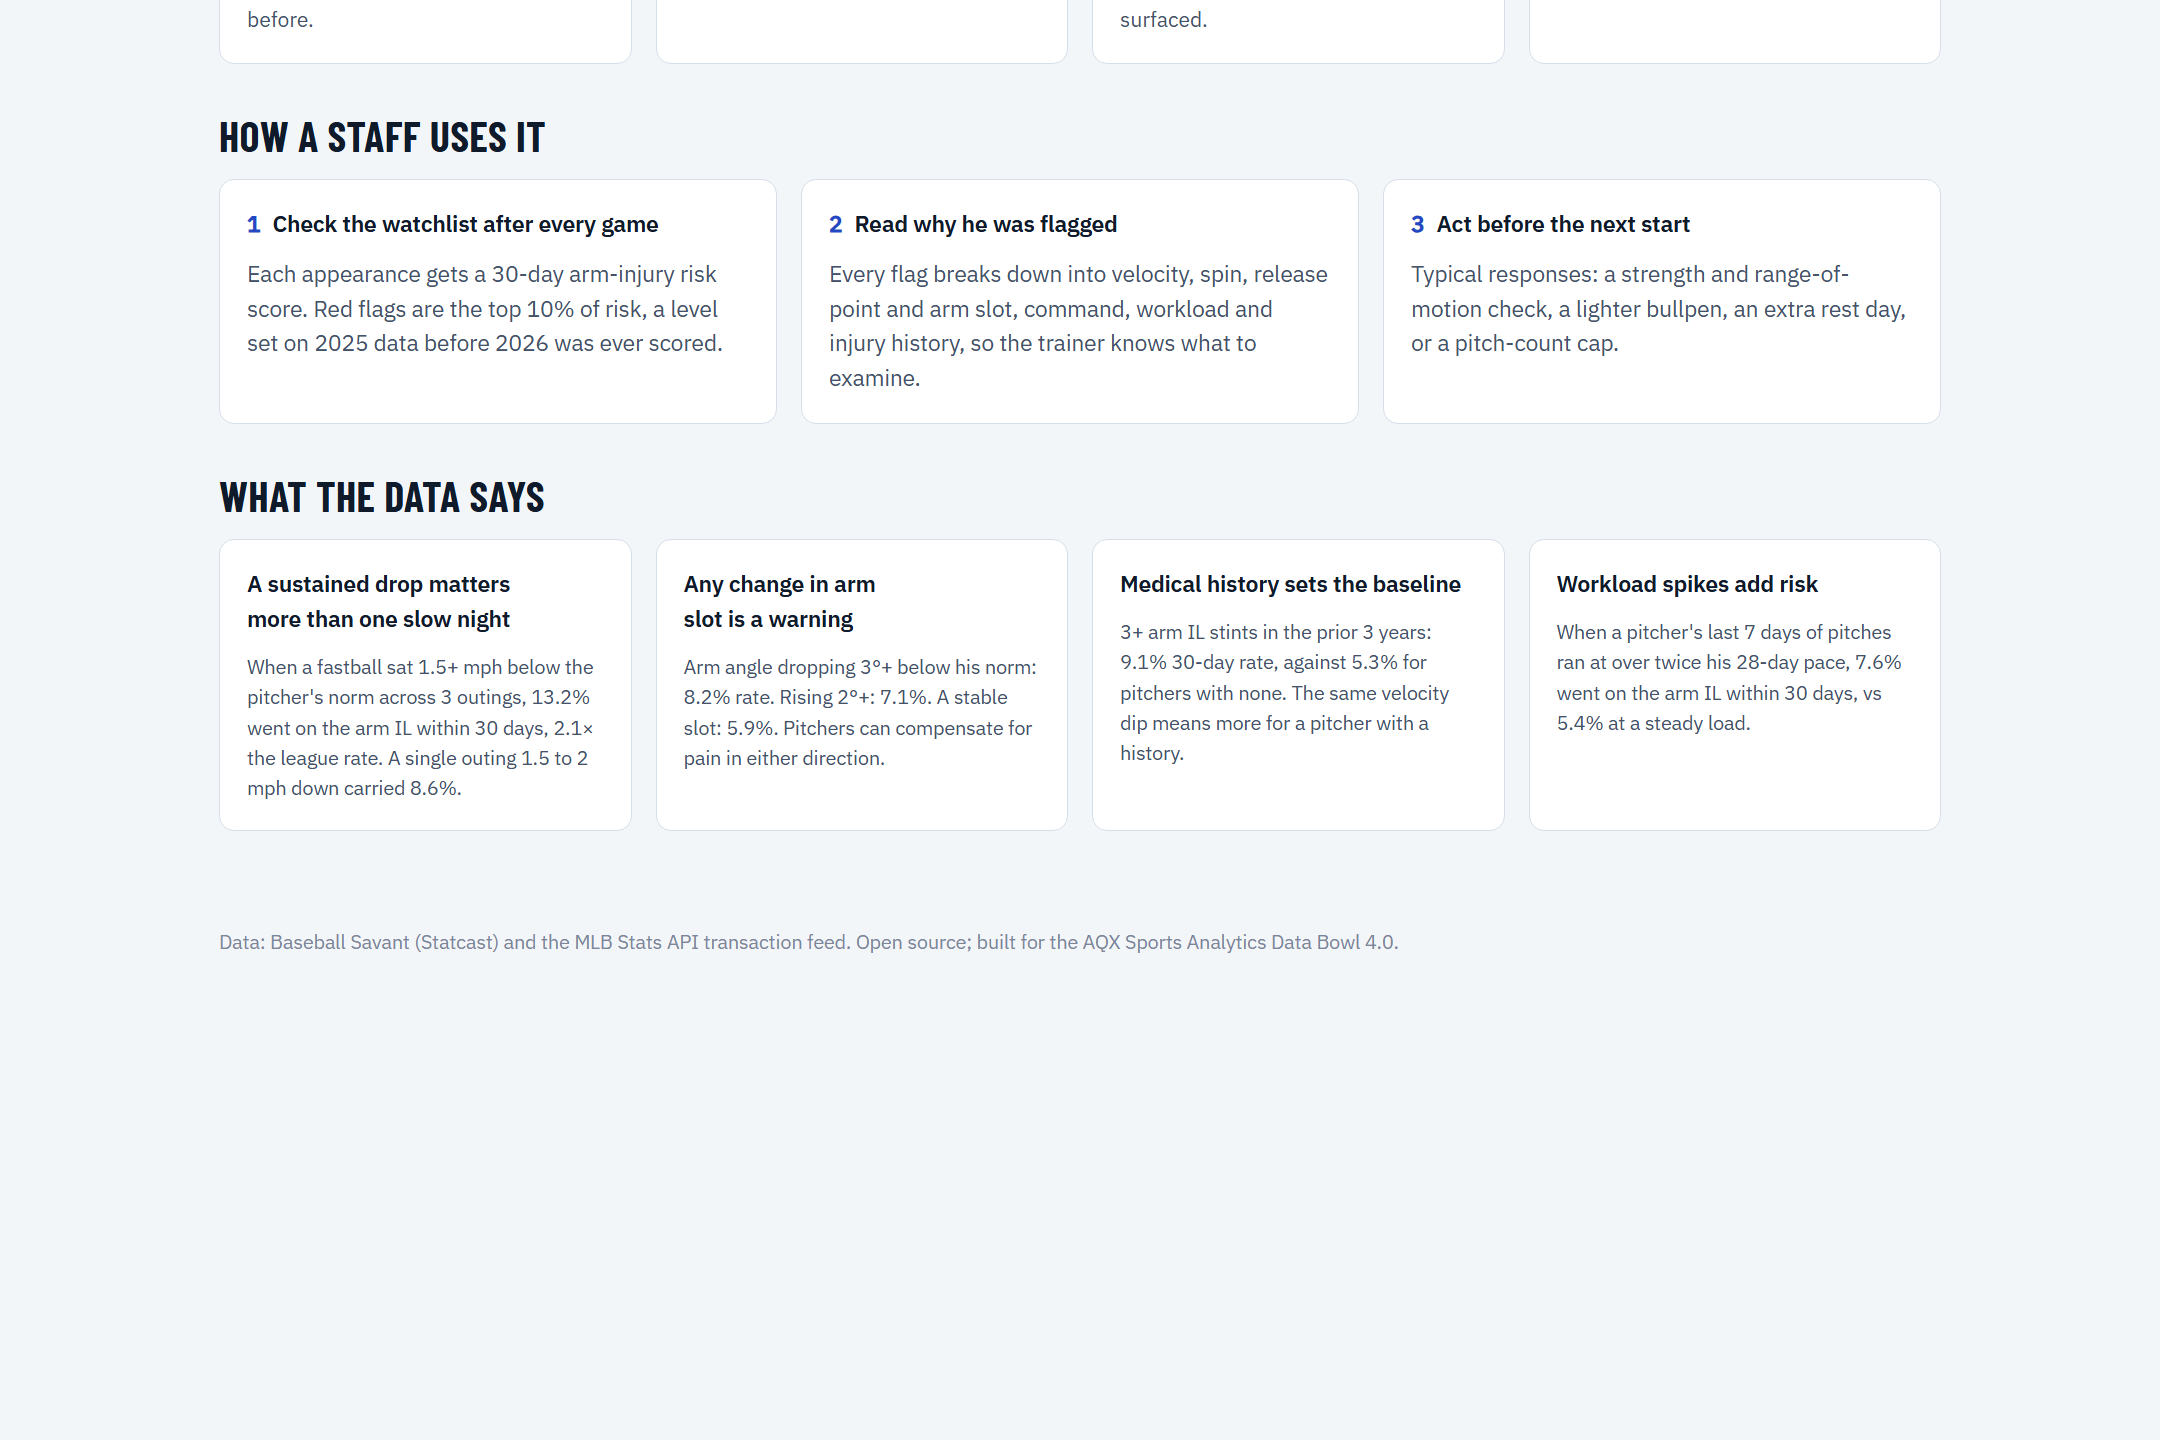
ArmWatch scores every MLB pitching appearance for the probability of an elbow or shoulder injured-list placement in the next 30 days, and flags the riskiest 10%.
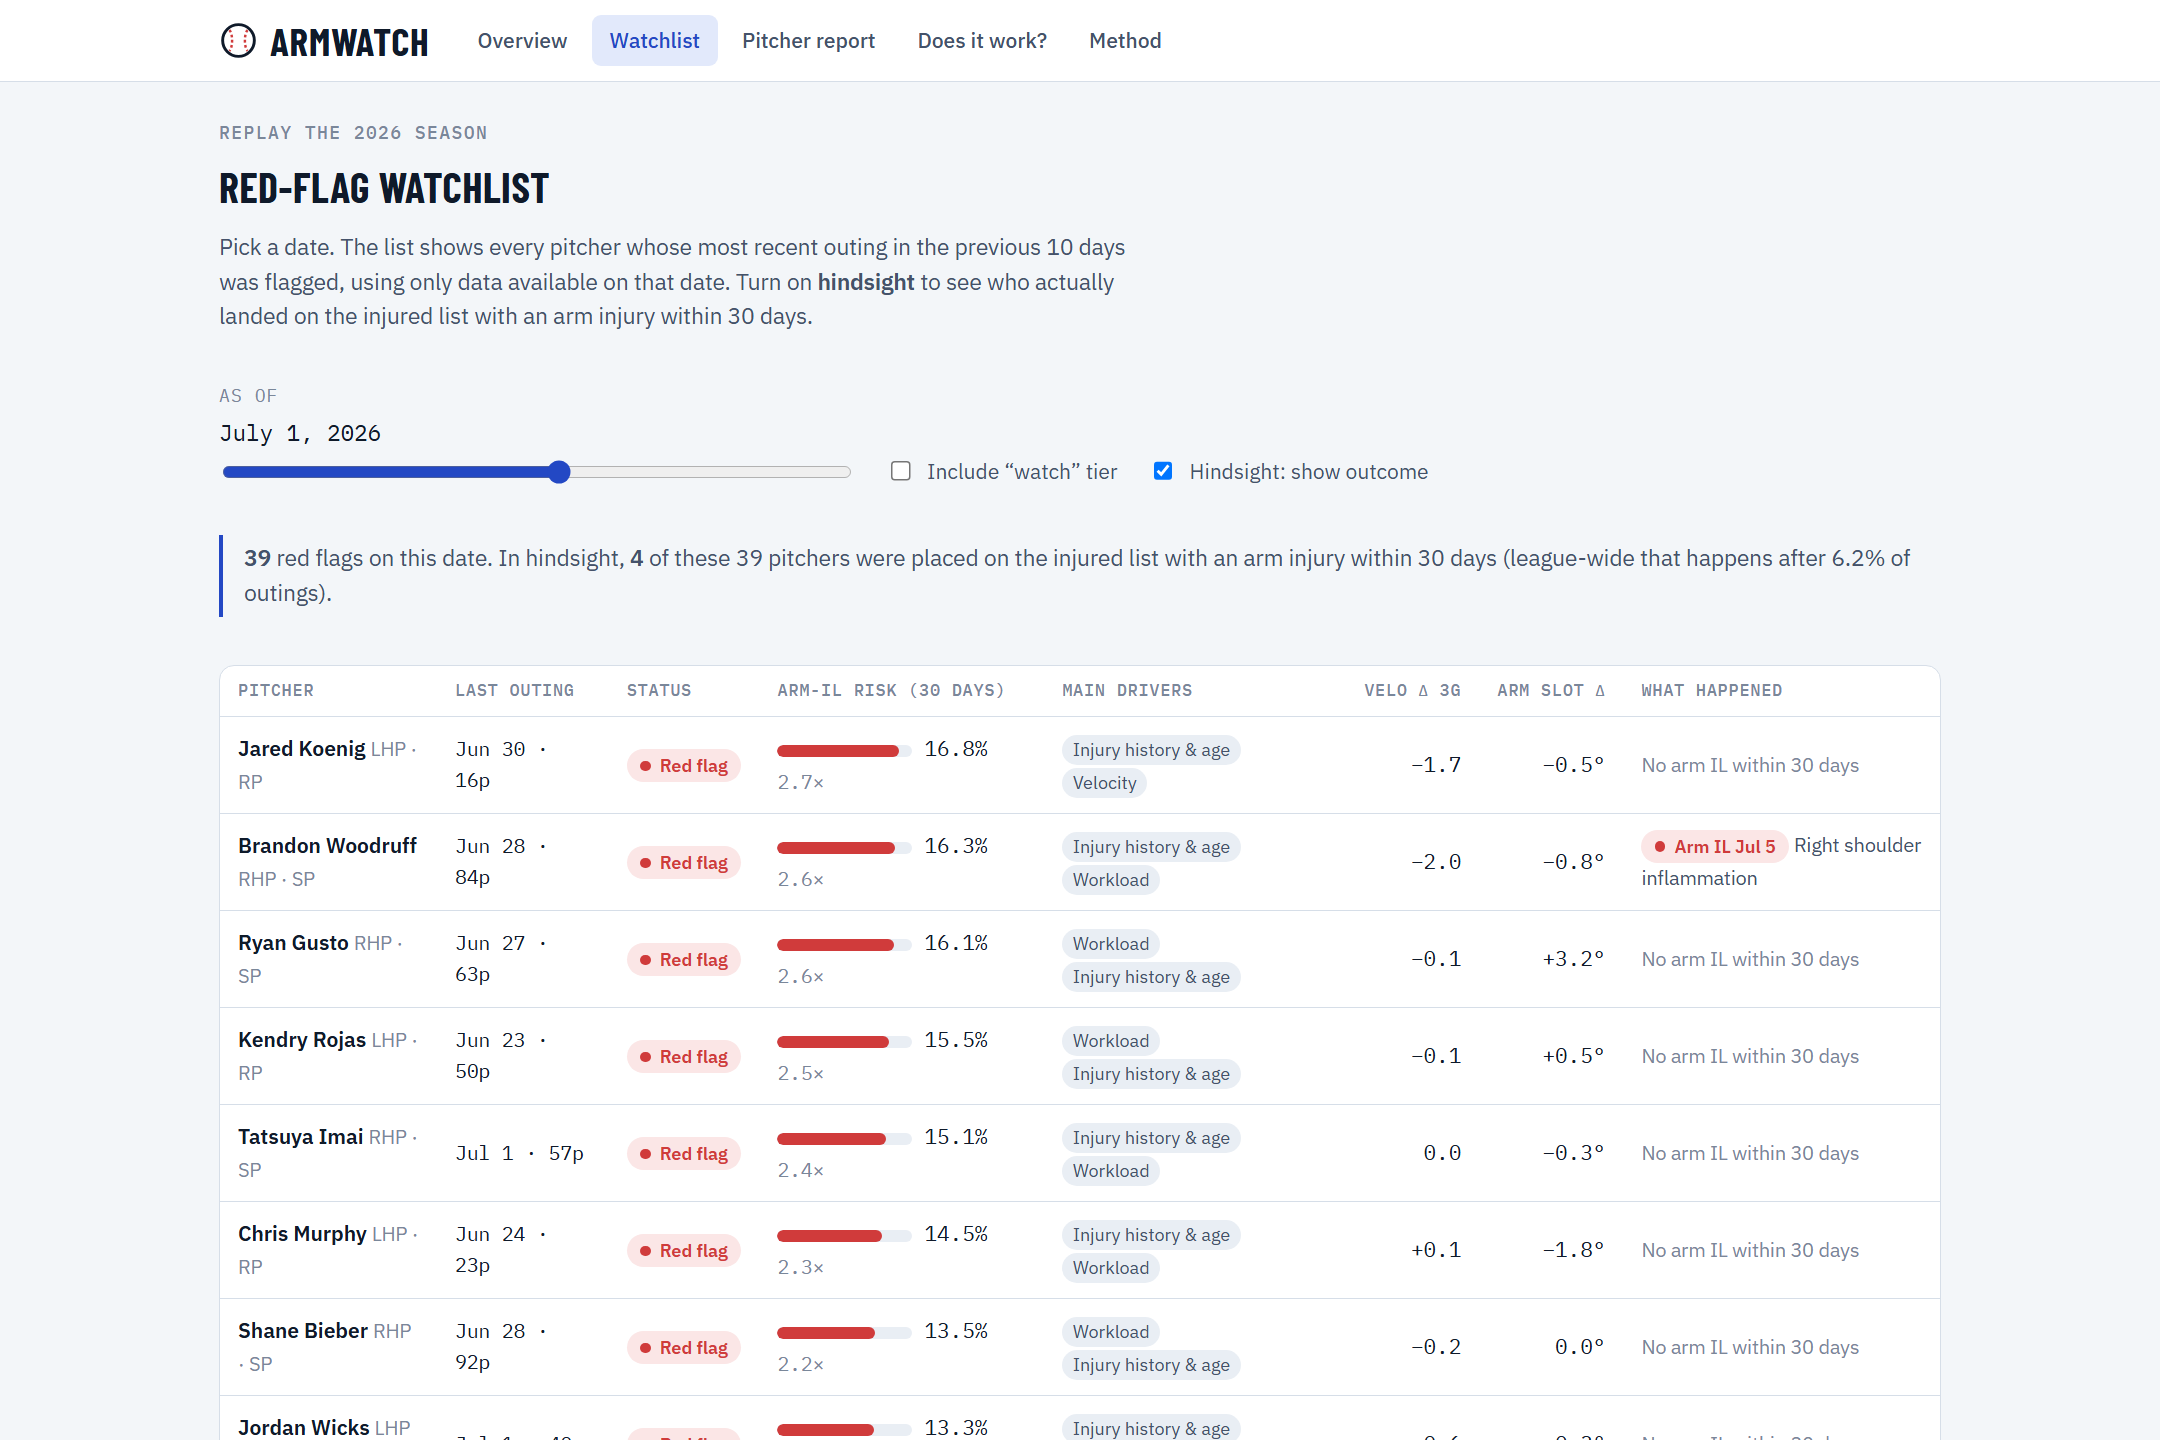
- Watchlist you can replay. Pick any date in 2026 and see who was flagged using only the data available that day. Hindsight mode then shows who actually went on the IL.
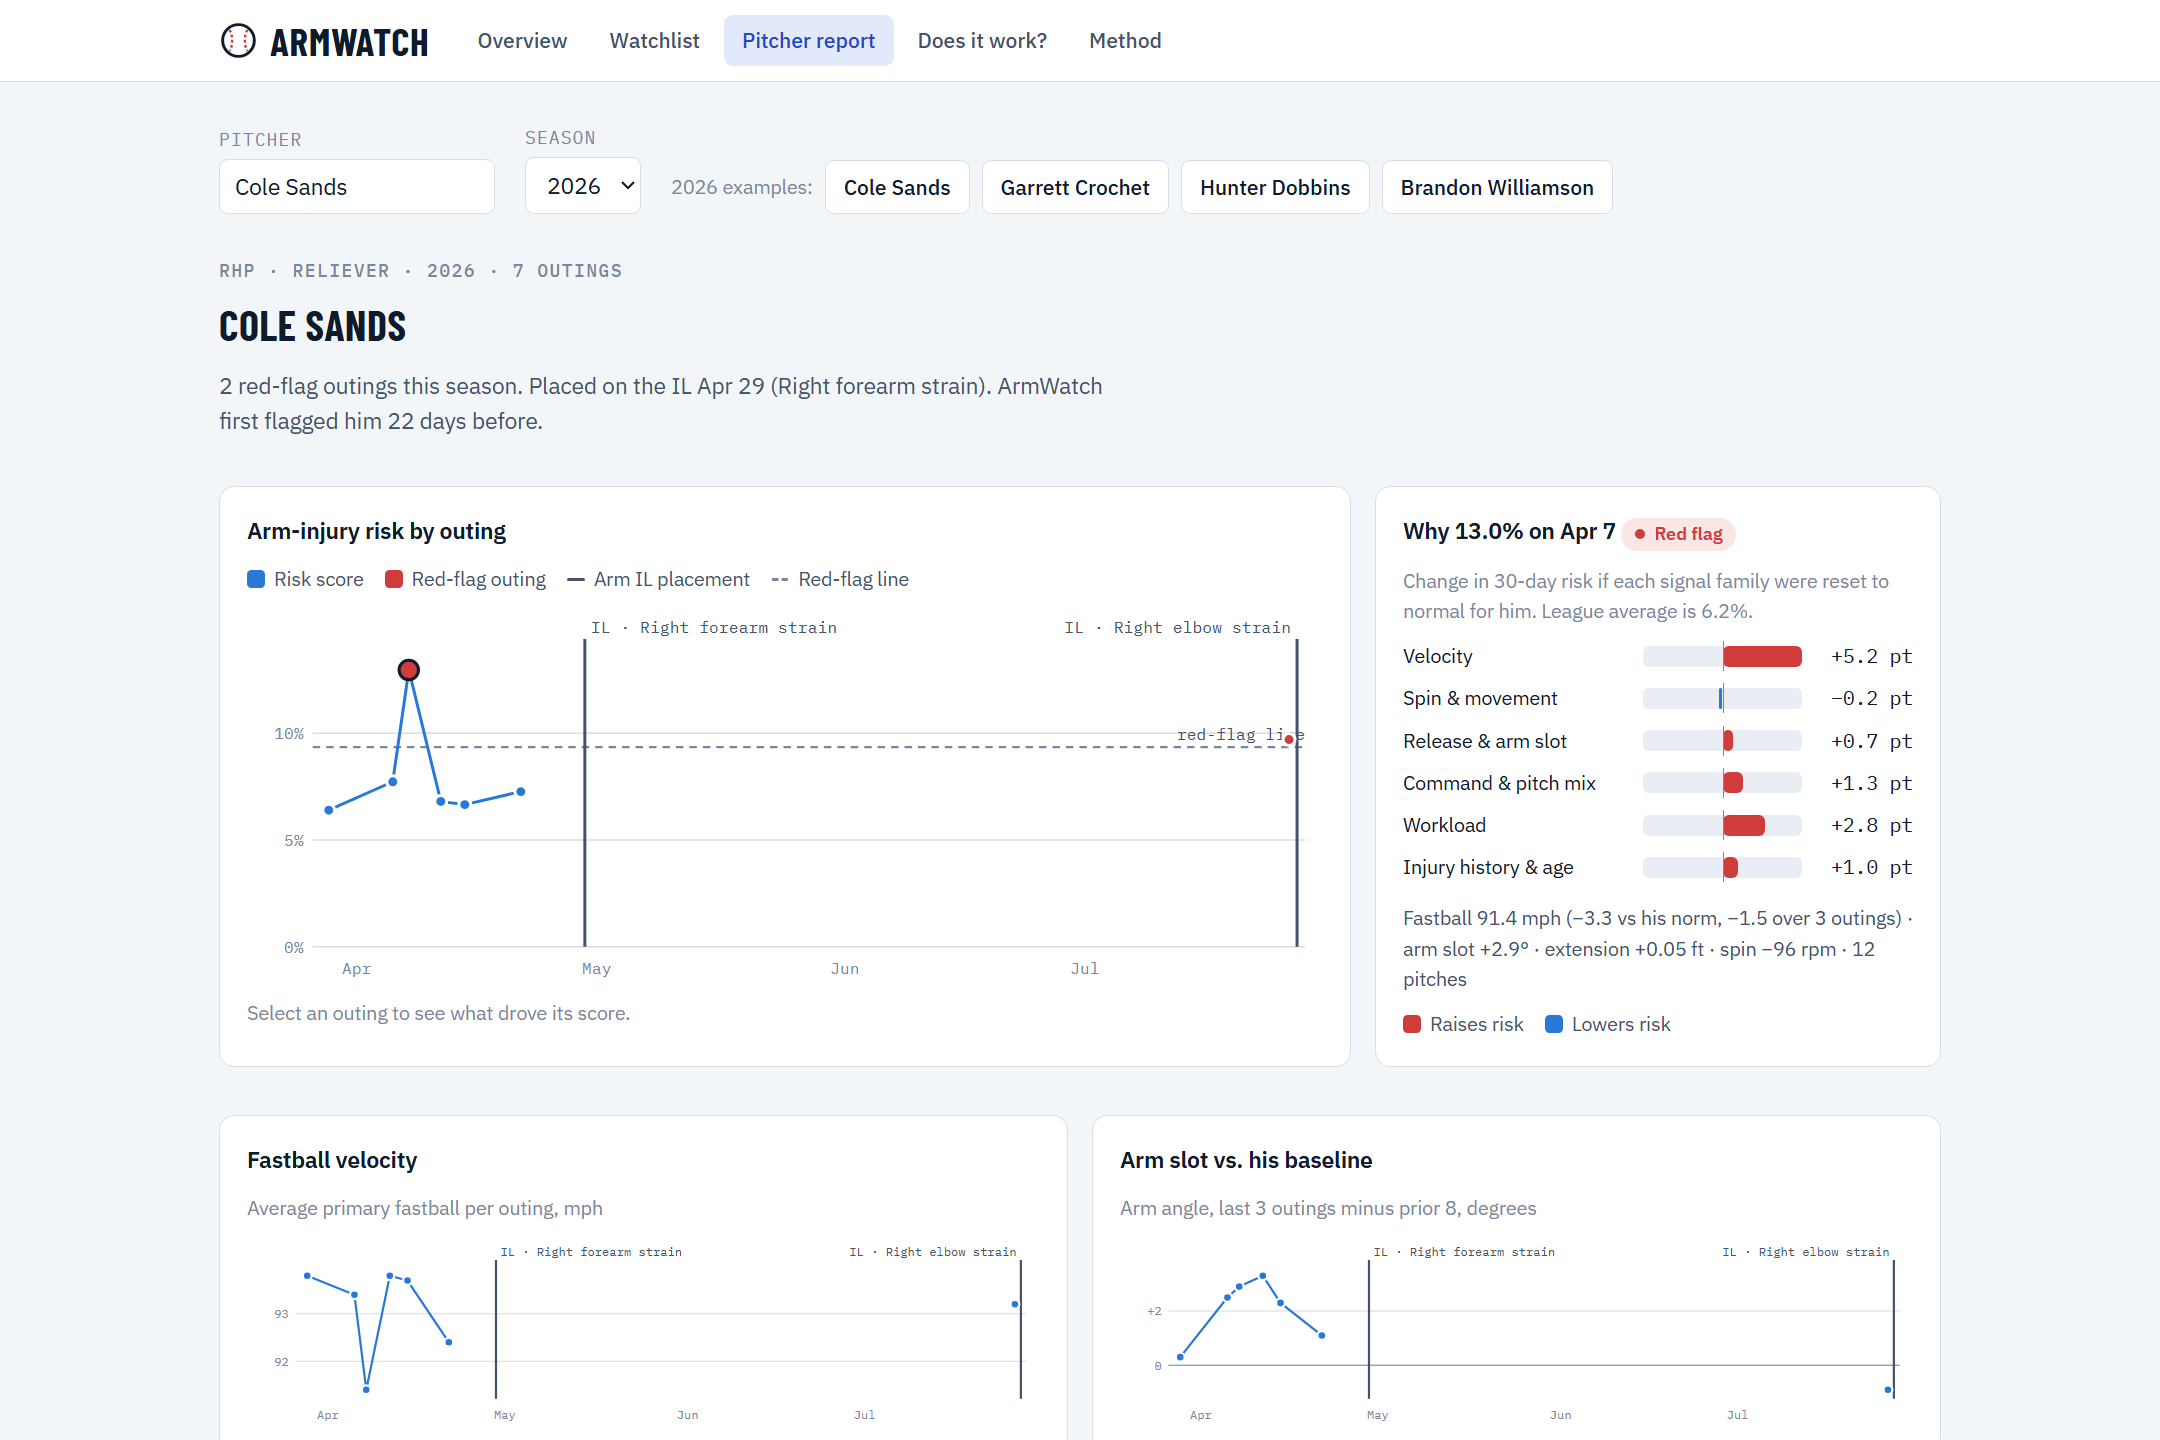
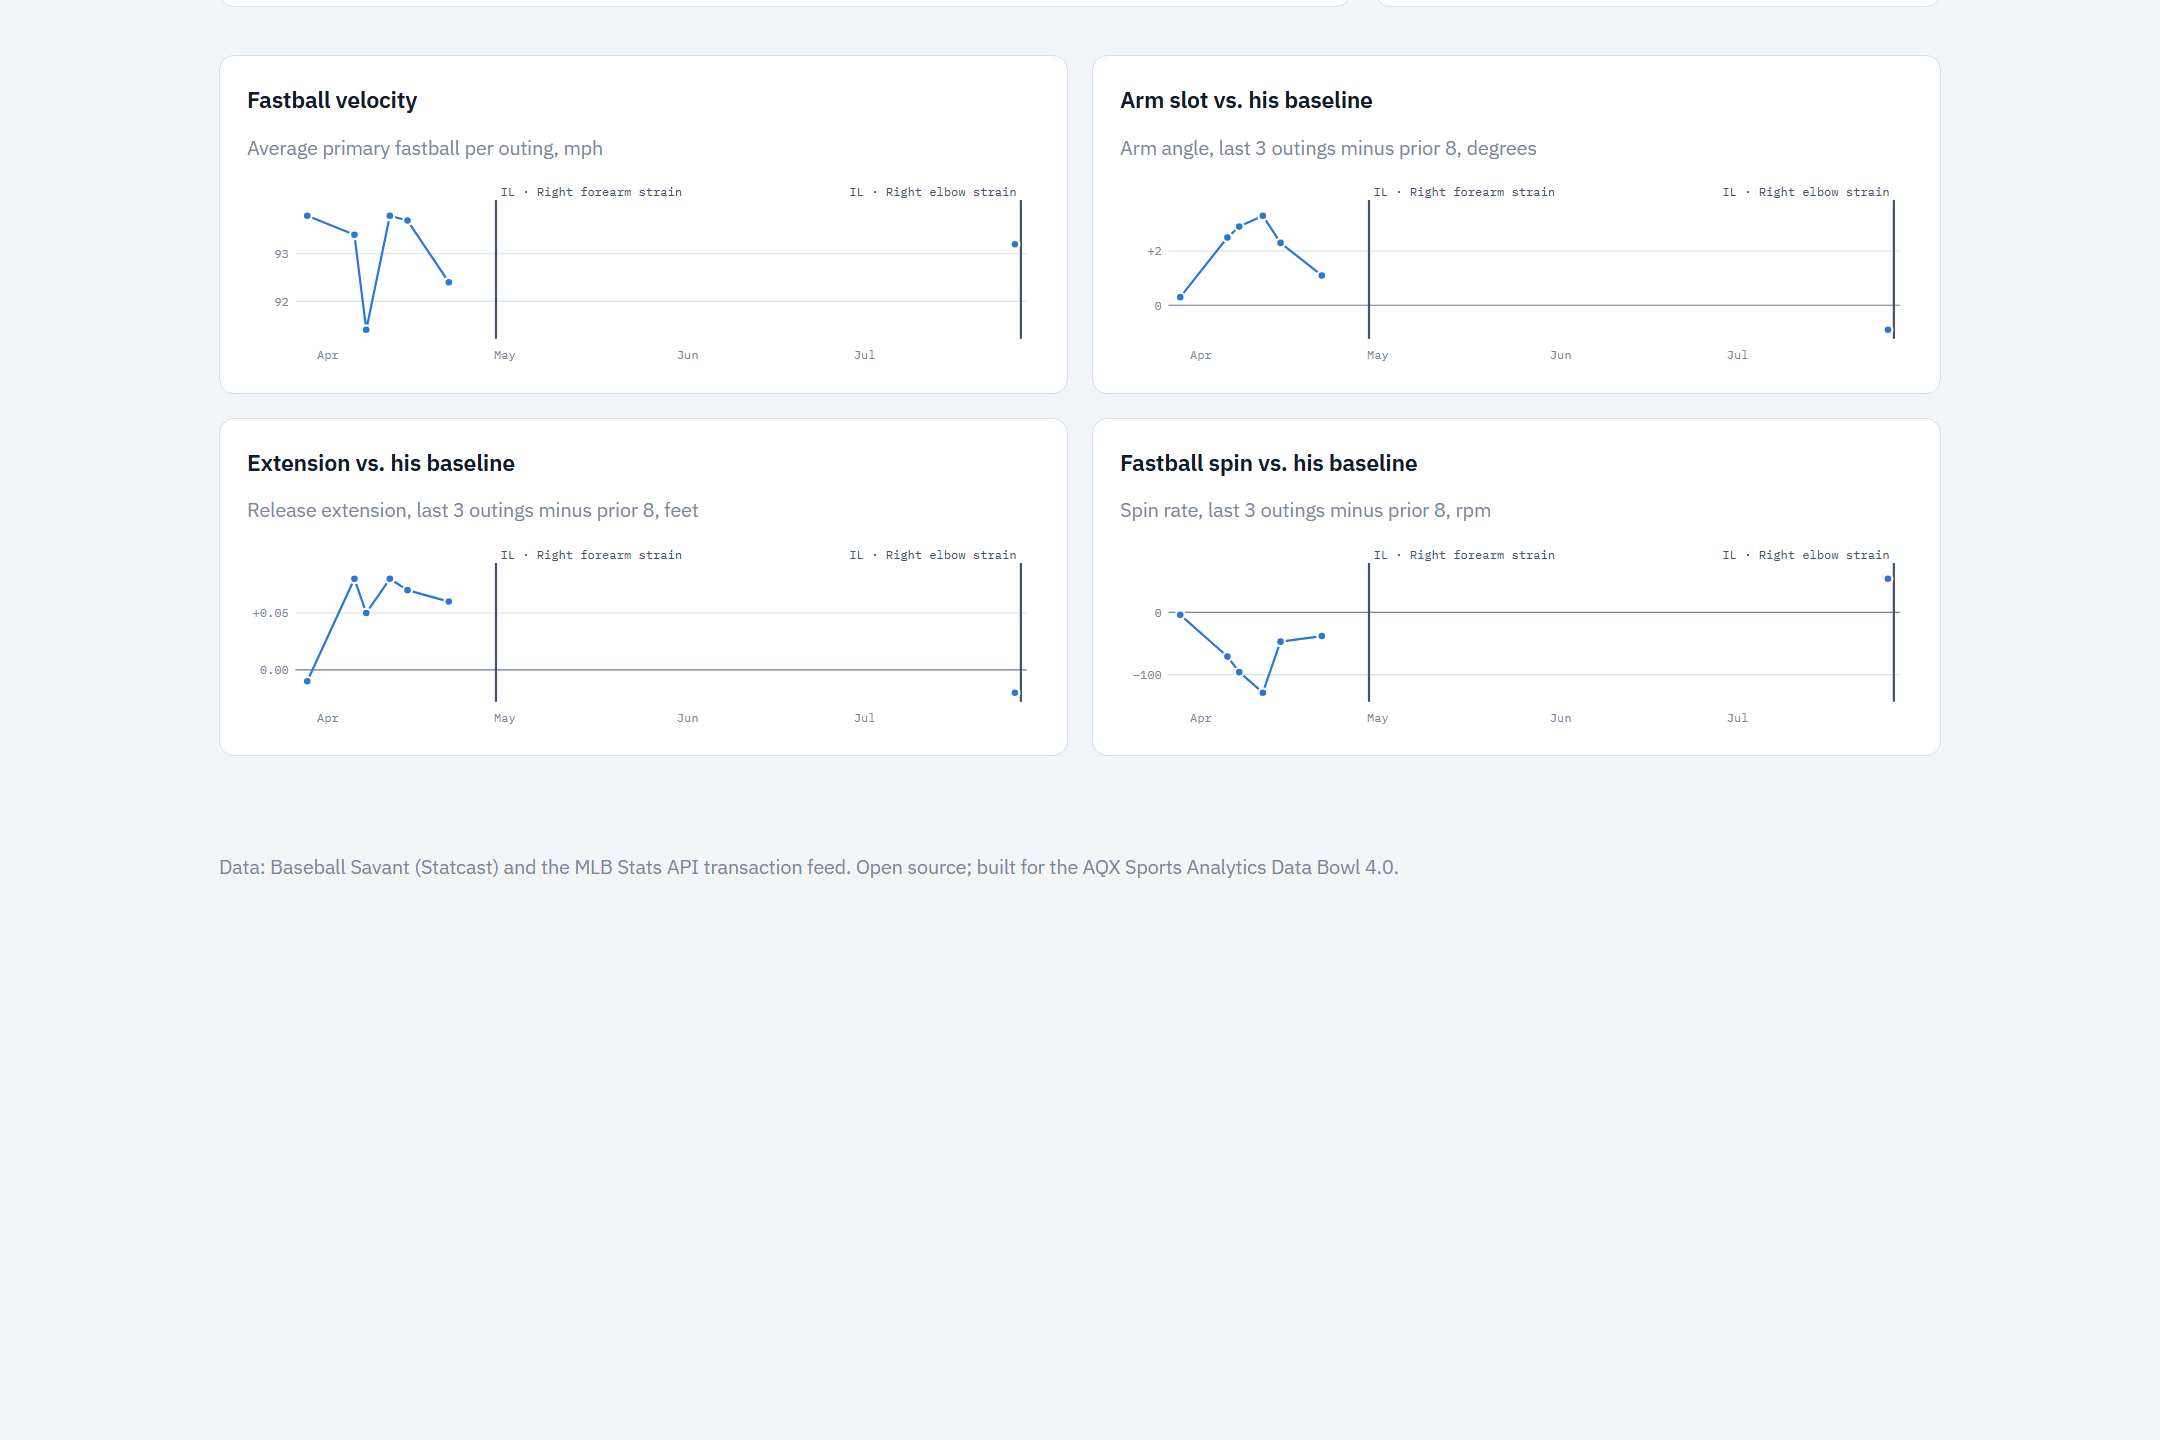
- Pitcher report. Risk by outing with IL stints marked, velocity, arm-slot, extension and spin trends against his own baseline, and a breakdown of what drove any score.
- Validation page. Shows exactly how ArmWatch compares with the 1.5 mph rule, including where the rule holds up.
How we built it
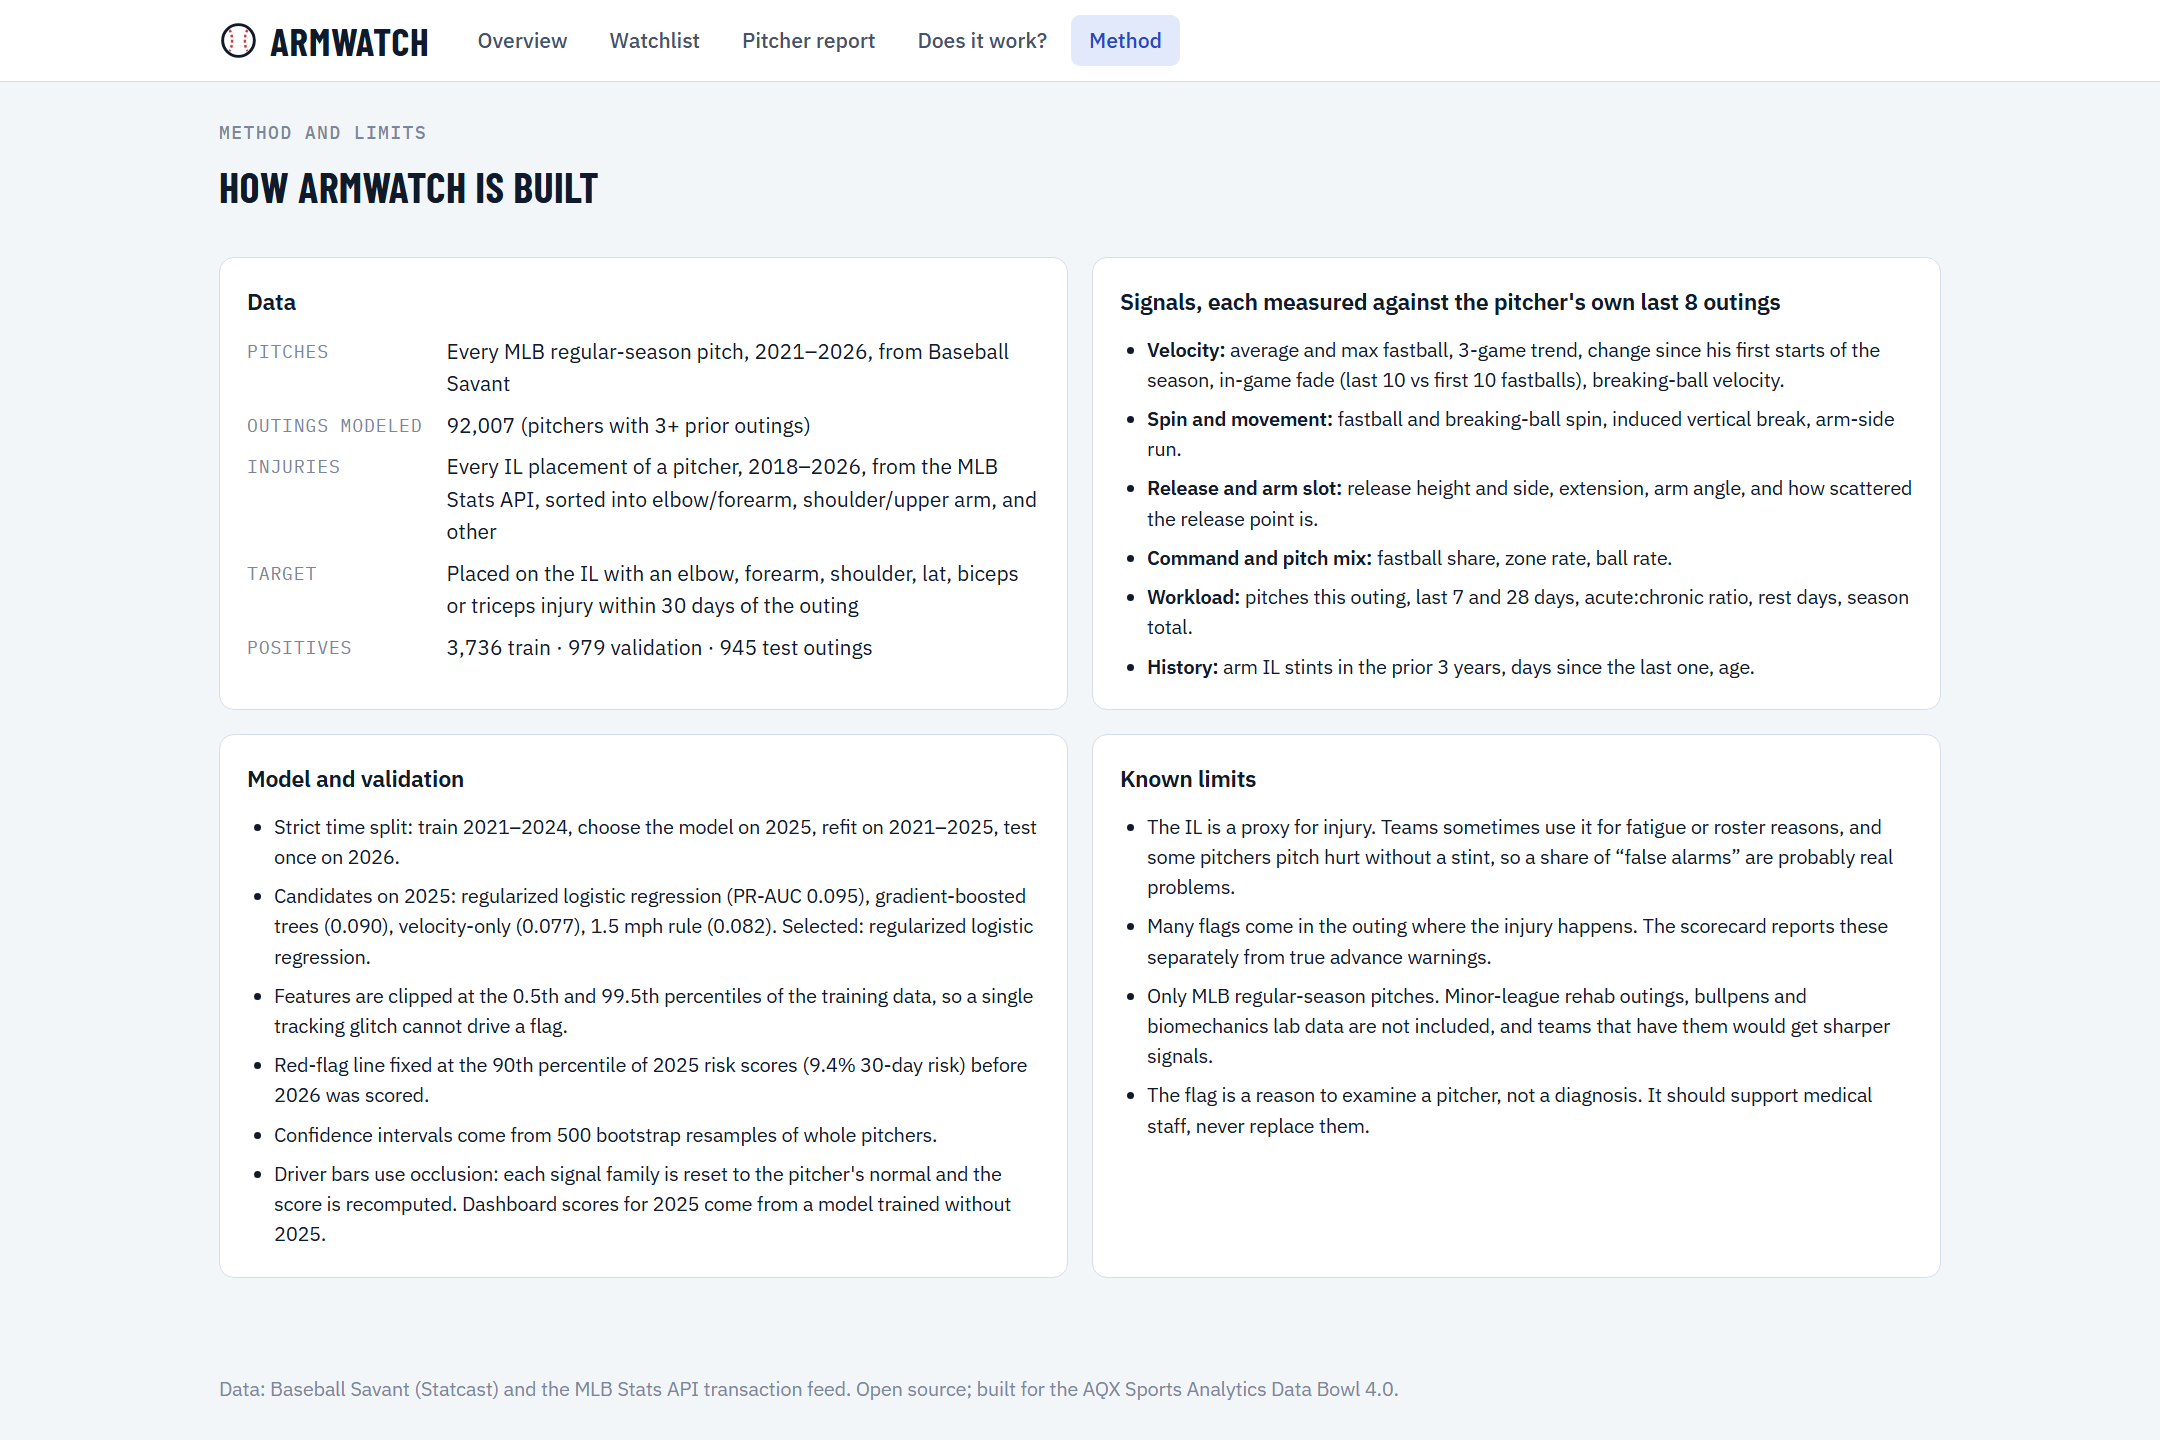
Data. We used all 4,284,433 regular-season pitches from 2021–2026 (Baseball Savant Statcast) and every pitcher IL placement from 2018–2026 (MLB Stats API). Each placement's injury text was sorted into elbow/forearm, shoulder/upper arm and other, giving 92,007 modeled outings.
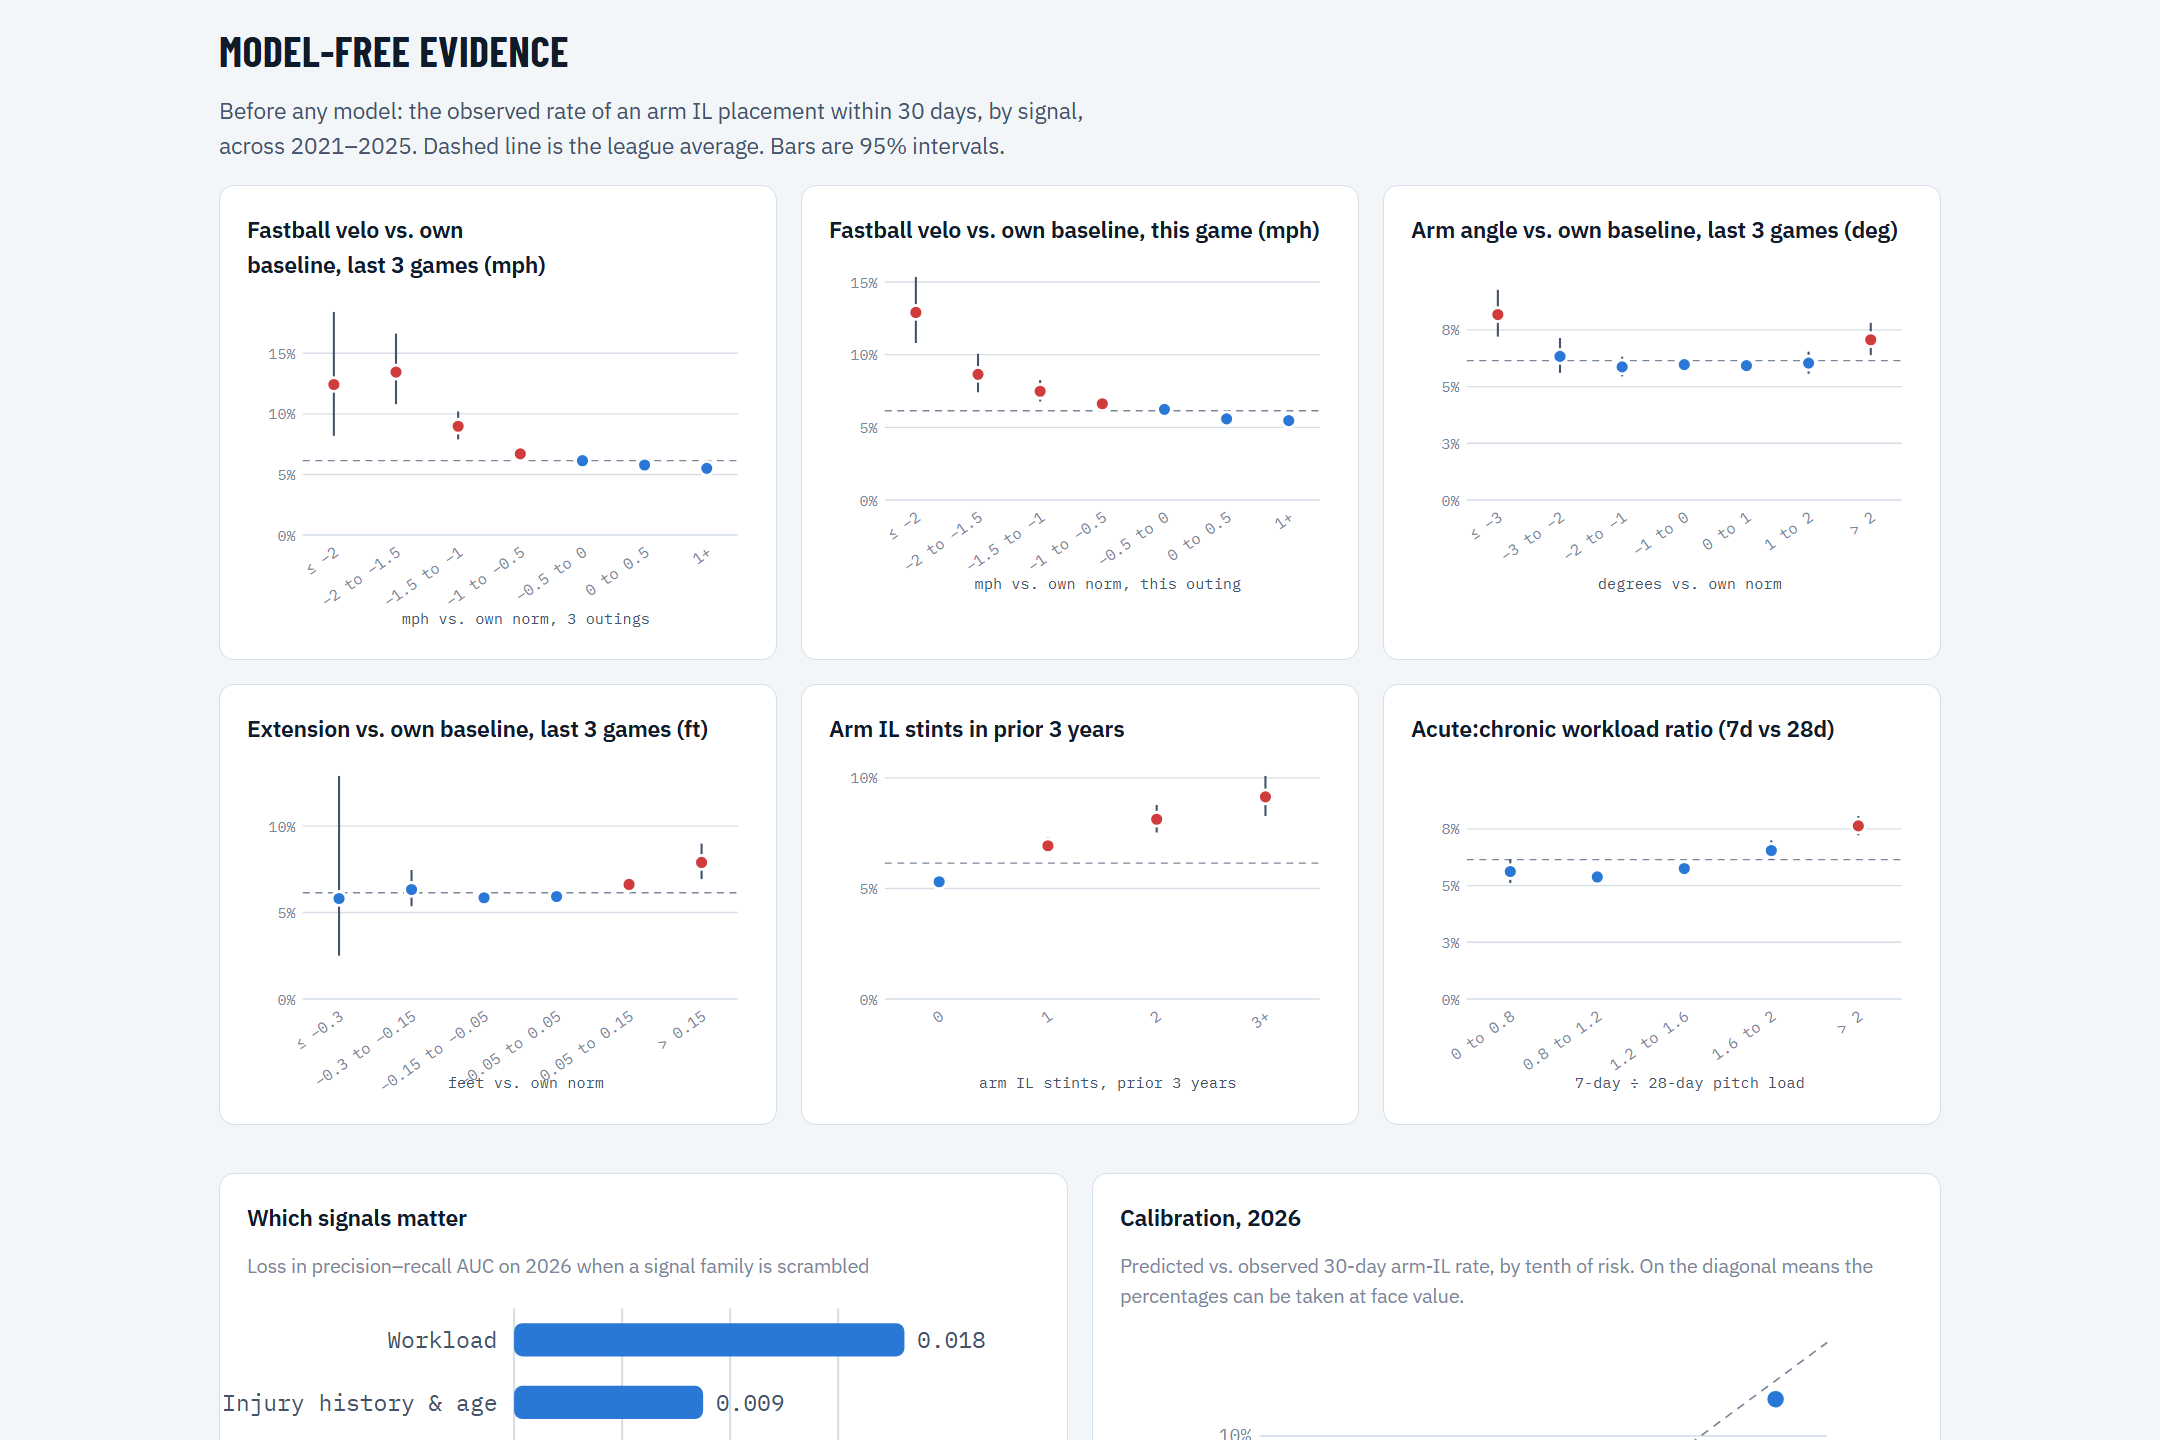
Personal baselines. A 92 mph pitcher and a 99 mph pitcher can't be judged on the same scale, so every tracking metric $x$ (velocity, spin, release height and side, extension, arm angle, movement, in-game fade, pitch mix, zone rate) is measured against that pitcher's previous 8 outings:
$$\Delta x_t = x_t - \frac{1}{8}\sum_{k=1}^{8} x_{t-k}$$
A three-outing average of $\Delta x$ separates sustained drift from one bad night.
Workload and history. We add pitches over the last 7 and 28 days, rest days, season total, arm IL stints in the prior 3 years, and age. Workload uses the acute:chronic ratio:
$$\text{ACWR}t = \frac{\tfrac{1}{7}\,\text{pitches}{t-6..t}}{\tfrac{1}{28}\,\text{pitches}_{t-27..t}}$$
Model. The model is an L2-regularized logistic regression on standardized, winsorized features:
$$P(\text{arm IL within 30 days} \mid \mathbf{x}_t) = \sigma!\left(\beta_0 + \boldsymbol\beta^\top \mathbf{x}_t\right)$$
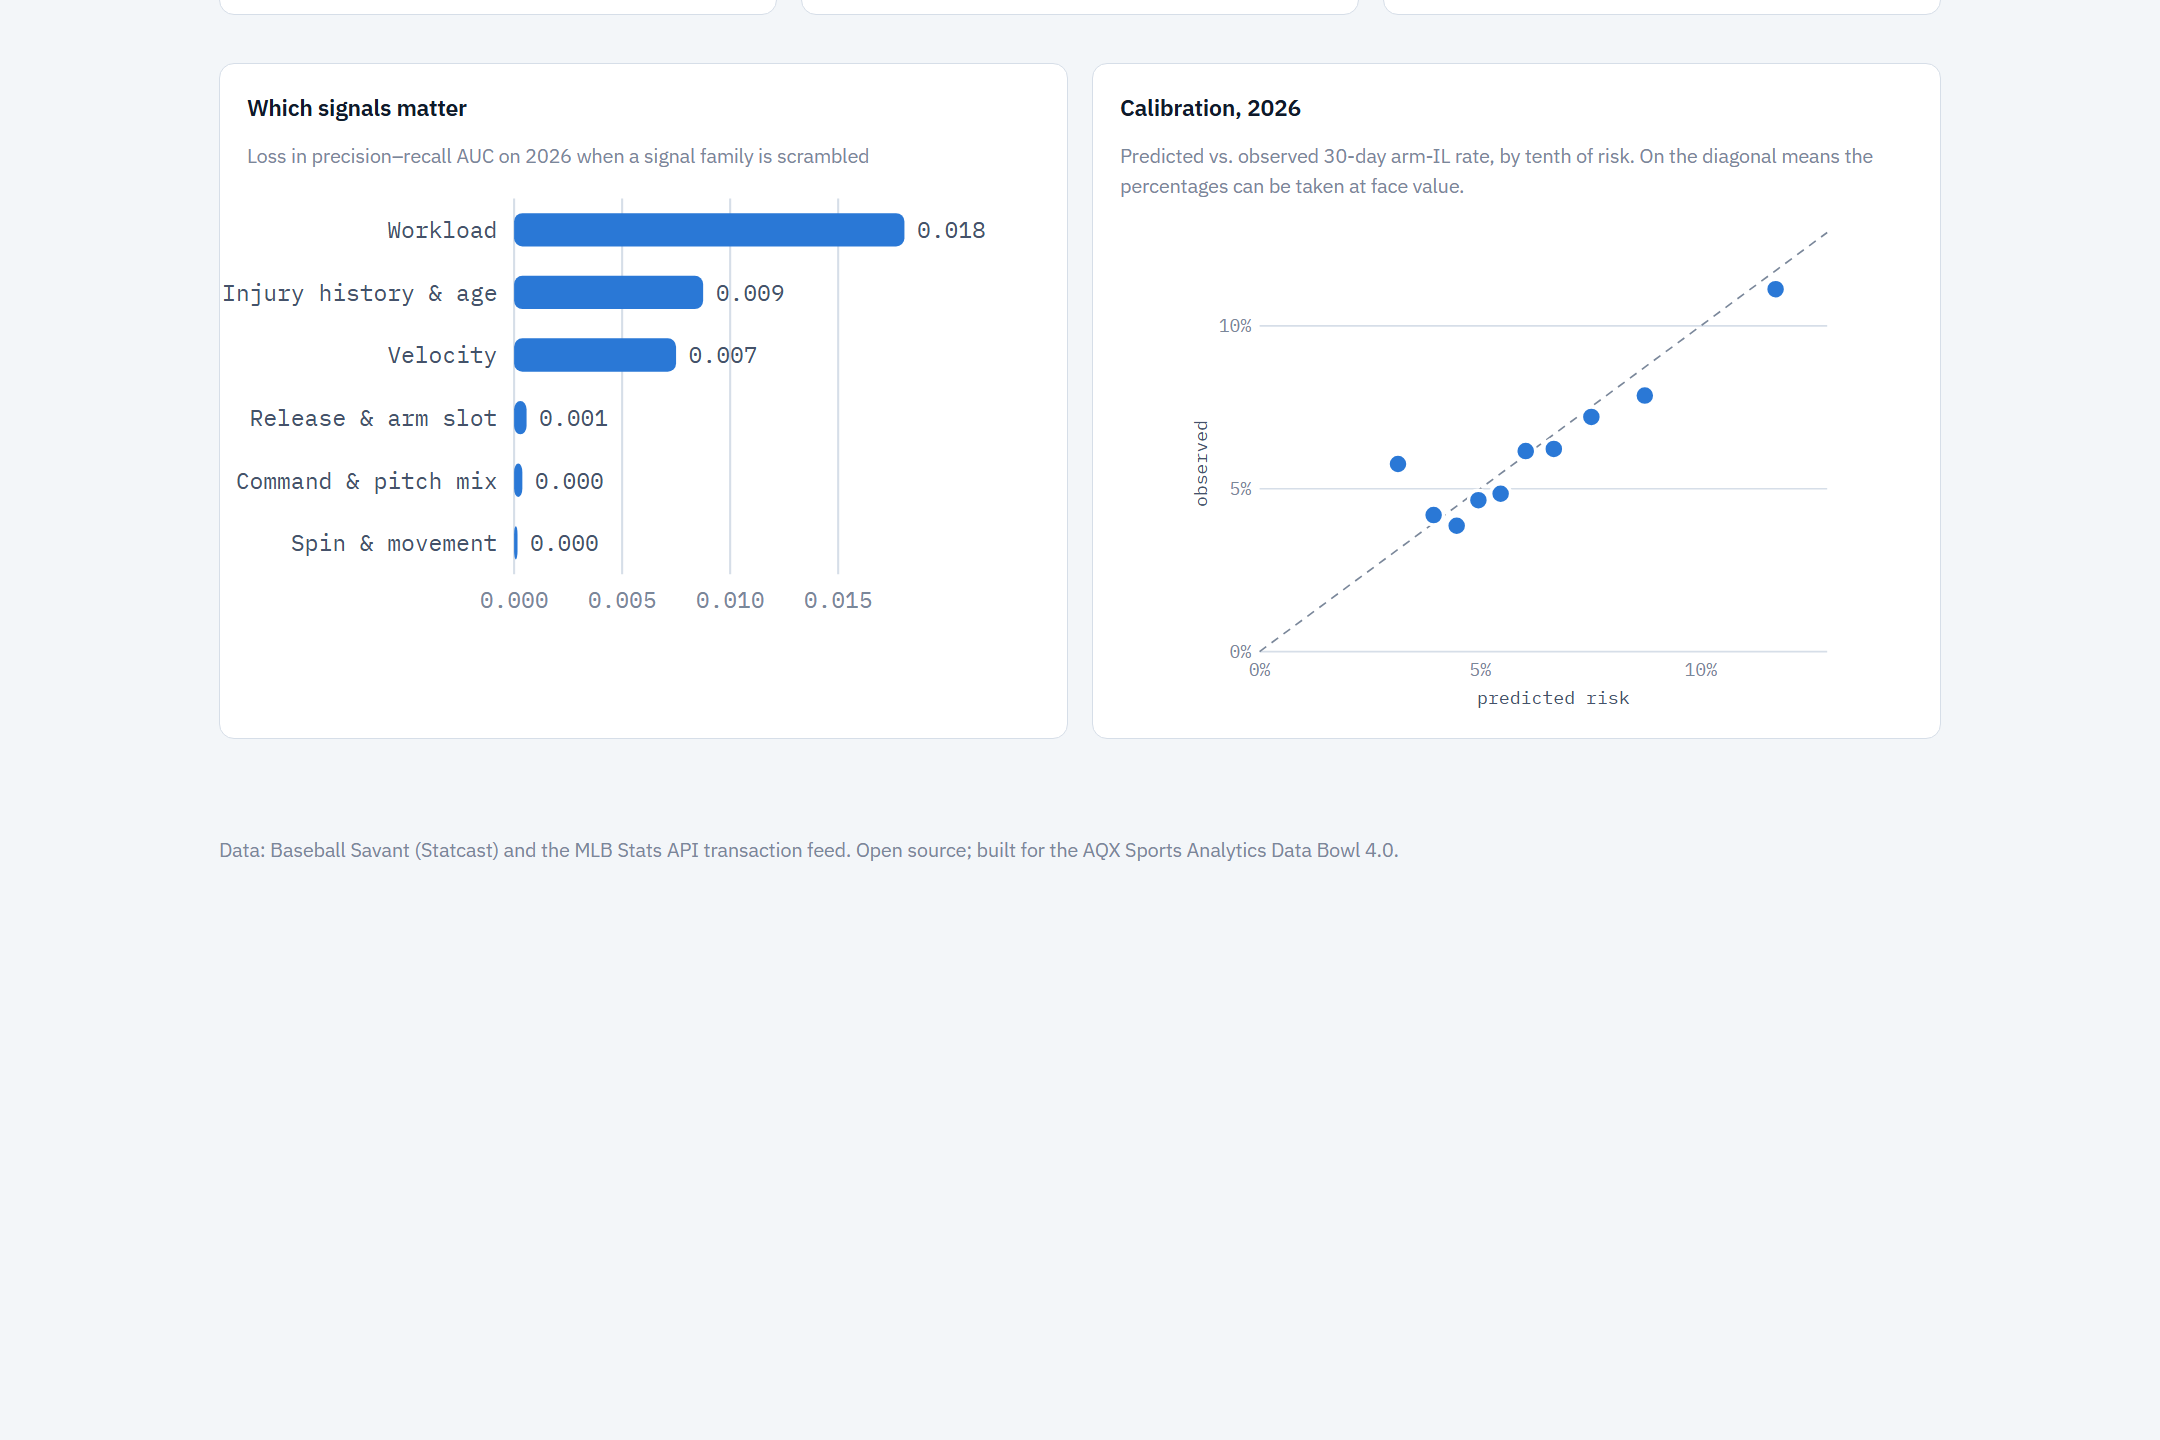
It beat gradient-boosted trees on the 2025 validation season (PR-AUC 0.095 vs 0.090) and is easier to explain. Each red flag is explained by occlusion: reset one signal family $F$ to "normal" for that pitcher, and the drop in risk is that family's contribution:
$$c_F = \hat p(\mathbf{x}_t) - \hat p(\mathbf{x}_t \text{ with } F \text{ reset})$$
Validation. We used a strict time split: train on 2021–2024, choose the model on 2025, refit, and score 2026 once. The red-flag line (the 90th percentile of 2025 scores) was fixed before 2026 was touched. The 95% intervals come from 500 bootstrap resamples of whole pitchers, because outings from one pitcher are not independent.
Dashboard. A single static HTML page with hand-built SVG charts, hosted on GitHub Pages. It needs no server, so anyone can open it.
Challenges we ran into
- Honest evaluation was the hardest part. Many "catches" happen in the game where the pitcher is hurt, which inflates any model. We report those separately. Counting only advance warnings at equal alert volume, ArmWatch and the velocity rule are level (28 vs 29). ArmWatch's edge is that its alerts are more often right and arrive about twice as early. The gains are real but modest, the intervals overlap, and the dashboard says so.
- Noisy labels. The IL is an imperfect proxy for injury. Teams use it for fatigue and roster moves, and some pitchers pitch hurt without a stint.
- Retroactive dates. IL placements are often backdated, so we use the transaction's effective date to avoid labeling outings that came after the real injury.
- Scale. We pulled 1,236 days of Statcast in resumable daily requests. ## Accomplishments that we're proud of Convert bank statement pdfs to excel or quickbooks CSV, balabce verified build a sports analytics dashboard or predictive model 3d cad modeling, product design and engineering drawings ## What we learned
- Context beats a single number. A velocity drop means much more when it is sustained, comes with a change in arm slot, or happens to a pitcher with an injury history.
- Comparing each pitcher with himself removes most of the noise between pitchers.
- A modest, well-calibrated model with clear reasons is more useful to a staff than a black box with a bigger headline number. ## What's next for ArmWatch: MLB Pitcher Arm-Injury Early Warning
- Role-specific red-flag lines, since starters are flagged far more often than relievers.
- Bullpen, minor-league and biomechanics data, which clubs already have.
- A daily refresh during the season.
- Survival modeling of time to injury.
Built With
- baseball-savant
- css3
- html5
- javascript
- mlb-stats-api
- numpy
- pandas
- pyarrow
- python
- requests
- scikit-learn
- statcast
- svg
