Inspiration
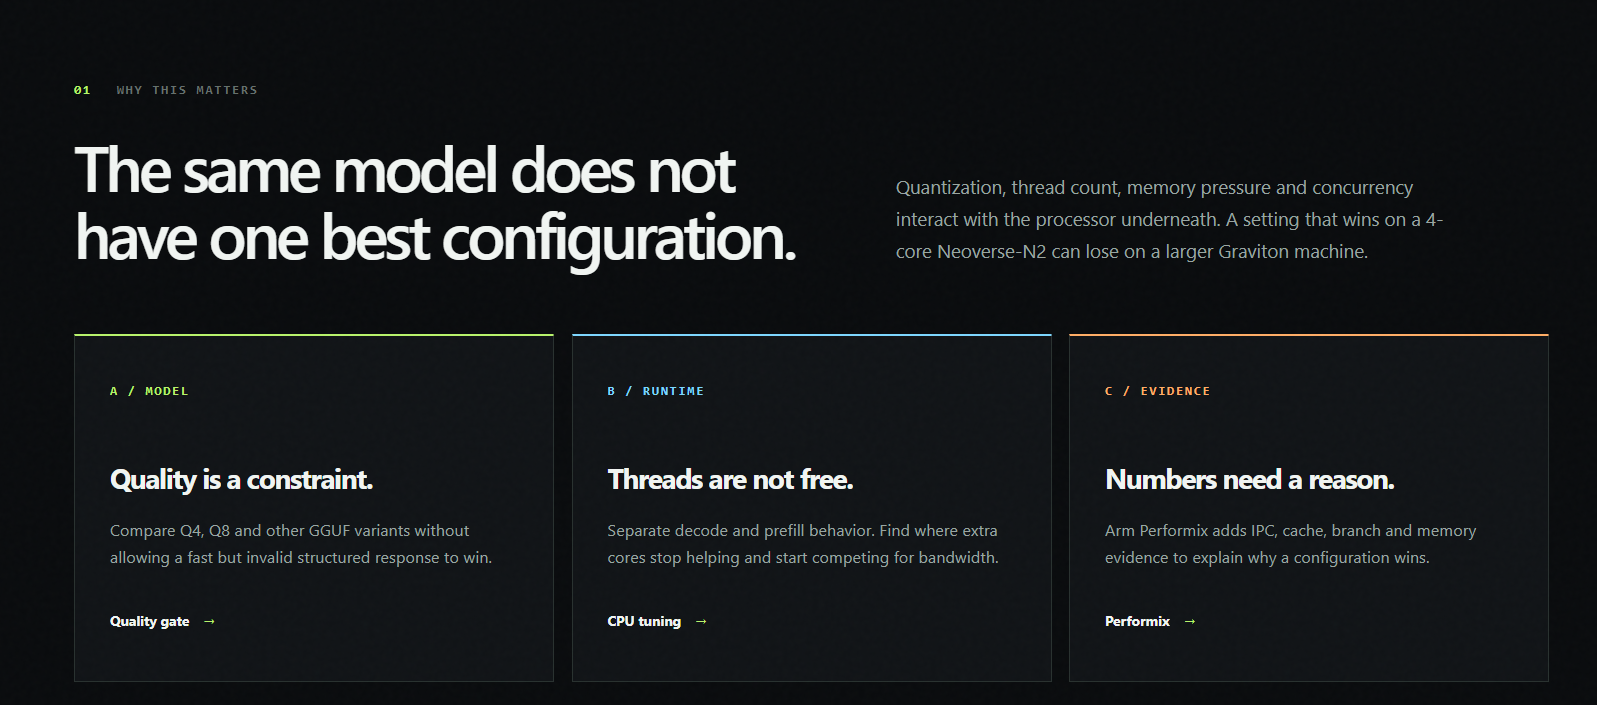
Every developer deploying an LLM on an Arm cloud server hits the same wall: the fastest configuration is a hardware fact, not folklore. Q4 versus Q8, two threads versus four — the answer changes between a four-core Neoverse and a sixty-four-core Graviton, and nobody hand-tests twenty-four combinations with identical prompts, warmup, seeds, and a quality gate. So we built the tool we wanted to exist: an autotuner for LLM serving on Arm.
What it does
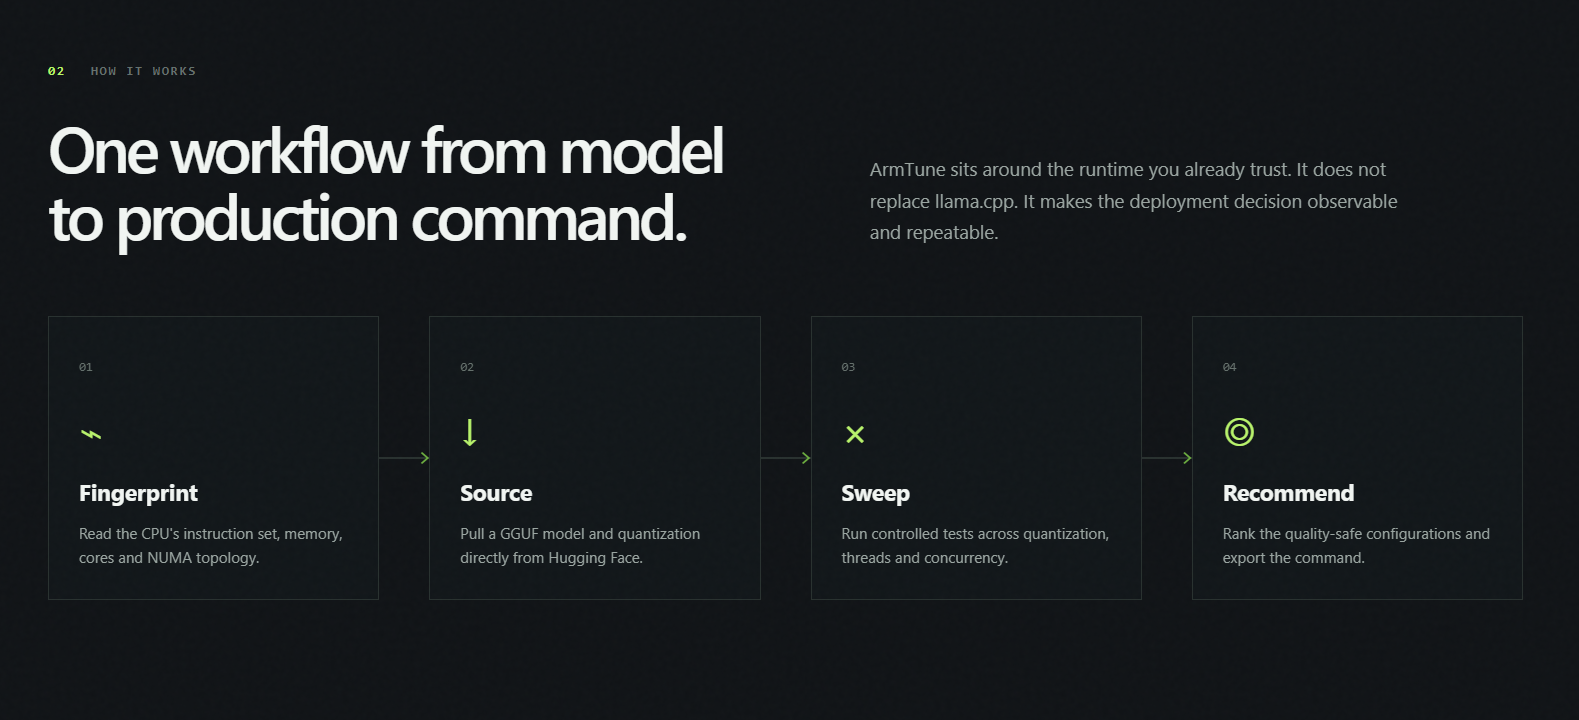
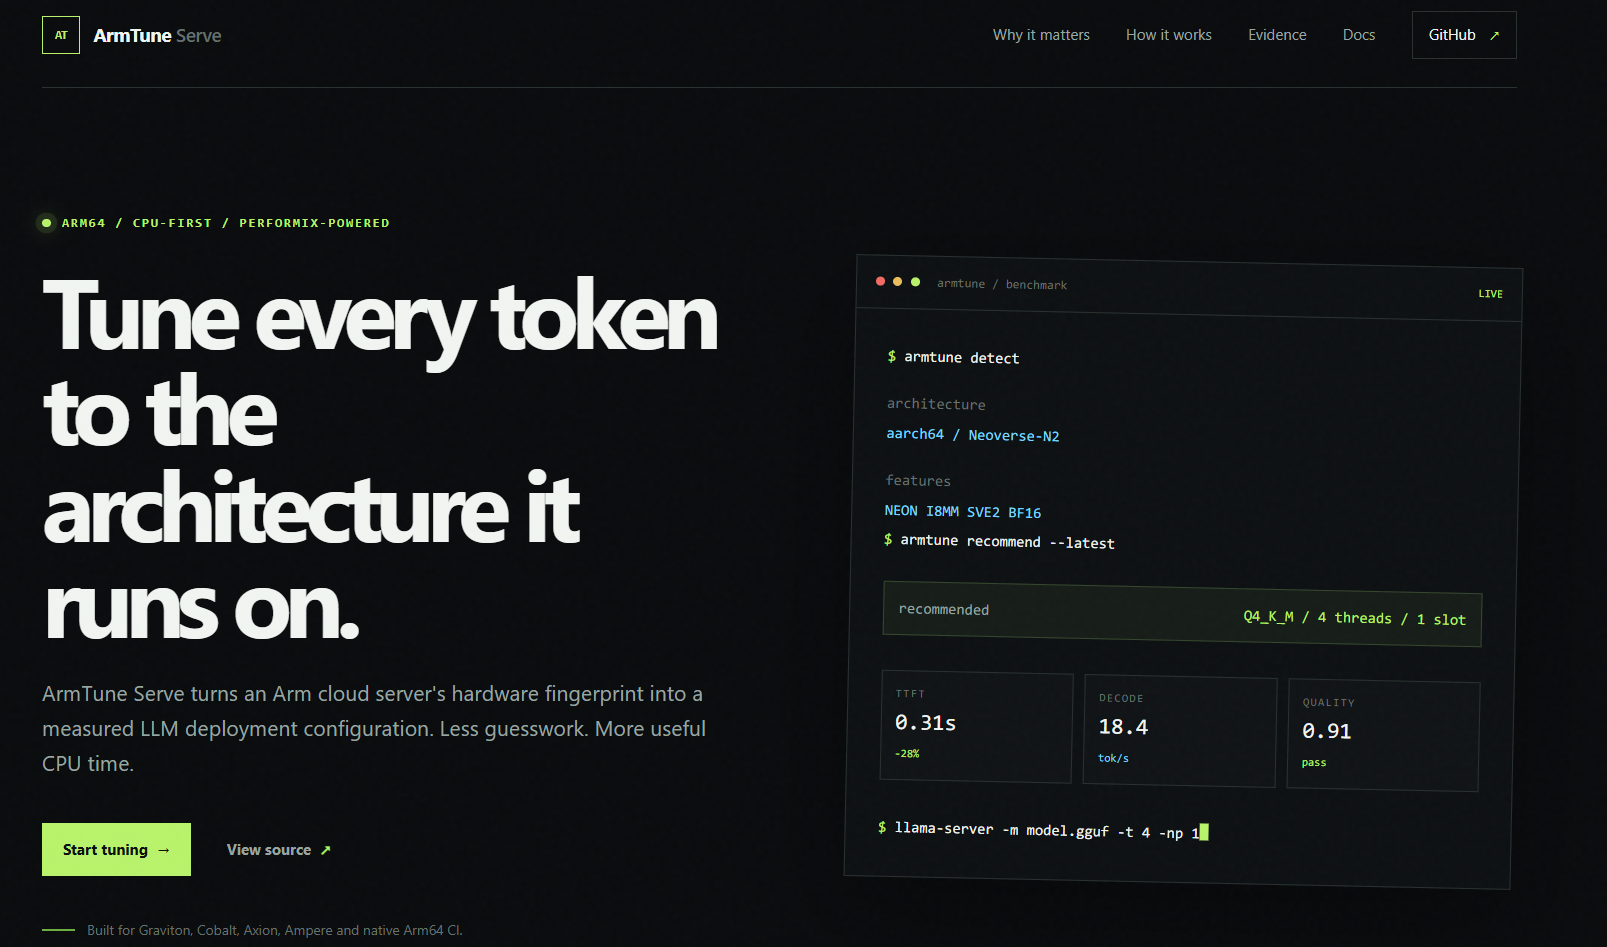
ArmTune Serve measures how an LLM actually behaves on your exact Arm64
machine, then hands you the deployment command. It pulls a GGUF model from
Hugging Face, fingerprints the CPU (NEON, I8MM, SVE2, cores, NUMA), runs a
controlled sweep on a real llama-server process built with Arm KleidiAI
kernels, captures Arm Performix hardware counters during inference, rejects
configurations below the quality threshold, and prints a copy-paste launch
command.
The recommendation problem we solve, formally: over the candidate configuration space $C$ (quantization × threads × concurrency), we select
$$ c^* = \arg\max_{c \in C} \; s_{\text{obj}}(c) \quad \text{subject to} \quad q(c) \geq q_{\min} = 0.5 $$
where $s_{\text{obj}}$ is the objective score (latency, throughput, memory, or balanced) and $q(c)$ is the structured-output quality of configuration $c$. Without the constraint, a fast-but-broken config always wins.
How we built it
The runtime is abstracted behind an adapter interface; the primary adapter
drives llama-server through its OpenAI-compatible API so we benchmark the
exact binary compiled with GGML_CPU_KLEIDIAI=ON and -mcpu=native, and
capture its startup evidence in every result. The CI pipeline builds generic
and KleidiAI variants, then runs the identical workload matrix on both. The
dashboard console provides a guided pipeline — live Hugging Face search,
model cards, streaming terminal — so no one copy-pastes repo IDs.
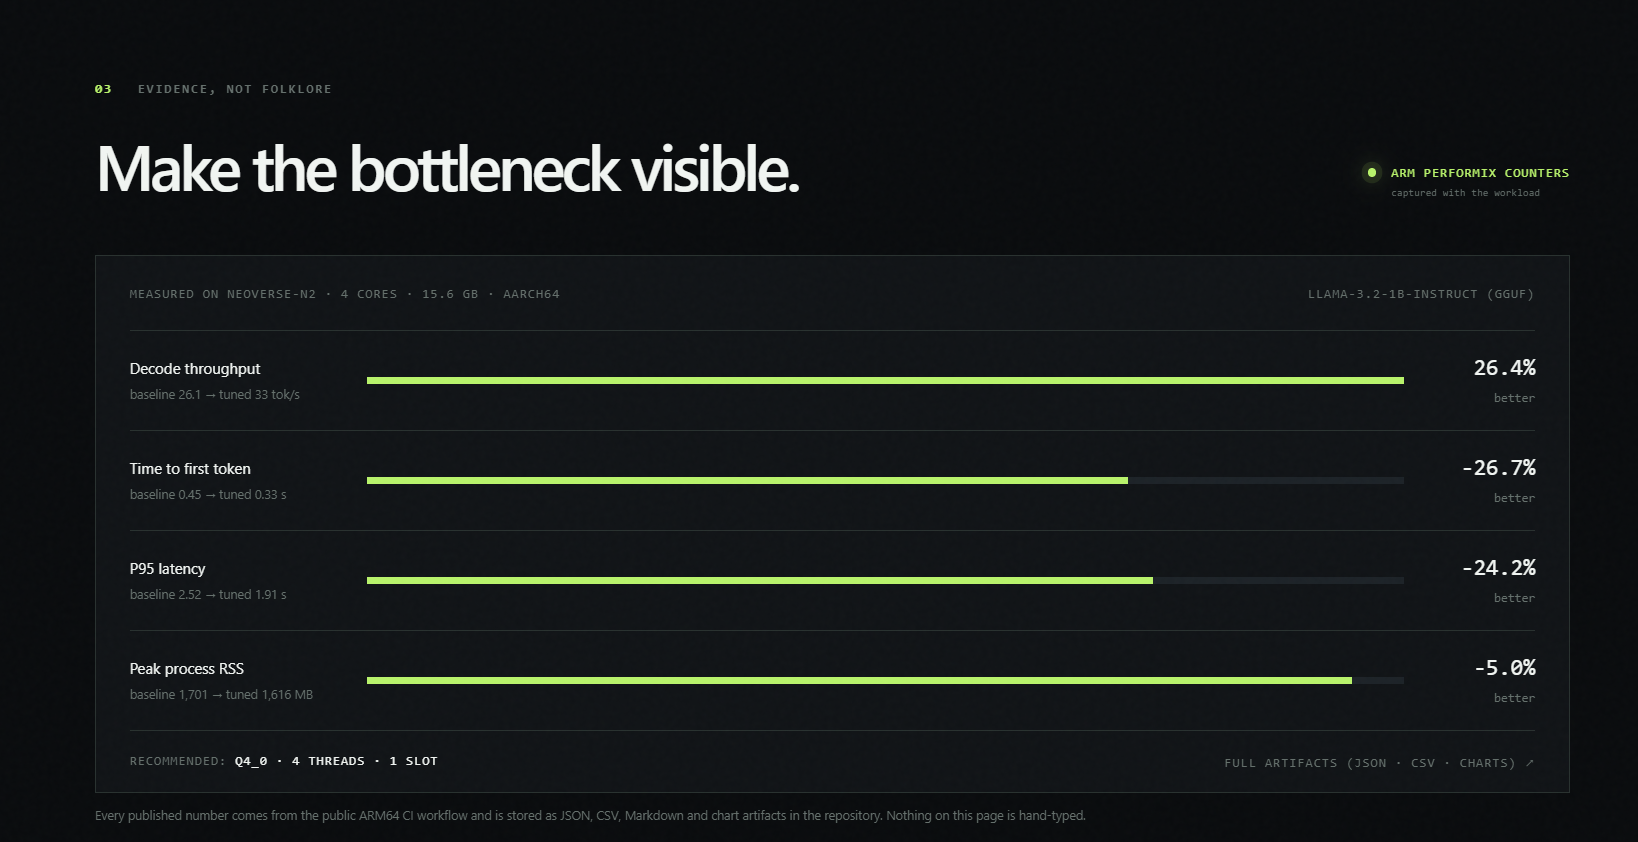
Measured results (Neoverse-N2, 4 cores, 15.6 GB, GitHub ARM64 runner)
| Metric | Q4_K_M · 4 threads | Q4_0 · 4 threads | Change |
|---|---|---|---|
| Decode tokens/sec | 26.1 | 33.0 | +26% |
| Time to first token | 0.45 s | 0.33 s | -27% |
| P95 latency | 2.52 s | 1.91 s | -24% |
| Peak process RSS | 1701 MB | 1616 MB | -5% |
| Quality score | 1.00 | 1.00 | gate held |
Thread sweep: 1 thread 8.1 tok/s → 2 threads 15.1 tok/s → 4 threads
28.1 tok/s (3.5×). Full artifacts are committed under docs/evidence/.
Challenges we ran into
- The Arm Performix CLI subcommands vary by version — we built a transparent probe that records exactly what ran, so failures are never silent.
- Quality must be measurable or autotuning is meaningless: raw completions ramble, so prompts route through the instruct chat template and outputs are scored as strict JSON against expected labels.
- A silent fallback bug let CI produce mock numbers once; we caught it, added a regression test, and made the CLI refuse to be quiet about it.
Accomplishments we're proud of
The whole pipeline runs on free, public, native-ARM64 infrastructure and any claim in this write-up is regenerable with one click. And the honest finding is the best part: on this hardware the winning move was quantization plus thread count — not the kernel flag — because decode is memory-bound. The data proved it. That is exactly what measurement tools are for.
What we learned
On Arm, quantization choice is a kernel-fit question, not a size question. Prefill and decode want different thread counts. Oversubscription shows up in P95 before it shows up in the mean. And hardware counters turn "it's faster" into "it's faster because IPC rose and LLC misses fell" — the difference between a benchmark and an explanation.
What's next
Pin exact Performix CLI flags, NUMA and affinity sweeps on larger instances, LM-Eval-Harness scoring, a vLLM adapter, and the top-down layer this enables: fleet scheduling on measured per-replica capacity curves instead of CPU-utilization guesswork.

Log in or sign up for Devpost to join the conversation.