-
-
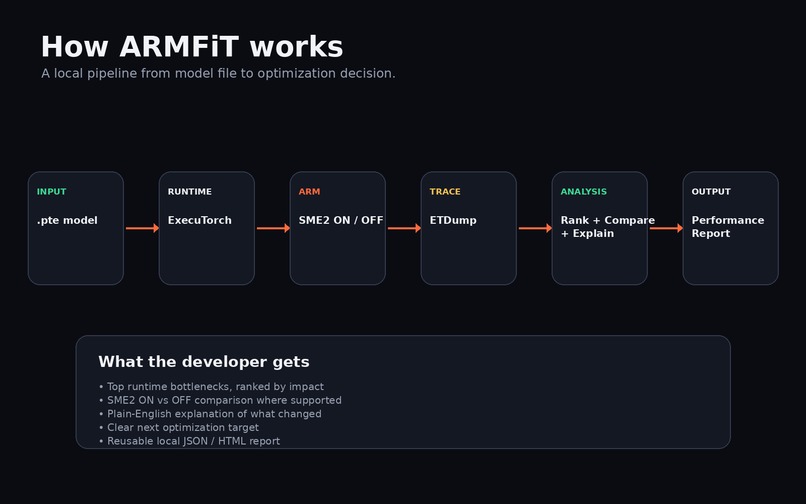
From .pte model to Arm profiling, bottleneck detection, and performance insights.
-
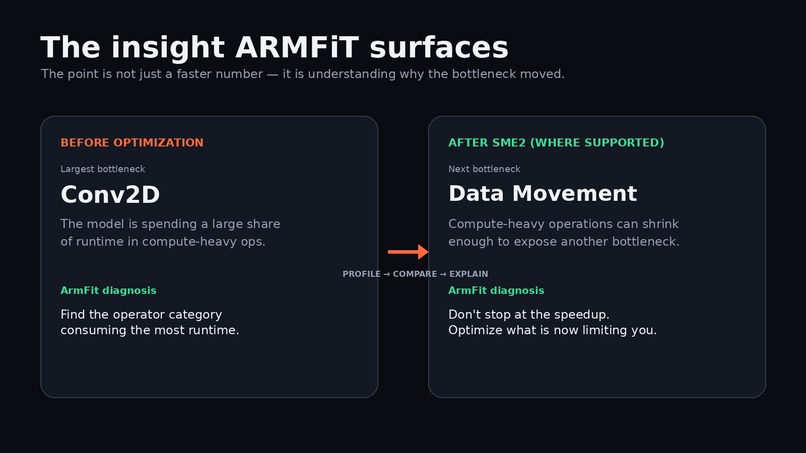
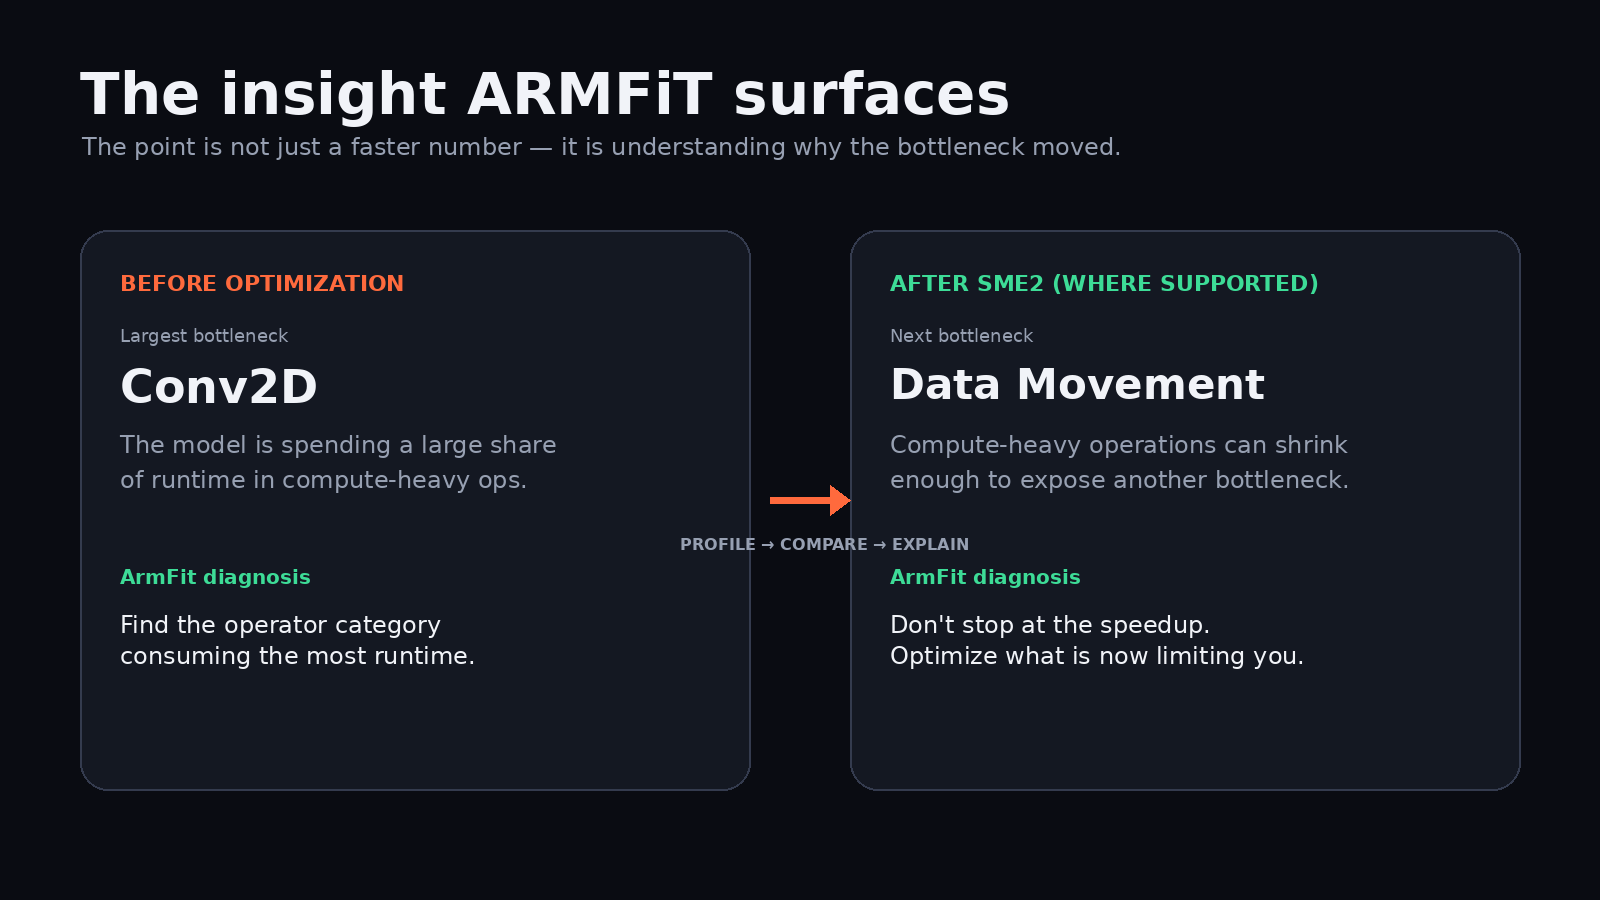
ArmFit shows how Arm optimization changes the performance profile, revealing the next bottleneck developers should investigate.
-
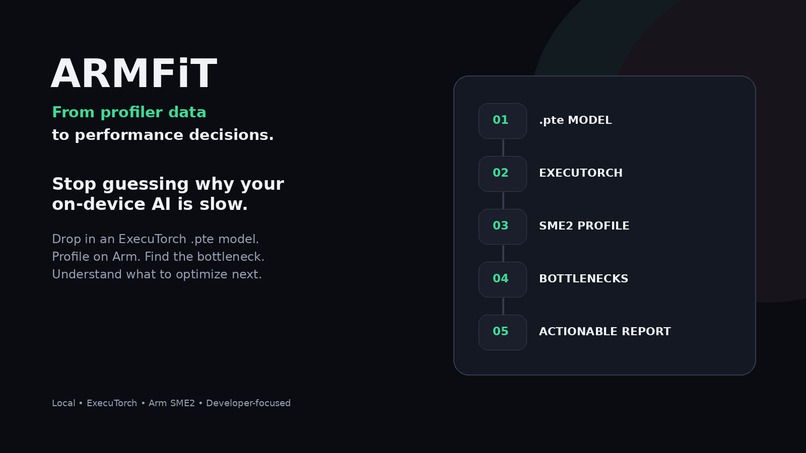
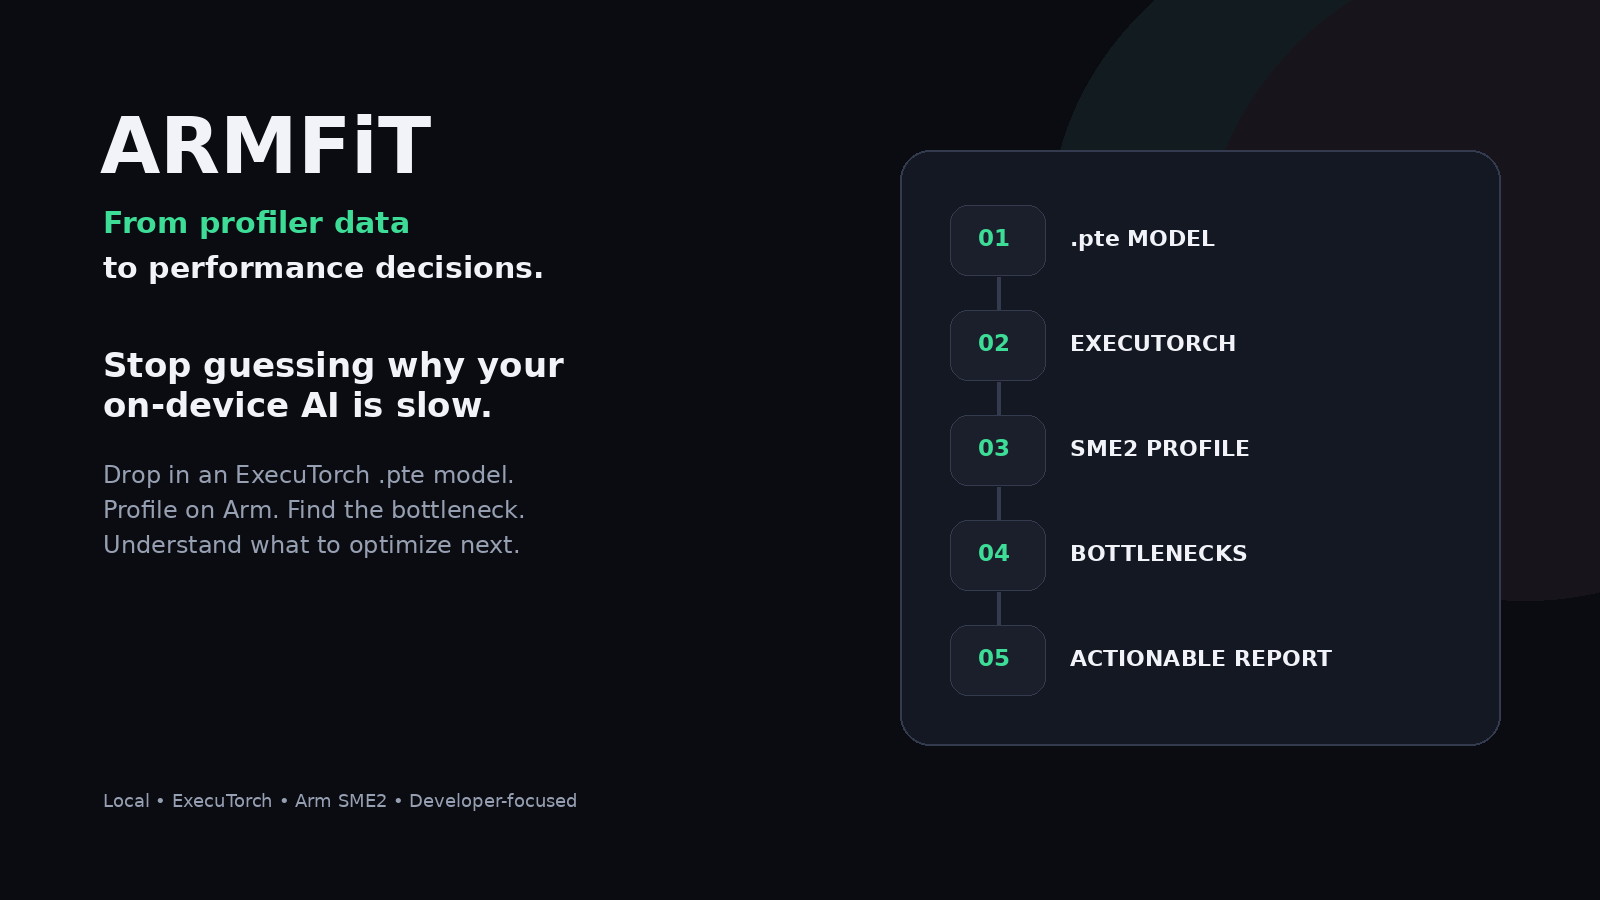
ArmFit — From profiler data to performance decisions. Analyze ExecuTorch models on Arm and quickly identify what to optimize next.
-
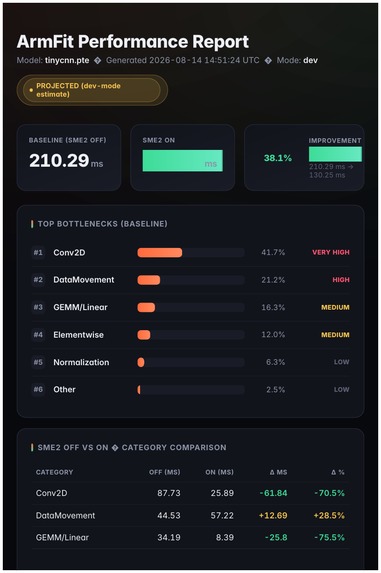
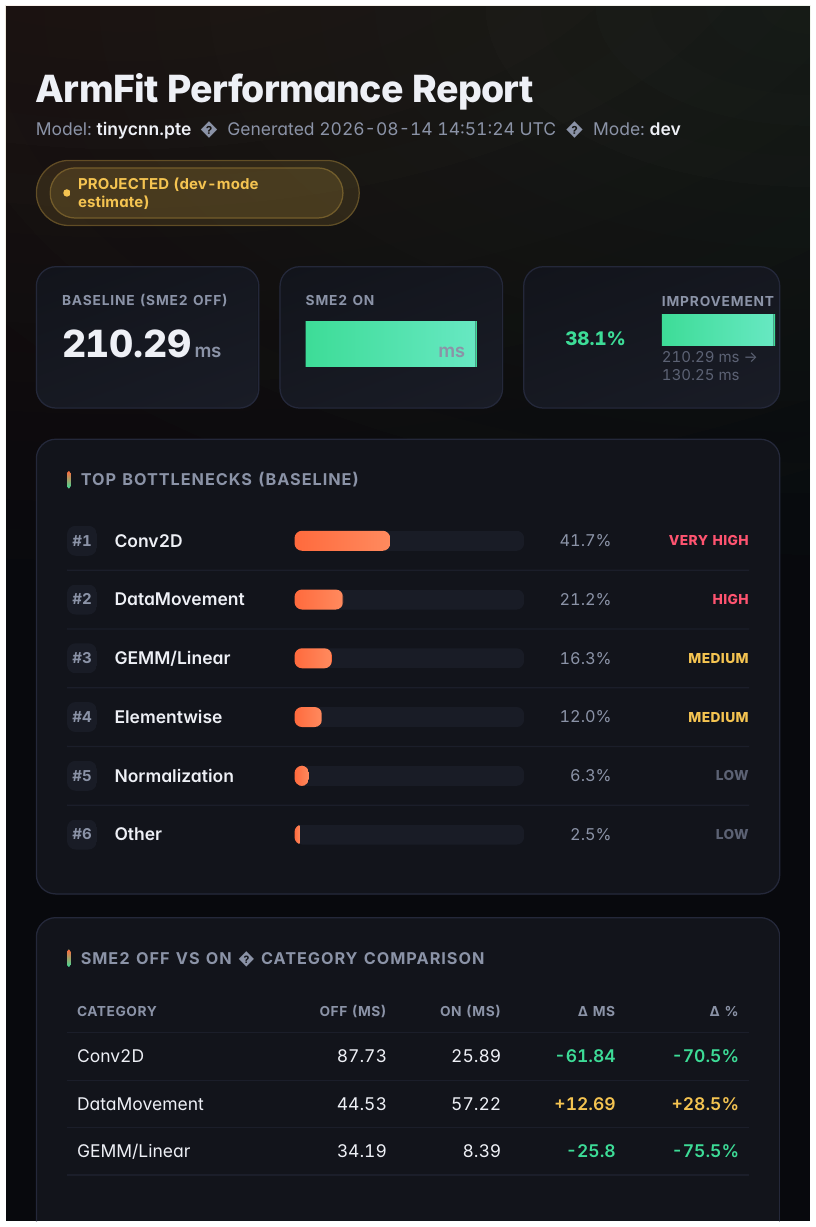
ArmFit performance dashboard showing model latency, bottlenecks, SME2 comparison, and actionable optimization insights.
Inspiration
On-device ML performance work usually means staring at a wall of per-operator timing numbers and manually figuring out what actually matters. With Arm's new SME2 instruction set promising big matrix-multiply speedups, we wanted a tool that could answer one question fast: if I turn SME2 on, what changes, and what should I fix next? — without requiring every developer on the team to own Arm hardware just to start building.
What it does
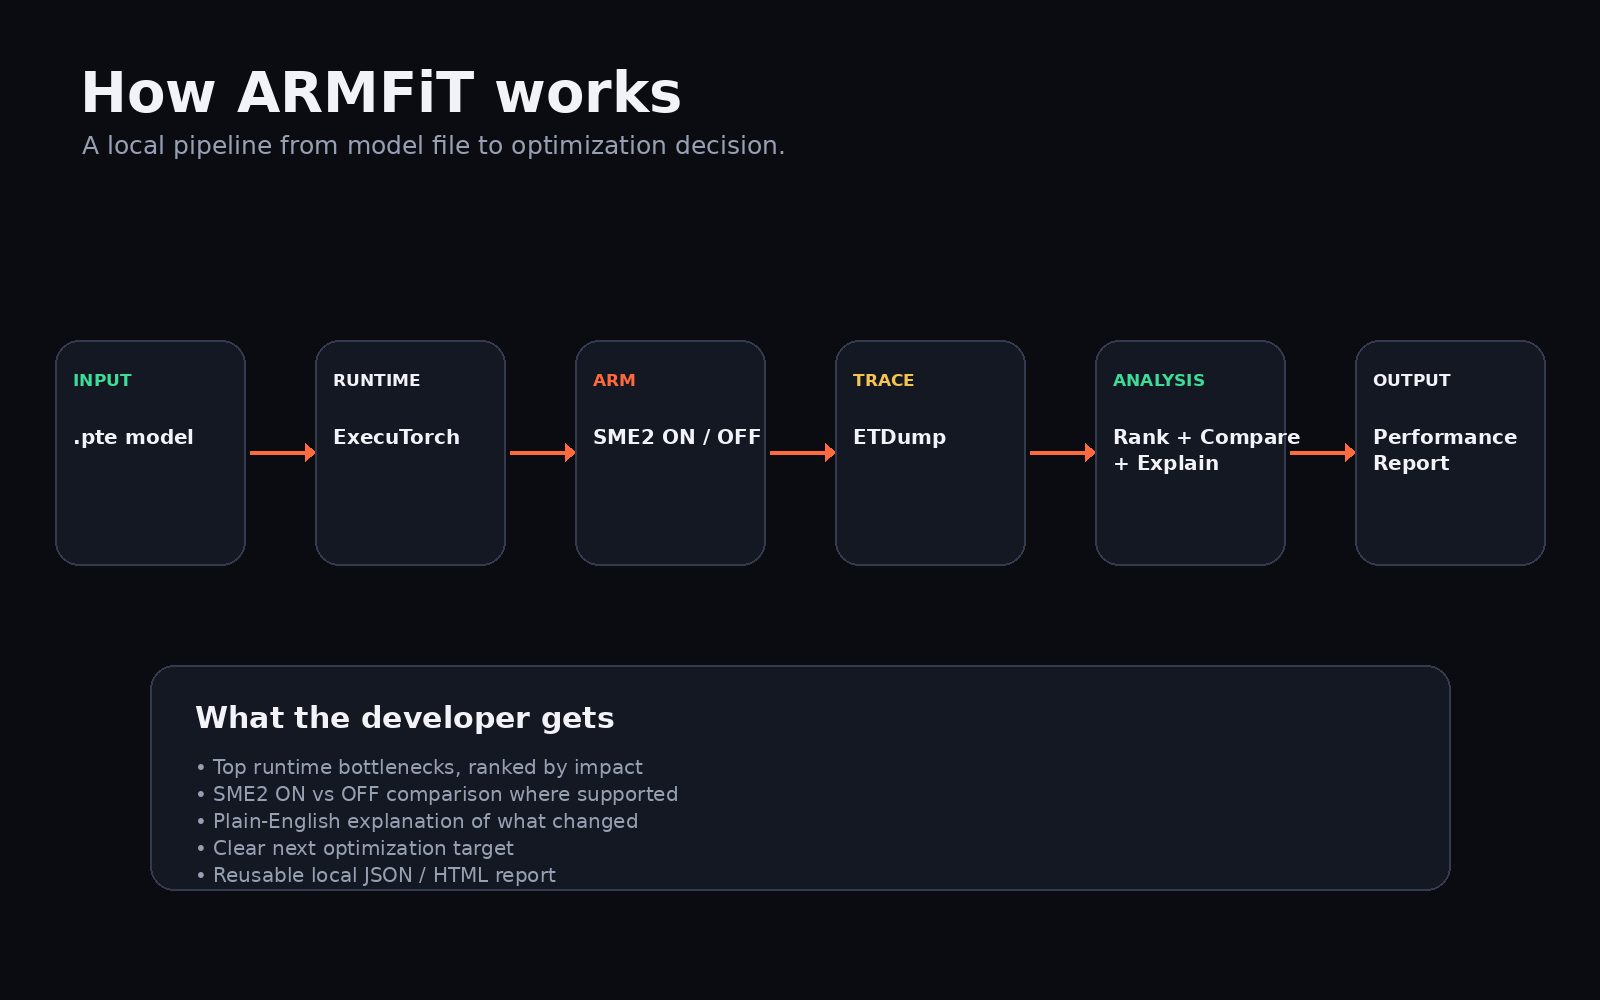
ArmFit takes any ExecuTorch .pte model and runs it through a full pipeline: profile → categorize operators (Conv2D, GEMM/Linear, Elementwise, Normalization, DataMovement, Other) → rank bottlenecks by impact → compare SME2 OFF vs ON → generate rule-based plain-English insights. It outputs a terminal summary, a JSON report, and a polished local HTML dashboard you can open with one flag (--serve). Every number in every report is explicitly labeled MEASURED or PROJECTED, so there's never ambiguity about what's real hardware data versus an estimate.
How we built it
We split the pipeline into clean stages (runner → analysis → report → dashboard) so each piece could be built and tested independently. The core insight was designing for two environments from day one: a --mode dev path that runs entirely on stdlib Python (with a deterministic synthetic profile fallback when ExecuTorch isn't installed) so anyone on any laptop — including our own Ryzen 7 x86 dev machines — could build and demo the full tool immediately; and a --mode arm path wired directly to Arm's real sme-executorch-profiling kit, which parses actual analysis_summary.json output from SME2 OFF/ON experiment runs into the same report format. The HTML report is a single self-contained file — no React, no FastAPI, no npm install, no CDN calls — which let us spend our time on the analysis logic instead of frontend plumbing.
Challenges we ran into
The biggest constraint was that SME2 is Arm-only silicon — it simply doesn't exist on the x86 machines most of us were developing on, so "real" SME2 numbers could only ever come from an Apple Silicon Mac or a recent flagship Android phone (Arm's profiling kit ships no Linux/Graviton preset). We solved this by building the projection mode from Arm's own published per-category speedup ranges, jittered and clearly labeled, so development never blocked on hardware access — but we were careful never to let a projected number quietly masquerade as measured. A second challenge was that Arm's real profiling output only gives category-level aggregate timings, not true per-operator granularity, which we worked around by treating each category as a single aggregate operator stat (with a documented path to per-operator detail via the *_exec_ops_stats.csv file as a stretch goal).
Accomplishments that we're proud of
A working end-to-end pipeline in both modes; an insights engine that produces genuinely useful, non-obvious observations (like catching when DataMovement's relative share of runtime grows after SME2 speeds up compute elsewhere — a real phenomenon Arm documents); and a dashboard that looks and feels like a finished product rather than a hackathon prototype, with zero external dependencies.
What we learned
Being explicit about measured-vs-projected data from the very start — in the data model, not just the UI — made it trivial to stay honest under time pressure, and it's a pattern we'd carry into any tool that mixes real and estimated numbers. We also learned that a good synthetic fallback (rather than a mocked demo) is what actually lets a team iterate quickly when the real hardware isn't in the room.
What's next for ArmFit
Wiring up true per-operator granularity from Arm's *_exec_ops_stats.csv output instead of category-level aggregates; running ArmFit against a broader set of real-world models (not just TinyCNN) to validate the projection multipliers against real Apple Silicon and Android SME2 measurements; and potentially swapping in a richer FastAPI + React frontend if the dashboard needs to support more interactive exploration down the line.
Built With
- arm-sme2
- cli
- css3
- executorch
- html5
- javascript
- python
- pytorch
- stdlib

Log in or sign up for Devpost to join the conversation.