-
repo thumb nail
-
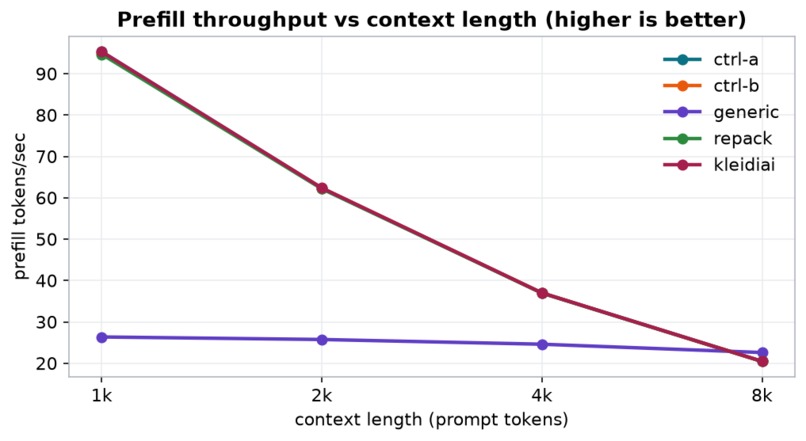
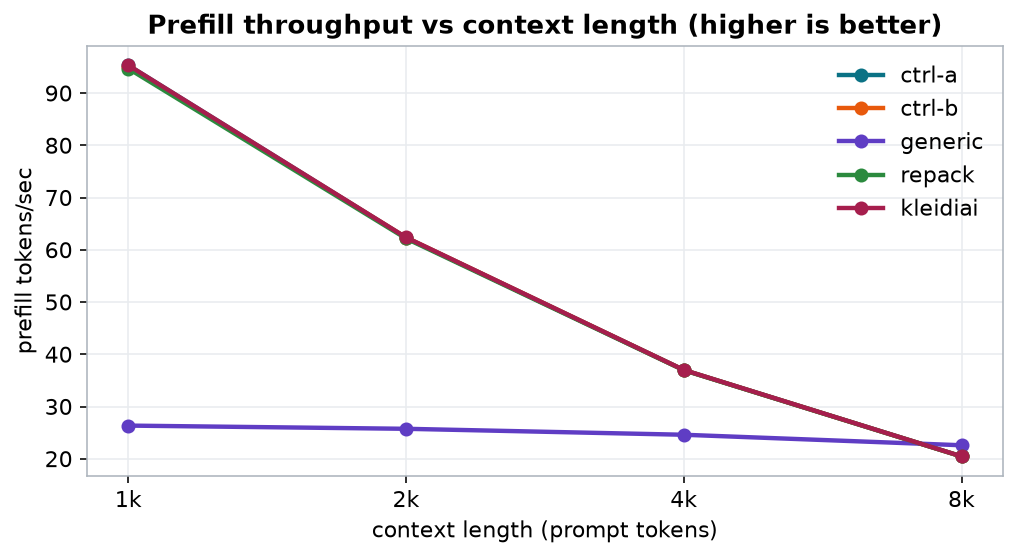
Q4_0: ggml repack gives 3.60x at 1k (26.4 to 94.8 tok/s). KleidiAI adds nothing on top. Both accelerated builds cross below generic at 8k.
-
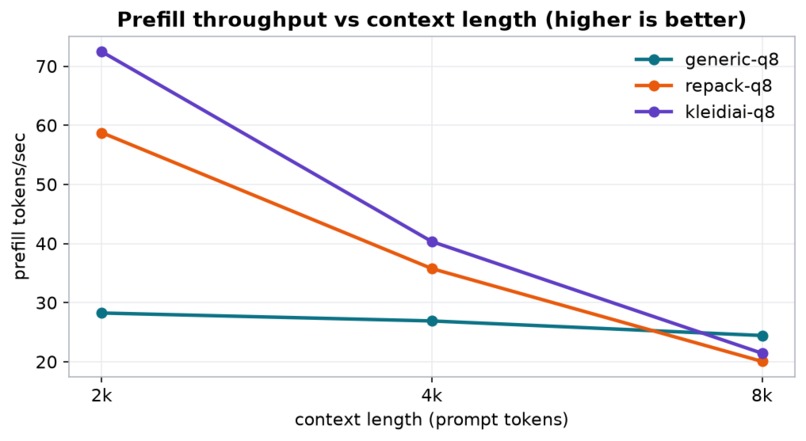
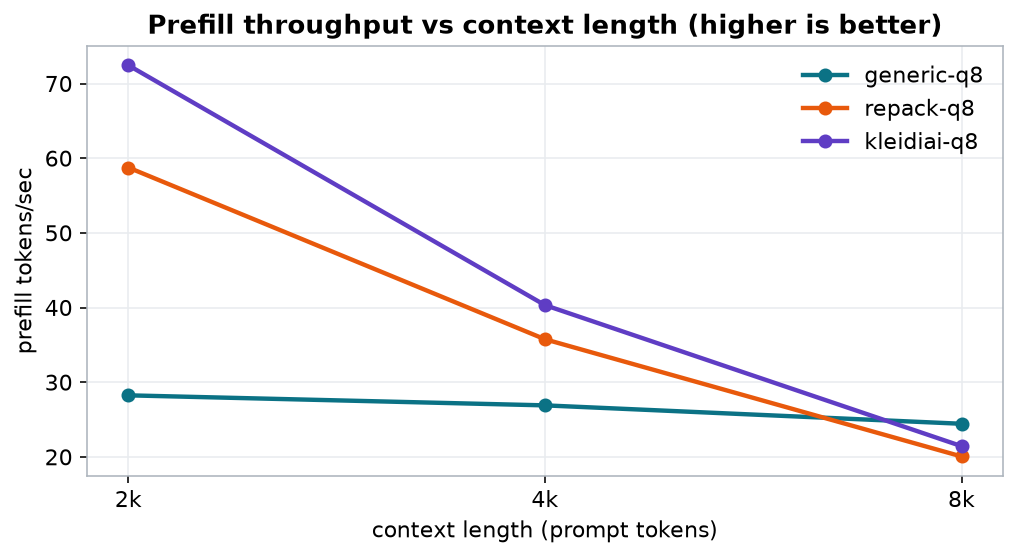
Q8_0: KleidiAI pulls clear of repack, 1.23x at 2k. This is the quant where its own kernels have room that repack cannot reach.
-
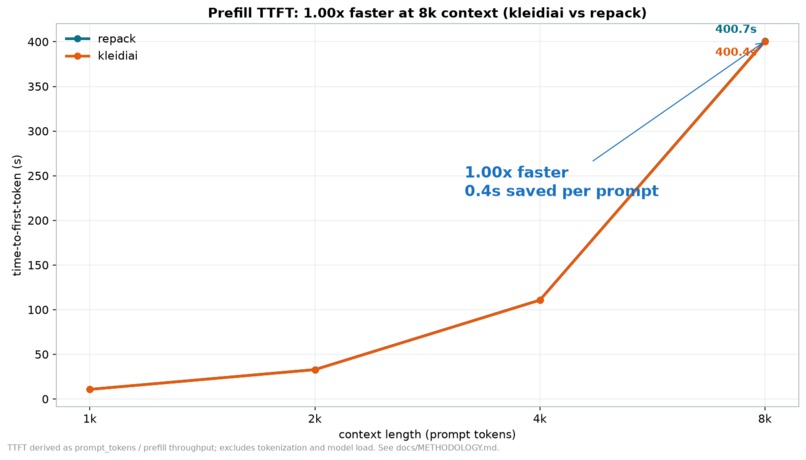
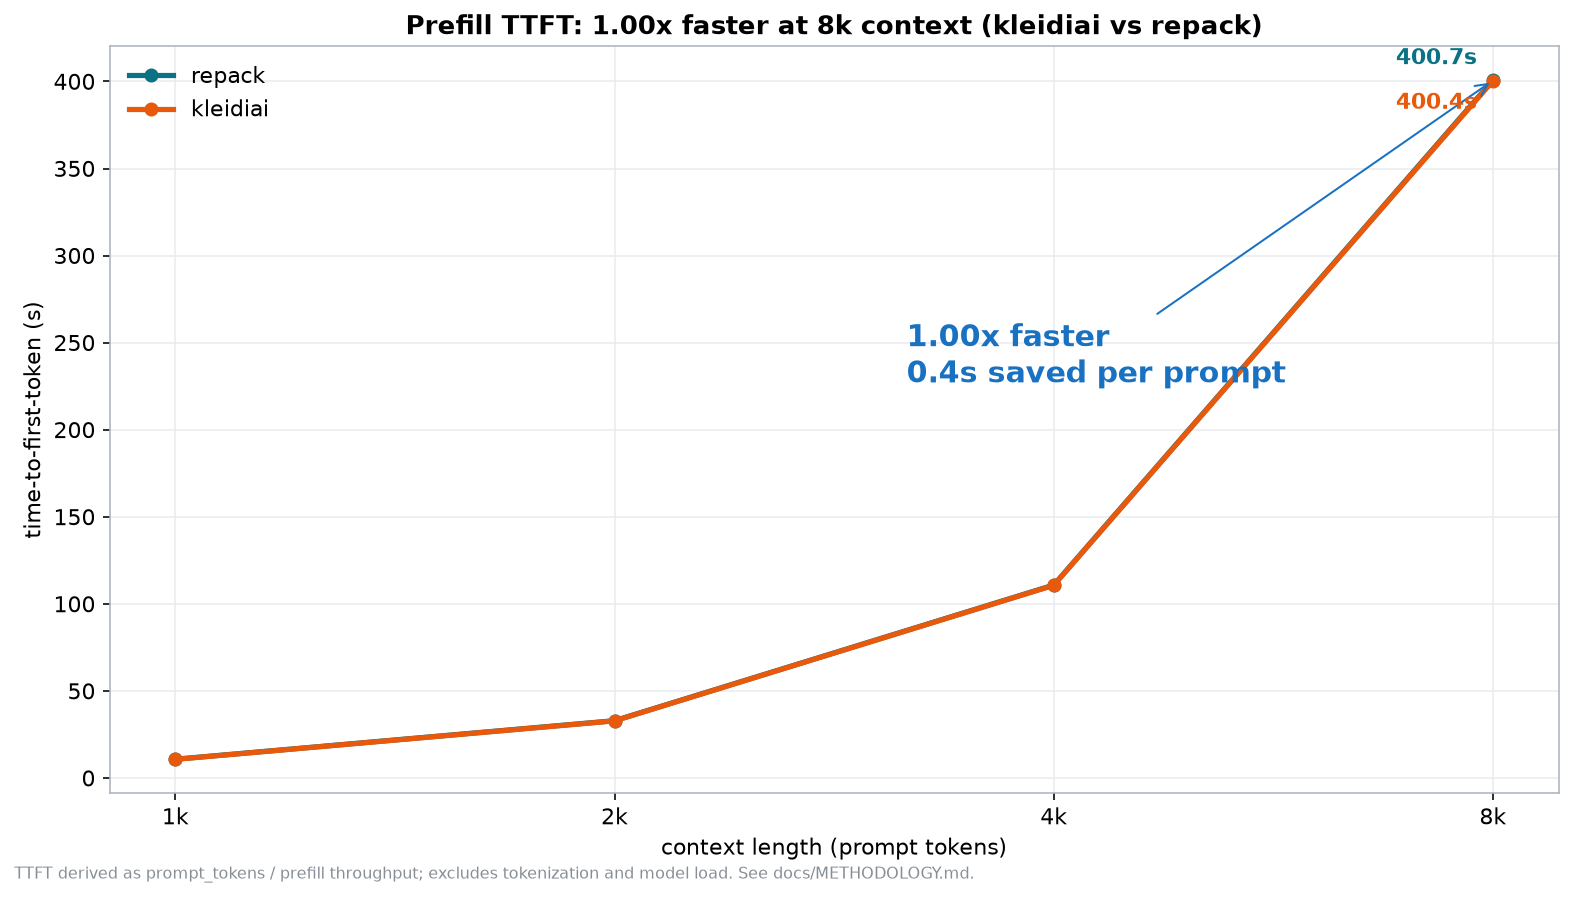
Q4_0, KleidiAI against ggml repack: a dead heat at every context. 1.00x, inside the measured 0.3% noise floor. Repack already took the win.
-
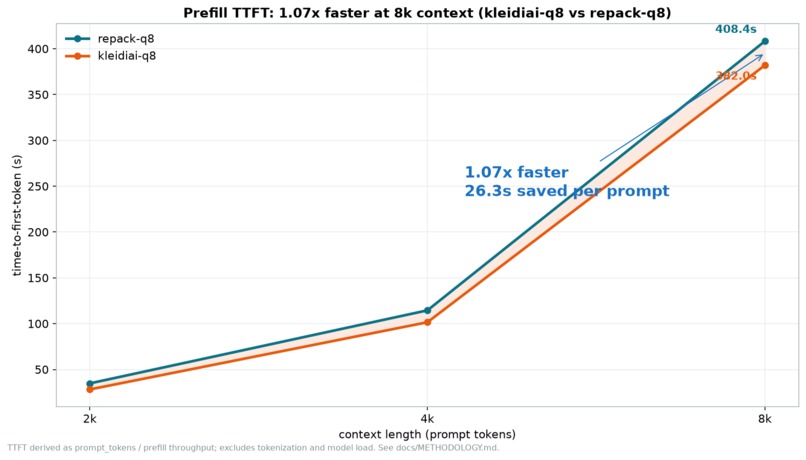
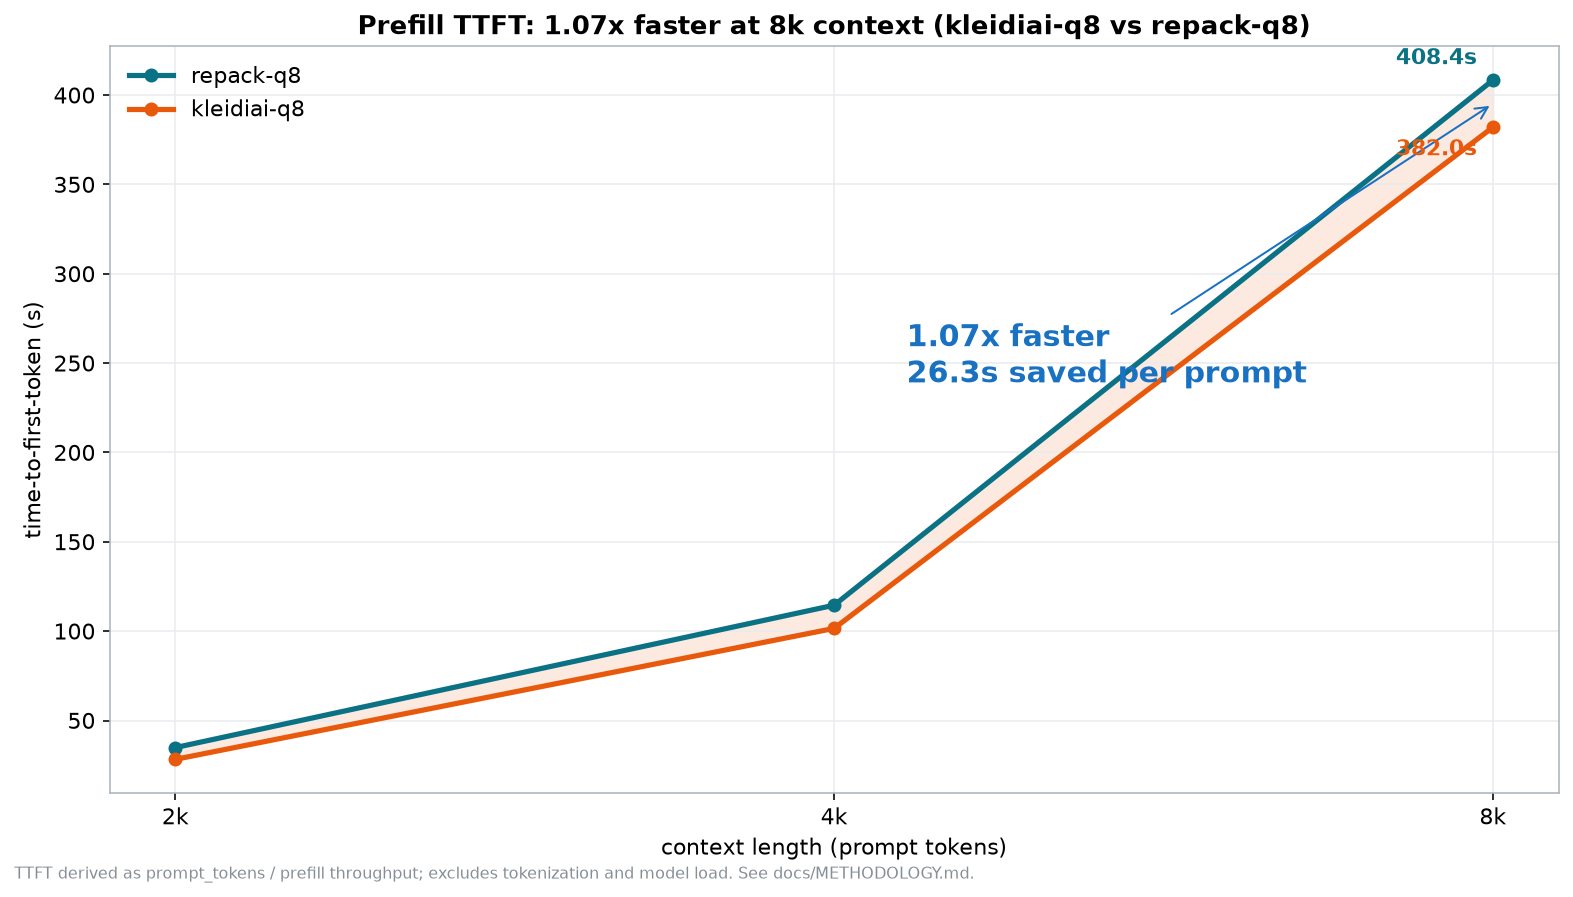
Q8_0, KleidiAI against repack: ahead at every point measured, 1.23x at 2k narrowing to 1.07x at 8k.
-
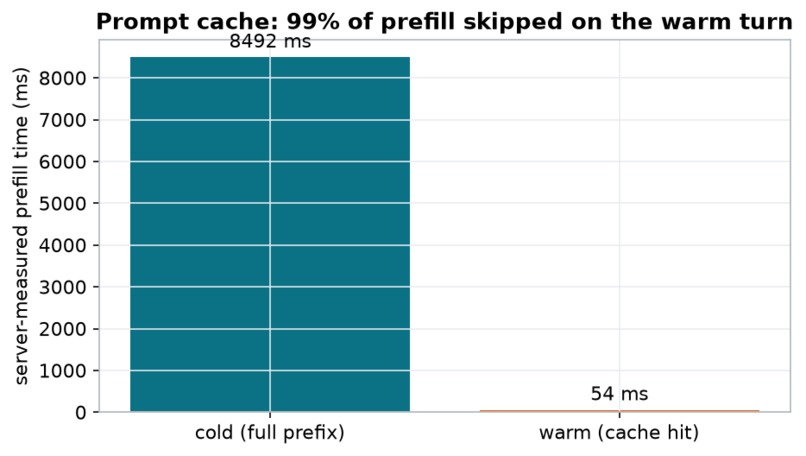
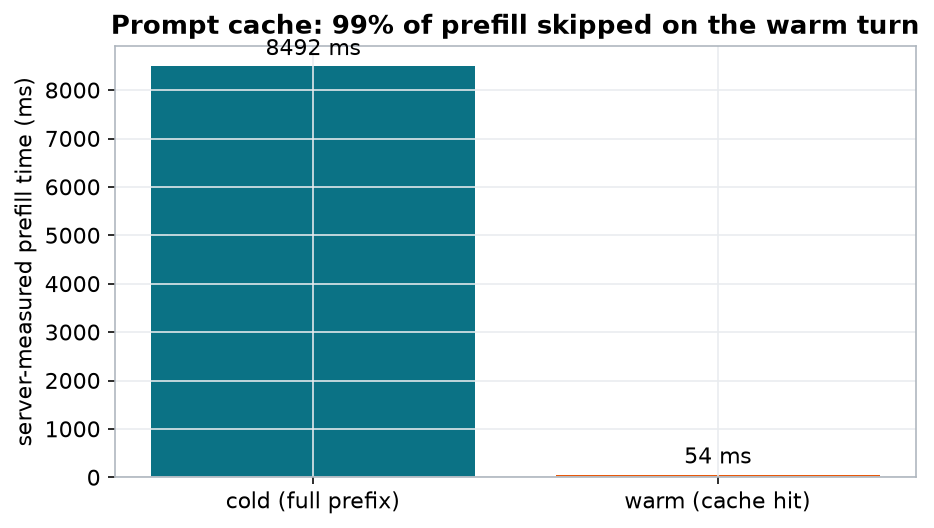
The biggest TTFT lever is not a kernel: prefix caching drops cold 8,492ms to warm 54ms. 99% of prefill skipped, vs 0-1% for KleidiAI.
-
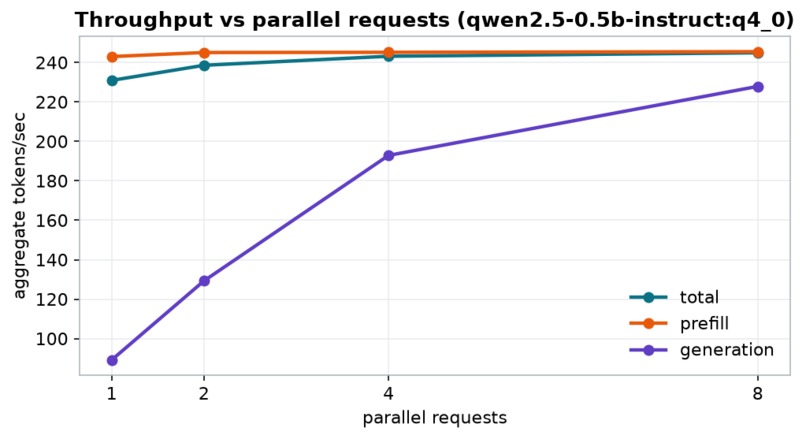
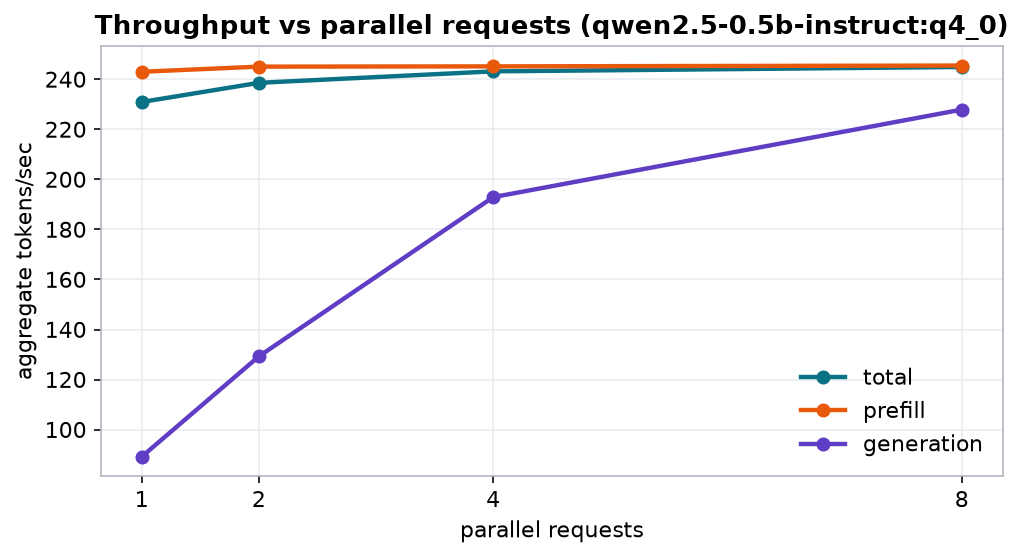
Aggregate throughput at 1/2/4/8 parallel requests on 4 Neoverse N2 vCPUs. Prefill saturates immediately; generation keeps scaling.
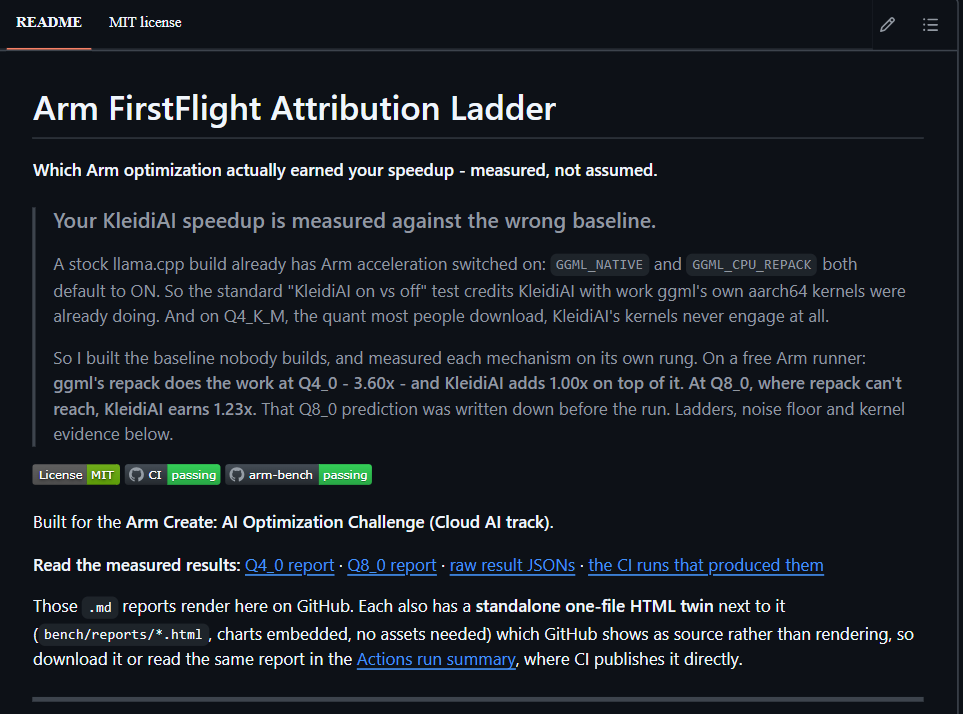
Inspiration
Agentic and RAG apps live or die on time-to-first-token. On long contexts that wait is almost entirely prefill. And more and more of that inference runs on Arm cloud CPUs like Graviton, Axion and Cobalt, because they're cheap per token. So I went looking for how much Arm-specific optimization actually buys you.
Every KleidiAI benchmark I found does the same thing. Build llama.cpp normally, build it again
with -DGGML_CPU_KLEIDIAI=ON, compare, publish the multiplier.
That test doesn't measure what it says it measures. In llama.cpp's own ggml/CMakeLists.txt,
GGML_NATIVE and GGML_CPU_REPACK both default to ON. So the "before" build already has
native targeting and ggml's own aarch64 repack GEMM, which is the same trick KleidiAI uses.
You're putting one Arm optimization against another, and the whole gap gets credited to
KleidiAI.
It gets worse. KleidiAI only has kernels for Q4_0 and Q8_0. Point it at Q4_K_M, the quant most people actually download, and it quietly falls back to the generic path. Upstream added a warning for this case in PR #25701.
So the number everyone quotes can't be attributed to anything. I wanted to fix the measurement.
What it does
firstflight builds the baseline nobody builds (GGML_NATIVE=OFF,
GGML_CPU_ARM_ARCH=armv8-a, GGML_CPU_REPACK=OFF) and runs a three-rung ladder against it,
so every speedup has to name its own mechanism:
generic armv8-a -> + native targeting & ggml repack -> + KleidiAI kernels
Then it does three things a benchmark usually won't:
- Proves the kernels engaged, from the model-load log. Which weight buffer loaded, which ISA tier ran. No marker, no claim.
- Measures its own noise floor by running the identical build twice under two labels. If a
delta doesn't clear that floor, the report prints
within noiseinstead of a multiplier. - Checks output drift on every rung with perplexity, so a speedup that changes what the model says can't pass itself off as free.
The result
Free ubuntu-24.04-arm runner (Azure Cobalt 100, Neoverse N2), Qwen2.5-1.5B-Instruct, 4
threads. Noise floor came out at 0.3%.
At Q4_0:
| prompt tokens | generic | + repack | + KleidiAI | repack vs generic | KleidiAI vs repack |
|---|---|---|---|---|---|
| 1,024 | 26.4 tok/s | 94.8 | 95.3 | 3.60x | 1.01x |
| 4,096 | 24.6 | 37.0 | 37.0 | 1.50x | 1.00x |
ggml's repack does all of it. KleidiAI adds nothing I can measure.
That's a real null, not a broken test. KleidiAI definitely loaded: the weight buffer reads
CPU_KLEIDIAI at 702.86 MiB, against CPU_REPACK at 885.41 MiB and CPU_Mapped at 1011.16
MiB for the floor build. It just had nothing left to take.
The standard A/B would have reported that whole 3.60x as a KleidiAI win.
Then I tested the prediction. ggml's repack targets Q4_0. So if the null really is "repack got there first", KleidiAI should have room at Q8_0. I wrote that down, then ran it:
| prompt tokens | generic | + repack | + KleidiAI | KleidiAI vs repack |
|---|---|---|---|---|
| 2,048 | 28.2 tok/s | 58.8 | 72.5 | 1.23x |
| 4,096 | 26.9 | 35.8 | 40.3 | 1.13x |
| generation | 18.1 | 39.2 | 45.2 | 1.15x |
At Q8_0 the KleidiAI build reports repack=off, kleidiai=on. That's a different code path,
not more of the same one.
So the standard benchmark is wrong in both directions. It credits KleidiAI for work it didn't do at Q4_0, and it never tests the quant where it does.
And the guardrail caught a cost. Perplexity across the Q8_0 rungs spreads 1.43%, from 31.6267 to 32.0774, with KleidiAI the outlier. At Q4_0 the spread was 0.04%, where repack and KleidiAI agreed to six significant figures. So that 23% speedup shifts what the model outputs by 1.4%. A benchmark that only watches the clock ships that without noticing.
Two things I wasn't looking for. First, the advantage inverts as context grows. The generic build stays nearly flat, 26.4 down to 22.6 tok/s, while the accelerated builds fall off a cliff, 94.8 down to 20.4, and end up behind the floor at 8k. Peak RSS is identical at 1.3 GiB on every rung, so it isn't memory pressure. I'm reporting the measurement and leaving the mechanism open.
Second, prefix caching beats every kernel here, and it isn't close. Cold TTFT 8,492 ms, warm 54 ms on the same prefix. That's 99% of prefill skipped, against 0-1% for the kernel swap this whole ladder exists to measure.
What the final output is
Not an optimized model. It's three things. A reproducible harness (pip install -e ., one CI
click, no Arm hardware needed). A standalone HTML, Markdown and JSON report per run, committed
next to the raw results. And the finding itself. Anyone benchmarking llama.cpp on Arm can
rerun the ladder against their own model and get an attribution instead of one unexplained
multiplier.
How I built it
A Python CLI wrapped around llama.cpp's own tools: llama-bench, llama-completion,
llama-server, llama-batched-bench. Every external fact (flags, JSON schemas, GGUF URLs,
runner labels, prices) is checked against live sources or real binaries and dated in the repo.
CI builds llama.cpp three ways on a free Arm runner, runs the whole evidence suite in one
dispatch, and writes the report into the run summary. Arm Performix sits behind its documented
apx recipe flow and renders hotspots wherever apx is available.
Challenges
- KleidiAI only accelerates Q4_0 and Q8_0, so the popular Q4_K_M default quietly opts out of Arm acceleration entirely. I turned that into a measured axis instead of a footnote.
- A quantized KV-cache without flash attention can be slower than f16, so that experiment pins FA on for both sides of the comparison.
- Upstream split
llama-cliintollama-completion. The old binary became an interactive REPL that never exits under CI, which cost me fourteen failed runs before I worked it out. - I found and fixed a run of measurement bugs on the way: peak-RSS attribution, sampler noise in the quality probe (it's greedy now), a cost metric that didn't line up with the prefill headline, and a kernel-tier probe that read the host's CPU flags instead of the build's. That last one made the unaccelerated floor look just as capable as the optimized rungs, which is the opposite of the point.
What I learned
Prefill is compute-bound and rewards Arm's matrix instructions heavily. Generation is bandwidth-bound and rewards cache and quant choices instead. And the biggest TTFT lever for agent serving isn't a kernel at all. It's prefix caching, by two orders of magnitude.
The broader lesson: an A/B is only as good as its baseline, and "the default build" is almost never the floor you think it is.
What's next
Land Performix hotspot attribution on a real box run, push the ladder out to larger models and
more hosts, and grow the adoption kit (docs/ADOPT.md and the workflow template) into
something other llama.cpp-on-Arm projects can drop straight in.
Setup instructions: build, run and validate on Arm64
Any machine, real inference in three commands. No compiler needed, in a fresh venv:
pip install -e ".[report,dev]"
firstflight setup-engine     # downloads the prebuilt llama.cpp for your platform
firstflight smoke            # real model download plus one real generation
pytest                       # 124 tests
Path A, Arm64 in the cloud at zero cost. This is the judge path. The arm-bench workflow
runs on a free GitHub-hosted ubuntu-24.04-arm runner (Azure Cobalt 100, Neoverse N2). Go to
Actions, pick arm-bench, hit Run workflow. It builds llama.cpp three ways (generic
armv8-a floor, native+repack default, KleidiAI), runs the attribution ladder plus the
noise-floor control, the measured prompt-cache TTFT demo and the concurrency sweep, then
renders the report into the run summary. Budget about 2h50m. Tick run_q8_only instead for
the Q8_0 ladder on its own, which takes about 2 hours. Leave run_quant_sweep off unless you
own the runner: it adds roughly 11 hours and overruns the job timeout.
To dispatch it yourself you need write access, so fork the repo, enable workflows on the fork when GitHub asks, and run it there on the same free Arm runners.
Path B, your own Arm VM for bigger models. On Ubuntu 24.04 aarch64 (AWS Graviton or any Arm instance):
bash scripts/setup_arm_vm.sh && . .venv/bin/activate && make bench && make report
Re-render any committed run without measuring anything:
firstflight report --results-dir bench/results/run-31784946201 --instance github-arm-runner
How to validate it, not just run it. The report's kleidiai column shows whether the
kernels were actually active, grepped from the model-load log rather than assumed. The kernel
evidence section names the weight buffer and ISA tier each rung really loaded. Perplexity per
rung shows whether the speedup changed what the model outputs. And every result JSON records
host, build, thread count and THP mode, so any number in the report traces back to the exact
configuration that produced it.
Scope, stated plainly
One model, two quants, one 4-vCPU Neoverse N2 host, 1k to 8k context. The Q8_0 run skips the noise-floor control, so its deltas are weighed against the 0.3% floor measured at Q4_0 rather than one of their own, and its perplexity is a single measurement per rung with no error bar. The Q4_K_M negative control and the quant, KV-cache and micro-batch sweeps are implemented but gated behind a workflow input, because they add roughly 11 hours and overrun the CI job's 300-minute timeout. Everything above was measured in the linked runs. Nothing was extrapolated.

Log in or sign up for Devpost to join the conversation.