-
-
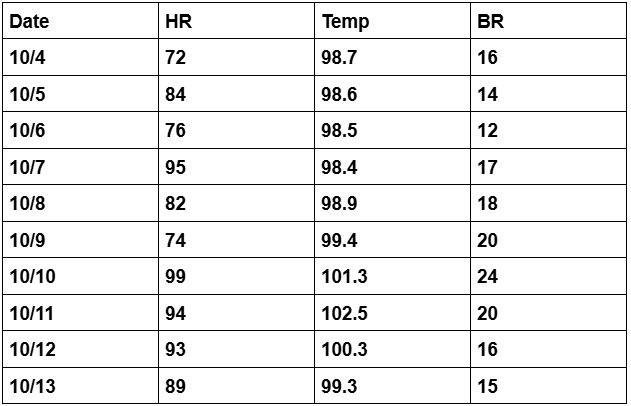
Example Patient Data Table
-
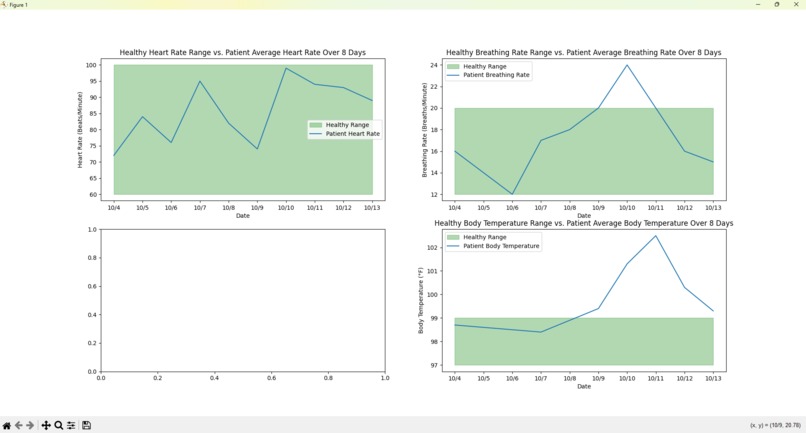
Example Patient Vitals Graphs
Inspiration
Our parents all work within the tech or medical field and have inspired us to make a simple, accessible, easy-to-use platform to manage and track one's health.
What it does
By filling out a data table of one's vitals (body temperature, breathing rate, and heart rate) and putting a screenshot of that file into our platform, any individual can view trends of their vitals and figure out if it is necessary to take further medical action. Our platform will tell the user if their vitals are within the average range (green highlighted area in graph and will present them graphs to visualize this information
How we built it
We used PyCharm with Python as our IDE and used Matplotlib to visualize the data.
Challenges we ran into
Debugging our code when we ran into scope issues and figuring out how to plot certain data.
Accomplishments that we're proud of
We are proud of making a functioning code that can fully interpret a screenshot of data and turn it into a database that can be used to make multiple graph and provide information.
What we learned
We learned how to work with data frames, make many different types of graphs, and troubleshoot many errors. Two of our team members also learned to code in Python.
What's next for ARKS Health
In the future of ARKS Health, an AI doctor will be including where a user can state their issue and the AI doctor will be able to diagnose them based on their symptoms and data.
Built With
- matplotlib
- python

Log in or sign up for Devpost to join the conversation.